Friday, November 30, 2012

Long-Term Charts Of The ECRI WLI & ECRI WLI, Gr. – November 30, 2012 Update


As I stated in my July 12, 2010 post ("ECRI WLI Growth History"):
For a variety of reasons, I am not as enamored with ECRI’s WLI and WLI Growth measures as many are.
However, I do think the measures are important and deserve close monitoring and scrutiny.
The movement of the ECRI WLI and WLI, Gr. is particularly notable at this time, as ECRI publicly announced on September 30, 2011 that the U.S. was “tipping into recession,” and ECRI has reaffirmed that view since, seen most recently in a variety of November 29 media sources including the following:
Other past notable 2012 reaffirmations of the September 30, 2011 recession call by ECRI were seen (in chronological order)  on March 15 (“Why Our Recession Call Stands”) as well as various interviews and statements the week of May 6, including:
Also, subsequent to May 2012:
-

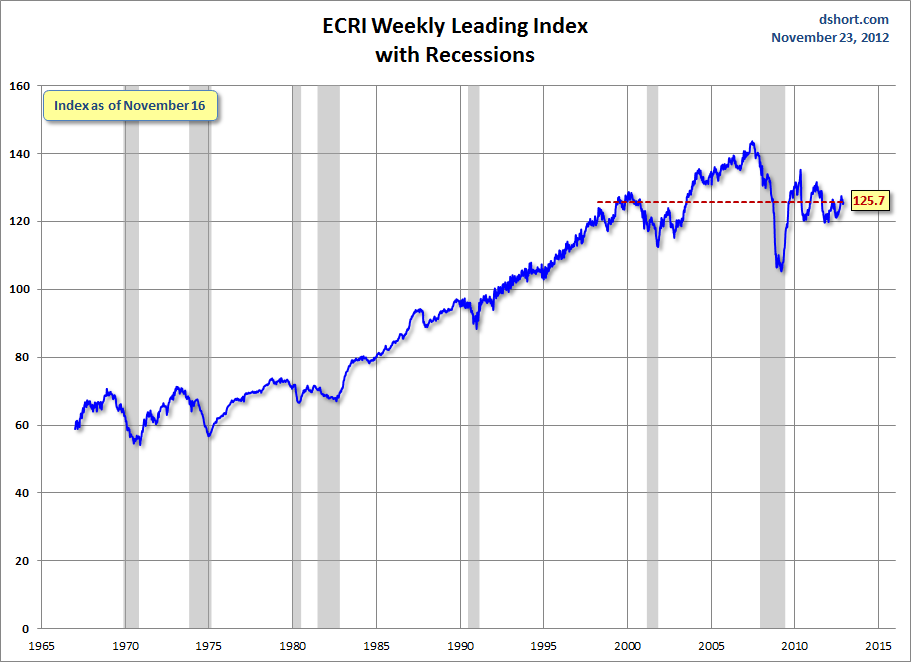
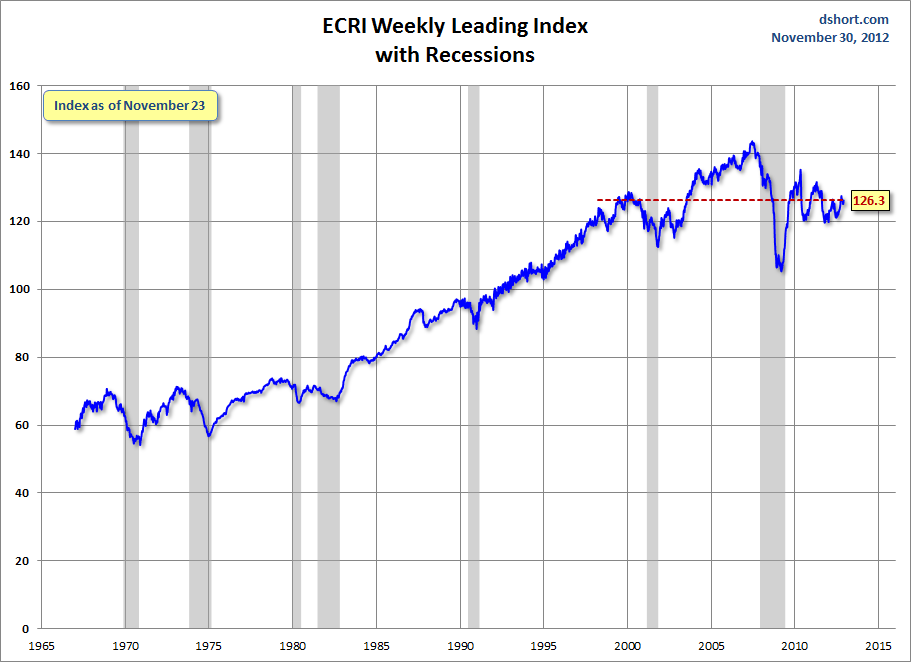
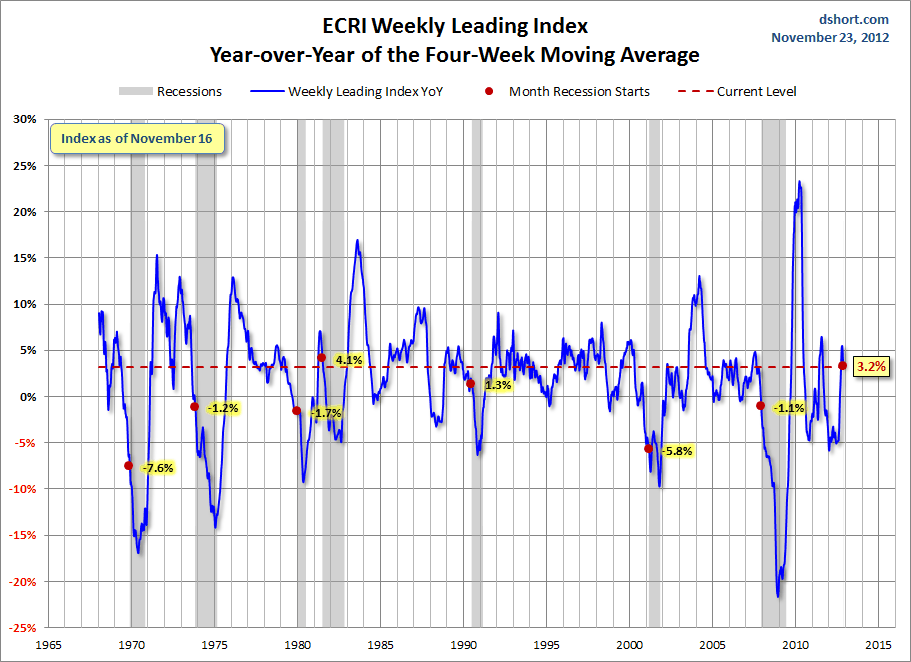
Below are three long-term charts, from Doug Short’s blog post of November 30 titled “ECRI Weekly Update:  Beating the Recession Drum.”  These charts are on a weekly basis through the November 30 release, indicating data through November 23, 2012.

Here is the ECRI WLI (defined at ECRI’s glossary):


-

This next chart depicts, on a long-term basis, the Year-over-Year change in the 4-week moving average of the WLI:


-

This last chart depicts, on a long-term basis, the WLI, Gr.:


_________

I post various economic indicators and indices because I believe they should be carefully monitored.  However, as those familiar with this blog are aware, I do not necessarily agree with what they depict or imply.
_____

The Special Note summarizes my overall thoughts about our economic situation

SPX at 1414.76 as this post is written
misc. note – corrections of blog posts


In the July 2, 2010 post I explained my policy with regard to changing the content of posts after the day the posts have been published on the blog.

St. Louis Financial Stress Index – November 29, 2012 Update


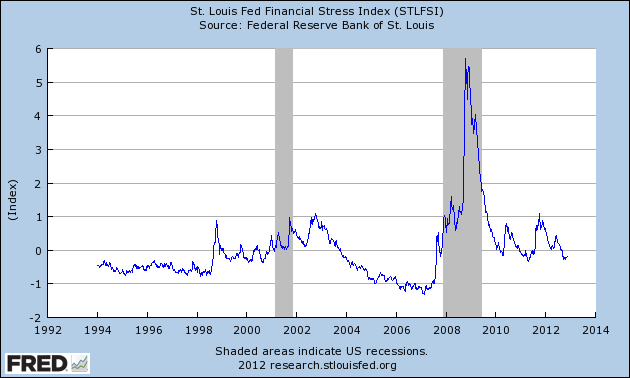
On March 28, 2011 I wrote a post ("The STLFSI") about the  STLFSI (St. Louis Fed’s Financial Stress Index) which is supposed to measure stress in the financial system.  For reference purposes, the most recent chart is seen below.  This chart was last updated on November 29, incorporating data from December 31,1993 to November 23, 2012 on a weekly basis.  The November 29, 2012 value is -.255 :

(click on chart to enlarge image)


_________

I post various indicators and indices because I believe they should be carefully monitored.  However, as those familiar with this blog are aware, I do not necessarily agree with what they depict or imply.
_____

The Special Note summarizes my overall thoughts about our economic situation

SPX at 1413.25 as this post is written

Thursday, November 29, 2012

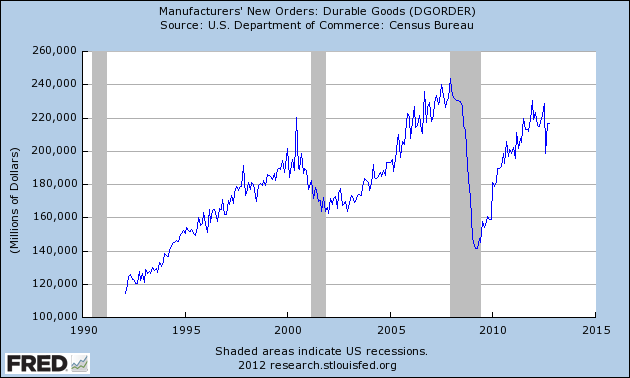
Durable Goods New Orders – Long-Term Charts Through October 2012


Many people place emphasis on Durable Goods New Orders as a prominent economic indicator and/or leading economic indicator.

For reference, here are a few charts depicting this measure.

First, from the St. Louis Fed site (FRED), a chart through October, last updated on November 28.  This value is 216,948 ($ Millions) :

(click on charts to enlarge images)


-

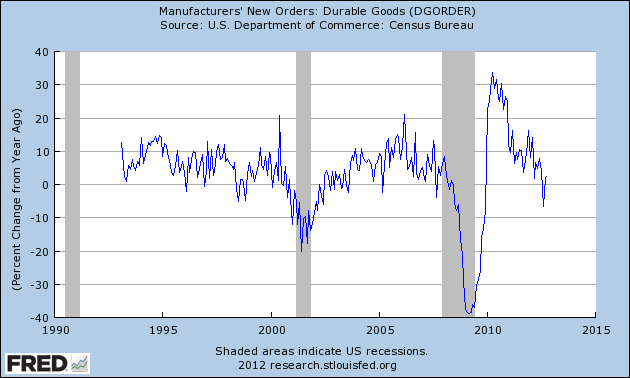
Here is the chart depicting this measure on a “Percentage Change from a Year Ago” basis:


-

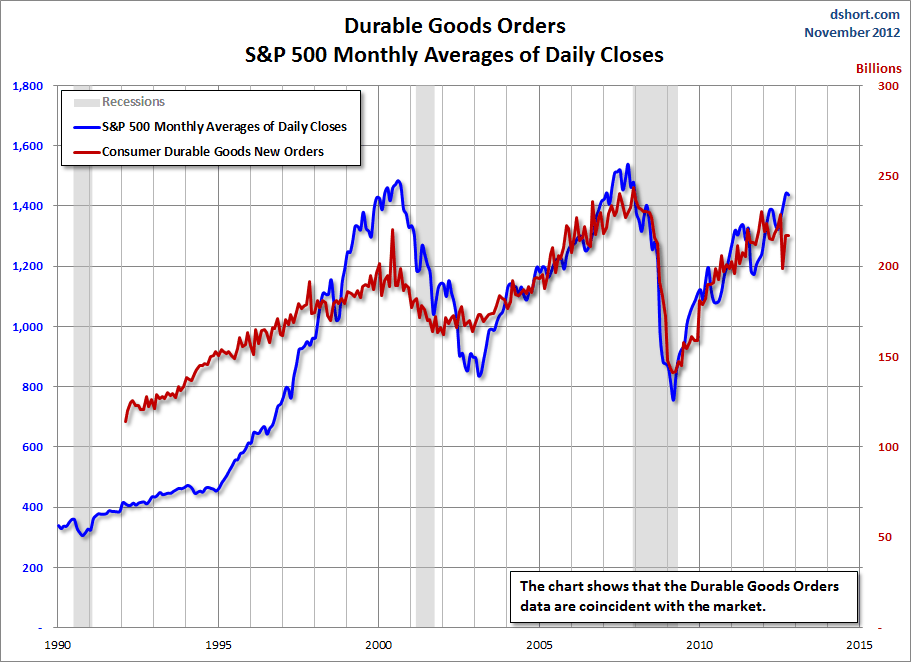
Lastly, a chart from Doug Short’s post of November 27 titled “Durable Goods Orders for October:  Essentially Unchanged” showing the Durable Goods New Orders vs. the S&P500′s monthly average of daily closes:


_____

The Special Note summarizes my overall thoughts about our economic situation

SPX at 1416.46 as this post is written
Wednesday, November 28, 2012

Broad-Based Indicators Of Economic Activity


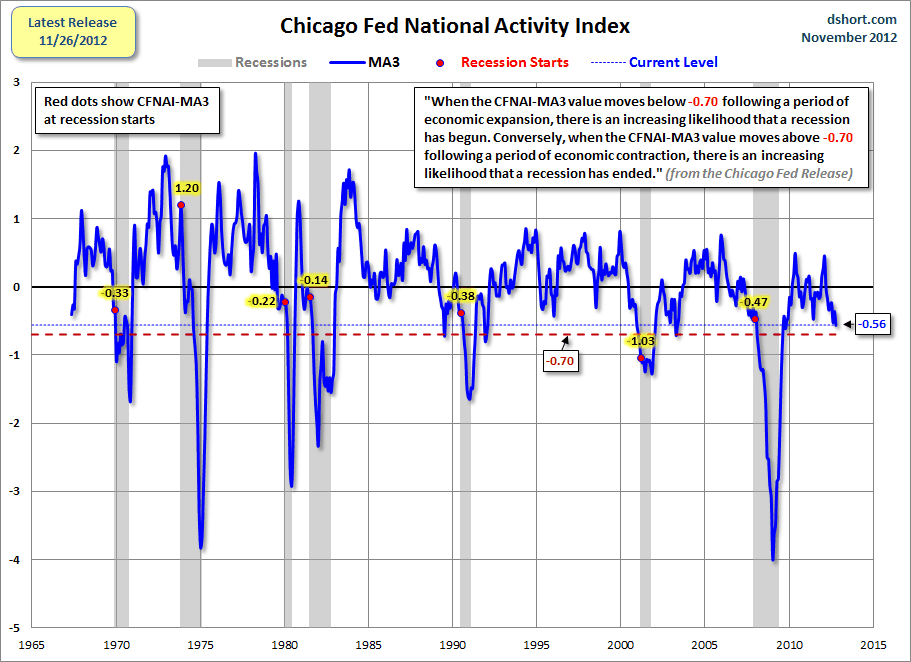
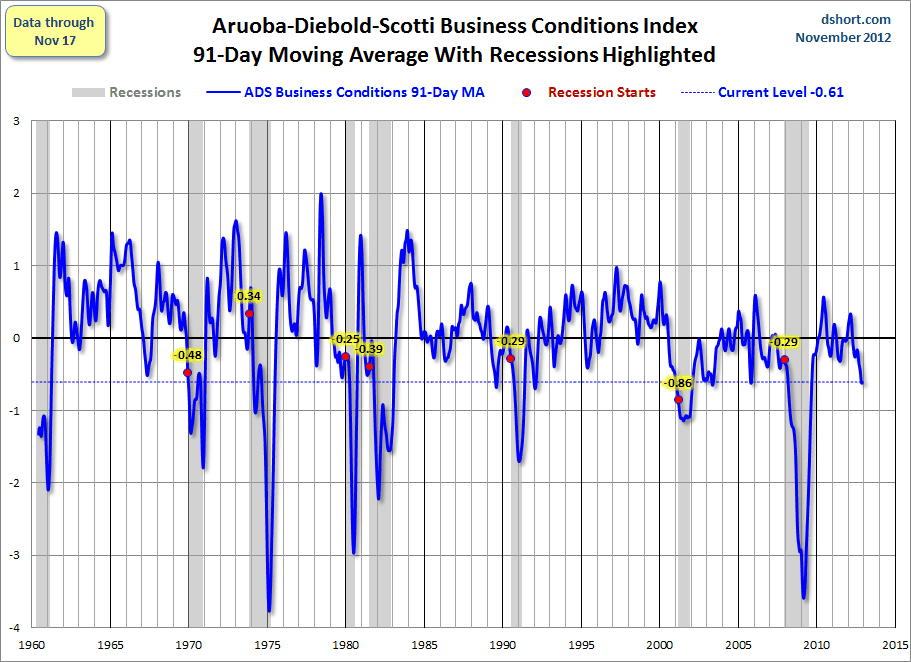
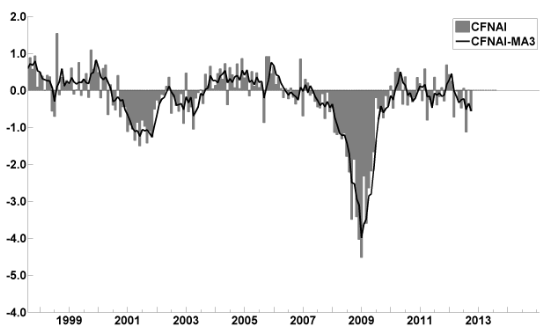
The Chicago Fed National Activity Index (CFNAI) and the Aruoba-Diebold-Scotti Business Conditions Index (ADS Index) are two broad-based economic indicators that I regularly feature in this site.

The current levels of each are notable, as they are flagging from a short-term perspective and their long-term trends continue to sink.

Doug Short, in his blog post of November 26, titled "The Philly Fed Business Conditions Index" displays both the CFNAI MA-3 (3 month Moving Average) and ADS Index (91-Day Moving Average) from a couple of perspectives.

Of particular note, two of the charts, shown below, denote where the current levels of each reading is relative to the beginning of past recessionary periods.

The CFNAI MA-3:


-

The ADS Index, 91-Day MA:


-

Also shown in the Doug Short's aforementioned post is a chart of each with a long-term trendline (linear regression.)

_________

I post various indicators and indices because I believe they should be carefully monitored.  However, as those familiar with this blog are aware, I do not necessarily agree with what they depict or imply.
_____

The Special Note summarizes my overall thoughts about our economic situation

SPX at 1392.99 as this post is written
Monday, November 26, 2012

Updates On Economic Indicators November 2012


Here is an update on various indicators that are supposed to predict and/or depict economic activity.  These indicators have been discussed in previous blog posts:

The November Chicago Fed National Activity Index (CFNAI)(pdf) updated as of November 26, 2012:


-

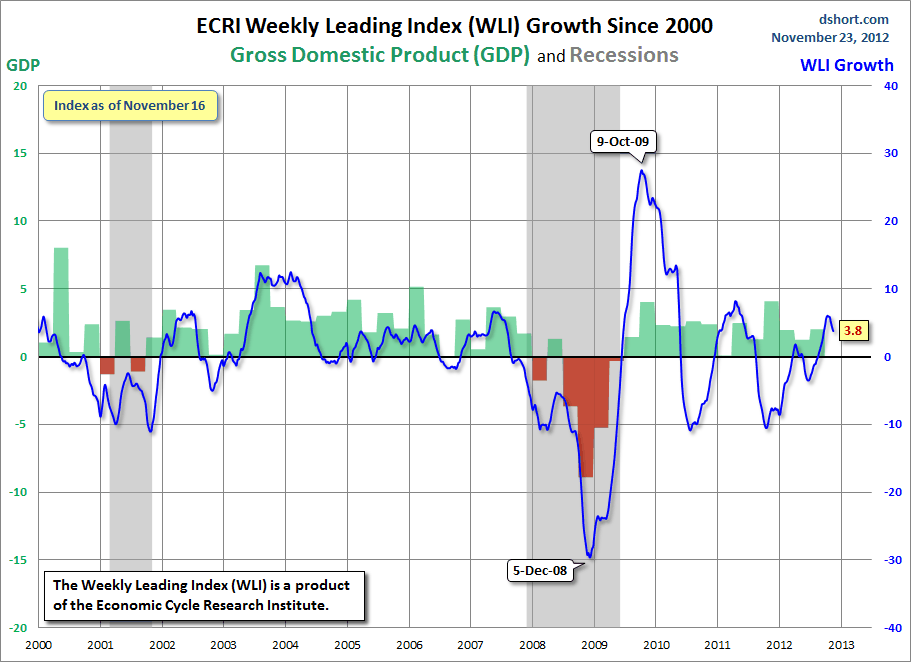
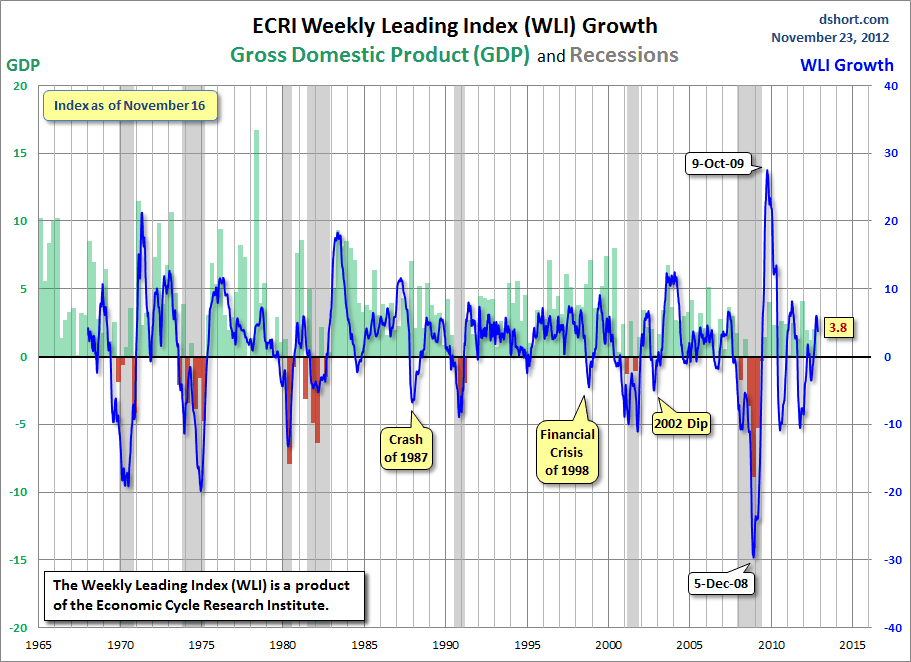
As of 11/23/12 (incorporating data through 11/16/12) the WLI was at 125.7 and the WLI, Gr. was at 3.8%.

A chart of the WLI, Gr. since 2000, from Doug Short’s blog of November 23 titled “ECRI Weekly Leading Index:  Index Rises, Growth Diminishes” :


-


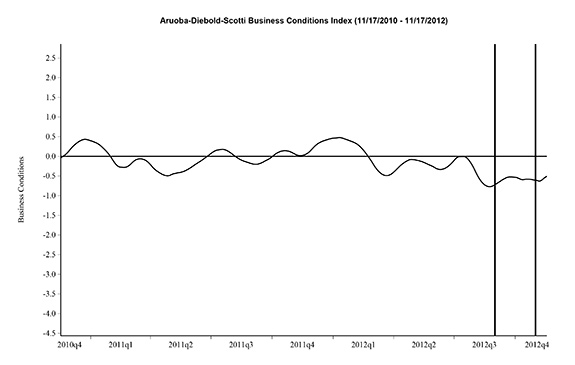
Here is the latest chart, depicting 11-17-10 to 11-17-12:

-


As per the November 21 release, the LEI was at 96.0 and the CEI was at 104.8 in October.

An excerpt from the November 21 release:
Says Ataman Ozyildirim, economist at The Conference Board: “The U.S. LEI increased slightly in October, the second consecutive increase. The LEI still points to modestly expanding economic activity in the near term.  Over the last six months, improvements in the residential construction and financial components of the LEI have offset weak consumer expectations, manufacturing new orders and labor market components. Meanwhile, the coincident economic index also increased slightly in October.”
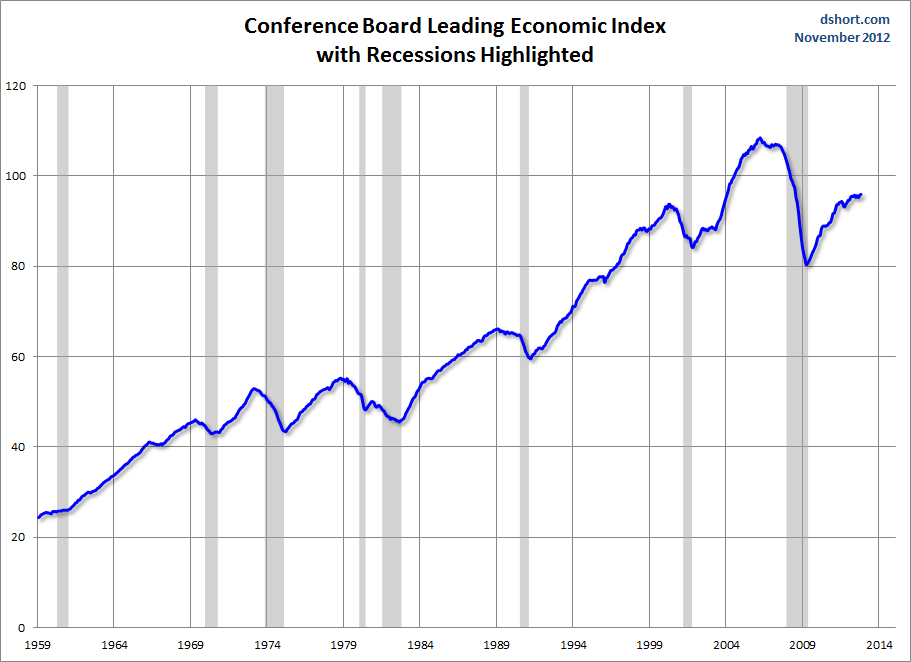
Here is a chart of the LEI from Doug Short’s blog post of November 21 titled “Conference Board Leading Economic Index:  'Increasing Slightly'” :


_________

I post various indicators and indices because I believe they should be carefully monitored.  However, as those familiar with this blog are aware, I do not necessarily agree with what they depict or imply.
_____

The Special Note summarizes my overall thoughts about our economic situation

SPX at 1402.29 as this post is written
Deflation Probabilities


While I do not agree with the current readings of the measure - I think the measure dramatically understates the probability of deflation, as measured by the CPI - the Atlanta Fed maintains an interesting data series titled "Deflation Probabilities."

As stated on the site:
Using estimates derived from Treasury Inflation-Protected Securities (TIPS) markets, described in a technical appendix, this weekly report provides two measures of the probability of consumer price index (CPI) deflation through 2017.
A chart shows the trends of the two probabilities.  As one can see in the chart, the readings are volatile.

As for the current weekly reading, the site, in the November 21 update,  states the following:
Prices of Treasury Inflation-Protected Securities (TIPS) with similar maturity dates can be used to measure probabilities of a net decline in the consumer price index over the five-year period starting in early 2011 or the five-year period starting in early 2012. One measure of the probability of deflation for the 2012–17 period rose from 9 percent on November 14 to 11 percent on November 20. The deflation probability for the 2011–16 period ticked up from 9 percent on November 14 to 10 percent on November 20.
I plan on providing updates to this measure on a regular interval.
_________

I post various economic indicators and indices because I believe they should be carefully monitored.  However, as those familiar with this blog are aware, I do not necessarily agree with what they depict or imply.
_____

The Special Note summarizes my overall thoughts about our economic situation

SPX at 1401.56 as this post is written
Friday, November 23, 2012

Long-Term Charts Of The ECRI WLI & ECRI WLI, Gr. – November 23, 2012 Update


As I stated in my July 12, 2010 post ("ECRI WLI Growth History"):
For a variety of reasons, I am not as enamored with ECRI’s WLI and WLI Growth measures as many are.
However, I do think the measures are important and deserve close monitoring and scrutiny.
The movement of the ECRI WLI and WLI, Gr. is particularly notable at this time, as ECRI publicly announced on September 30, 2011 that the U.S. was “tipping into recession,” and ECRI has reaffirmed that view since, most recently in a September 13 release titled “The 2012 Recession:  Are We There Yet?” and September 13 Bloomberg video titled “Recession Update.”

Other past notable 2012 reaffirmations of the September 30, 2011 recession call by ECRI were seen (in chronological order)  on March 15 (“Why Our Recession Call Stands”) as well as various interviews and statements the week of May 6, including:
Also, subsequent to May 2012:
Below are three long-term charts, from Doug Short’s blog post of November 23 titled “ECRI Weekly Leading Index:  Index Rises, Growth Diminishes.”  These charts are on a weekly basis through the November 23 release, indicating data through November 16, 2012.

Here is the ECRI WLI (defined at ECRI’s glossary):


-

This next chart depicts, on a long-term basis, the Year-over-Year change in the 4-week moving average of the WLI:


-

This last chart depicts, on a long-term basis, the WLI, Gr.:


_________

I post various economic indicators and indices because I believe they should be carefully monitored.  However, as those familiar with this blog are aware, I do not necessarily agree with what they depict or imply.
_____

The Special Note summarizes my overall thoughts about our economic situation

SPX at 1409.15 as this post is written
St. Louis Financial Stress Index – November 22, 2012 Update


On March 28, 2011 I wrote a post ("The STLFSI") about the  STLFSI (St. Louis Fed’s Financial Stress Index) which is supposed to measure stress in the financial system.  For reference purposes, the most recent chart is seen below.  This chart was last updated on November 22, incorporating data from December 31,1993 to November 16, 2012 on a weekly basis.  The November 22, 2012 value is -.184 :

(click on chart to enlarge image)


_________

I post various indicators and indices because I believe they should be carefully monitored.  However, as those familiar with this blog are aware, I do not necessarily agree with what they depict or imply.
_____

The Special Note summarizes my overall thoughts about our economic situation

SPX at 1403.75 as this post is written
Wednesday, November 21, 2012

Current Economic Situation


With regard to our current economic situation,  my thoughts can best be described/summarized by the posts found under the 18 “Building Financial Danger” posts.

My thoughts concerning our ongoing economic situation – with future implications – can be seen on the page titled “A Special Note On Our Economic Situation,” which has been listed on every blog post since August 15, 2010.
_____

The Special Note summarizes my overall thoughts about our economic situation

SPX at 1391.20 as this post is written
Tuesday, November 20, 2012

Financial Stocks - November 20, 2012 Update Concerning Poor “Price Action”


On June 29, 2011 I wrote a blog post titled “Financial Stocks – Notable Price Action.”  This post is the latest update of that message.

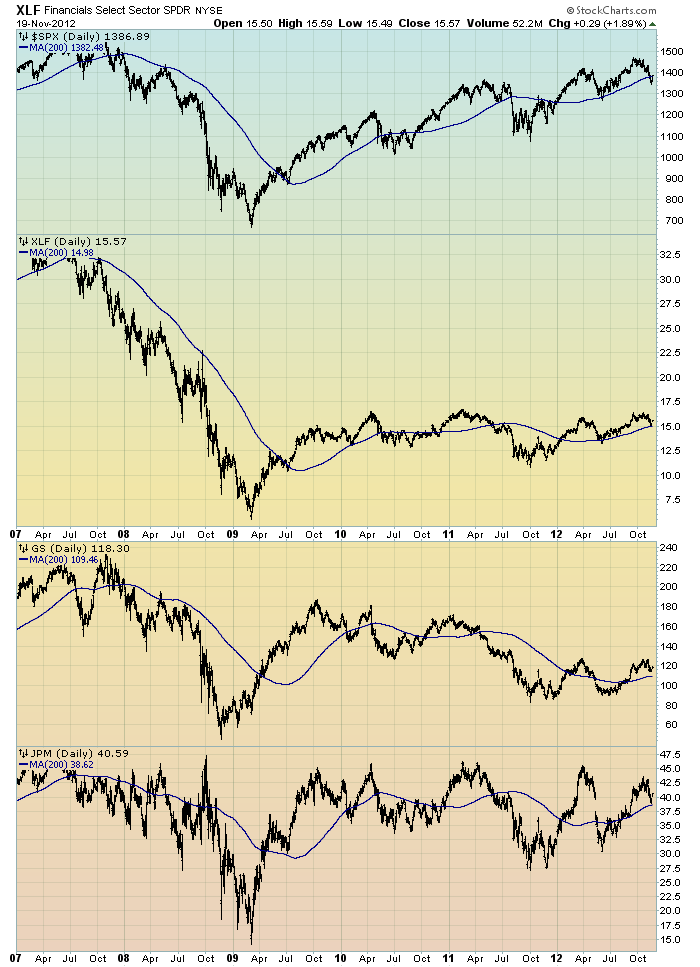
Although financial stocks have increased in price in 2012, I continue to believe that the longer-term “price action” of various financial stocks is disconcerting.  I view the poor performance of these financial and brokerage stocks to be one indicator among (very) many that serves as a “red flag” as to the financial markets and economy as a whole.

Here is an updated chart to that shown in the aforementioned June 29, 2011 post.  It shows the XLF (the financial ETF) on a daily basis since 2007.  As well, the S&P500 is plotted above it, with GS and JPM shown below it.  The blue line on each indicates the 200dma:

(click on chart image to enlarge)(chart courtesy of StockCharts.com; chart created by and annotated by author)


_____

The Special Note summarizes my overall thoughts about our economic situation

SPX at 1385.84 as this post is written
Monday, November 19, 2012

Financial Stocks – Relative Price To Overall Stock Market – November 19, 2012 Update


In the June 29, 2011 post (“Financial Stocks – Notable Price Action”) I wrote the following:
I think that the relatively poor “price action” of various financial stocks is notable.  It is one of many current indications that overall stock market health is not as strong as a casual glance at the major indices would indicate.
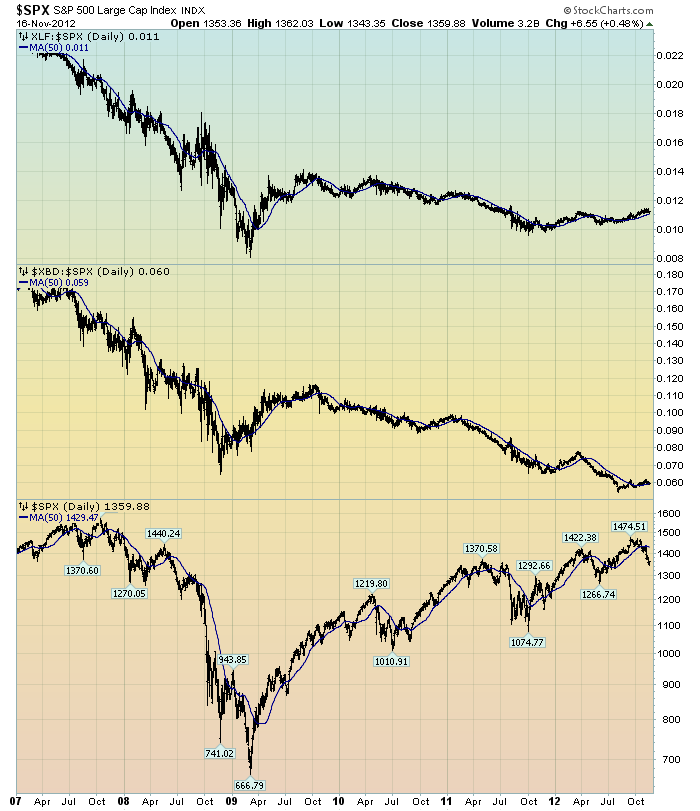
I continue to believe that the lagging / “sagging” price of various financial stocks is highly notable.  Here is a chart that I created a while ago that provides another view of the poor “price action” of the financial stocks vs. that of the entire stock market, as depicted by the S&P500:

(click on chart to enlarge image)(chart courtesy of StockCharts.com; chart created by and annotated by author)


-

The above chart is depicted on a daily basis, LOG scale, since 2007.   On each of the three plots, a blue line depicts the 50dma for perspective.

As one can see, there has been an interesting progression of the relative price of the XLF (Financial SPDR) vs. the S&P500, as seen in the top of the chart.  In the middle of the chart, the same can be seen in the $XBD (Broker/Dealer Index).  Generally, since mid-2009, the price of both the XLF and $XBD have been on a slow downward trajectory relative to the price of the S&P500.  The S&P500 is plotted on the bottom of the chart.

In my experience, any time the financials lag the general stock market for a considerable period, it is generally a “red flag” that should be closely monitored.
_____

The Special Note summarizes my overall thoughts about our economic situation

SPX at 1359.88 as this post is written
Friday, November 16, 2012

Long-Term Charts Of The ECRI WLI & ECRI WLI, Gr. – November 16, 2012 Update


As I stated in my July 12, 2010 post ("ECRI WLI Growth History"):
For a variety of reasons, I am not as enamored with ECRI’s WLI and WLI Growth measures as many are.
However, I do think the measures are important and deserve close monitoring and scrutiny.
The movement of the ECRI WLI and WLI, Gr. is particularly notable at this time, as ECRI publicly announced on September 30, 2011 that the U.S. was “tipping into recession,” and ECRI has reaffirmed that view since, most recently in a September 13 release titled “The 2012 Recession:  Are We There Yet?” and September 13 Bloomberg video titled “Recession Update.”

Other past notable 2012 reaffirmations of the September 30, 2011 recession call by ECRI were seen (in chronological order)  on March 15 (“Why Our Recession Call Stands”) as well as various interviews and statements the week of May 6, including:
Also, subsequent to May 2012:
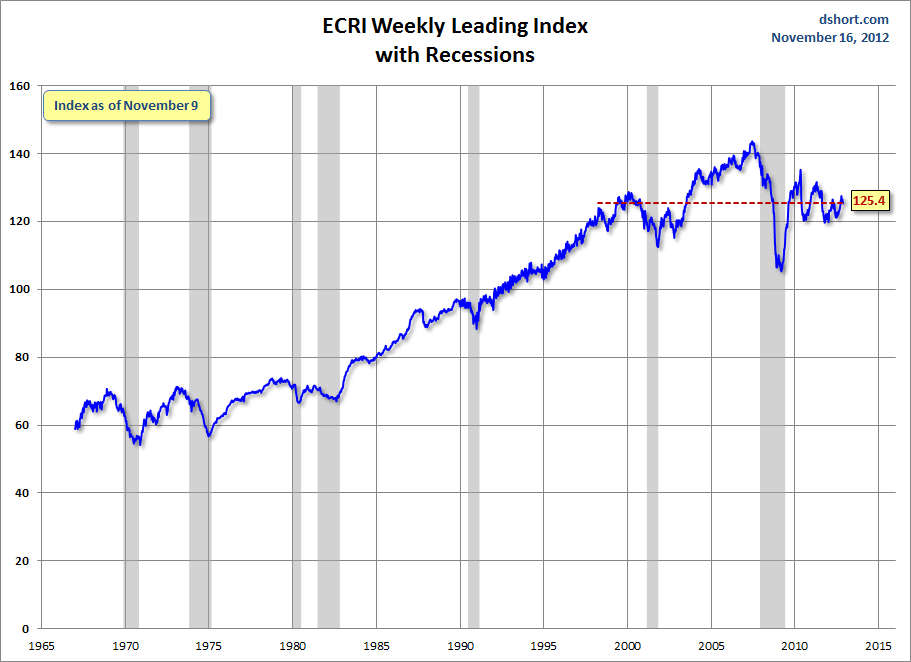
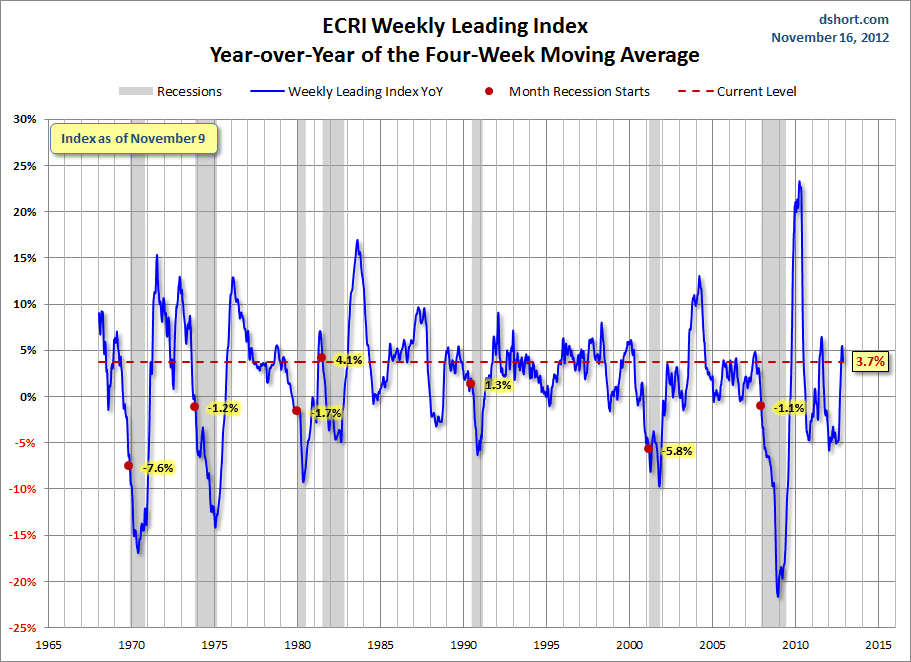
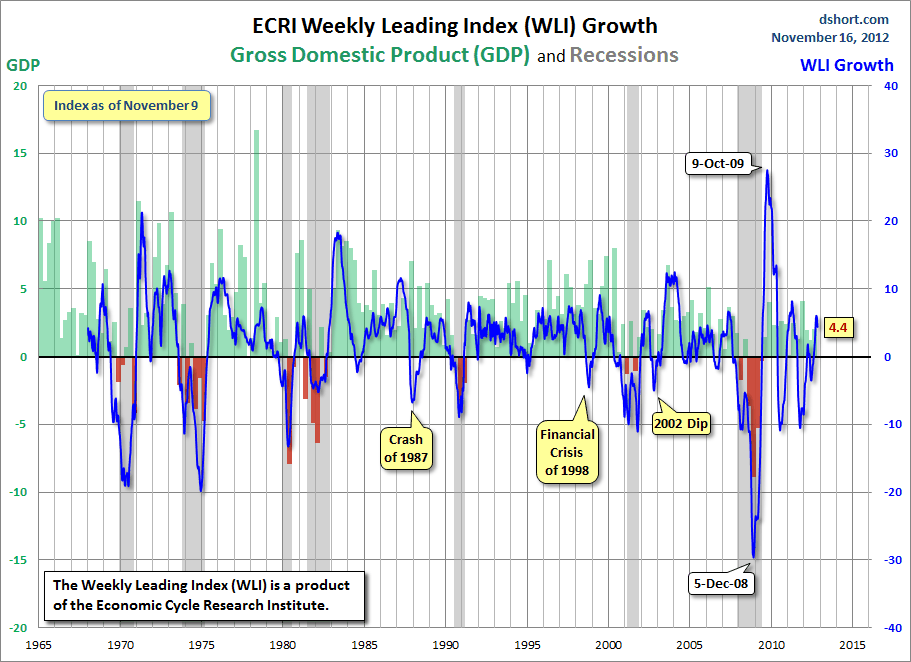
Below are three long-term charts, from Doug Short’s blog post of November 16 titled “ECRI Weekly Leading Index:  The Slippage Continues.”  These charts are on a weekly basis through the November 16 release, indicating data through November 9, 2012.

Here is the ECRI WLI (defined at ECRI’s glossary):


-

This next chart depicts, on a long-term basis, the Year-over-Year change in the 4-week moving average of the WLI:


-

This last chart depicts, on a long-term basis, the WLI, Gr.:


_________

I post various economic indicators and indices because I believe they should be carefully monitored.  However, as those familiar with this blog are aware, I do not necessarily agree with what they depict or imply.
_____

The Special Note summarizes my overall thoughts about our economic situation

SPX at 1355.42 as this post is written
St. Louis Financial Stress Index – November 15, 2012 Update


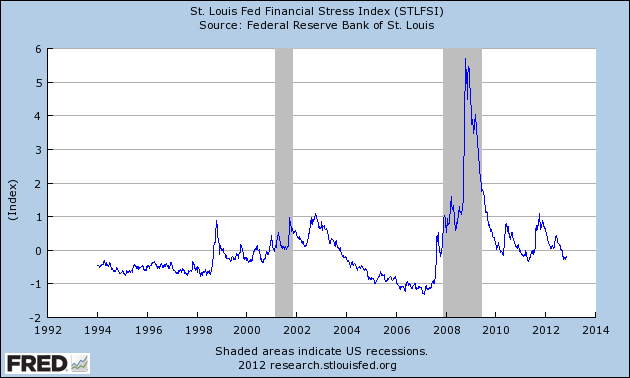
On March 28, 2011 I wrote a post ("The STLFSI") about the  STLFSI (St. Louis Fed’s Financial Stress Index) which is supposed to measure stress in the financial system.  For reference purposes, the most recent chart is seen below.  This chart was last updated on November 15, incorporating data from December 31,1993 to November 9, 2012 on a weekly basis.  The November 9, 2012 value is -.196 :

(click on chart to enlarge image)


_________

I post various indicators and indices because I believe they should be carefully monitored.  However, as those familiar with this blog are aware, I do not necessarily agree with what they depict or imply.
_____

The Special Note summarizes my overall thoughts about our economic situation

SPX at 1347.16 as this post is written

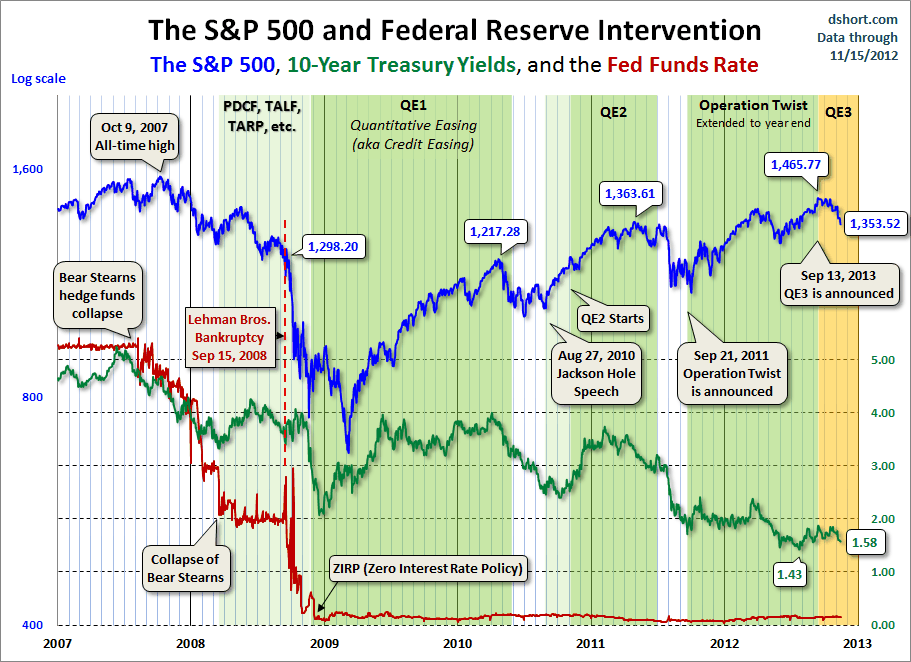
Markets During Periods Of Federal Reserve Intervention – November 15, 2012 Update


In the August 9, 2011 post ("QE3 – Various Thoughts") I posted a chart that depicted the movements of the S&P500, 10-Year Treasury Yield and the Fed Funds rate spanning the periods of various Federal Reserve interventions since 2007.

For reference purposes, here is an updated chart from Doug Short’s blog post of November 15 (“Treasury Yields/Mortgage Rate Update:  Historic Low 30-Year Fixed") :

(click on chart to enlarge image)


_____

The Special Note summarizes my overall thoughts about our economic situation

SPX at 1351.25 as this post is written

Thursday, November 15, 2012

Walmart’s Q3 2013 Results – Comments


I found various notable items in Walmart’s Q3 2013 earnings call transcript (pdf) dated November 15, 2012.  I view Walmart’s results and comments as particularly noteworthy given their retail prominence and focus on low prices.  I have previously commented on their quarterly conference call comments; these previous posts are found under the “paycheck to paycheck” tag.

Here are various excerpts that I find most notable:

comments from Mike Duke, page 8:

Walmart U.S. posted a comp sales increase of 1.5 percent, and delivered approximately $2.3 billion in net sales growth.

also:

Price will continue to be a major factor for customers over the holidays. Our strong price position and broad assortment are clear competitive advantages in an economy where customers may still be cautious with their budgets.

comments from Mike Duke, page 9:

Across all of our markets, we are seeing the same price consciousness as we do in the U.S.

comments from Jeff Davis, page 11:

Consolidated gross profit rate was 24.5 percent, a 13-basis point reduction compared to the same time last year. You will hear more from our segment CEOs regarding their price investment in just a few moments.

also:

With respect to operating expenses, the company leveraged expenses by 17 basis points, which covered the 13-basis point investment in gross profit rate. We are pleased to have delivered operating leverage for the quarter, despite the $105 million in pre-tax items I mentioned earlier.

comments from Bill Simon, page 14:

The earlier launch of our expanded layaway program generated approximately $300 million in additional third quarter volume versus last year, most of which we will recognize in the fourth quarter when the customers pay for and pick up the merchandise.

comments from Bill Simon, page 16:

Gross profit increased $443 million versus last year to $18.3 billion.  During the third quarter, gross profit rate decreased 30 basis points year-over-year, as we continued to reduce margin and execute the strategic price investments.

We also continue to significantly leverage expenses. For the quarter, operating expenses grew only 1.8 percent, half the rate of sales growth. Even with the impact of higher field incentive payouts this quarter, our team leveraged operating expenses as a percentage of sales by 37 basis points.

comments from Charles Holley, page 36:

While we are optimistic about sales, we are also realistic. Current macroeconomic conditions continue to pressure our customers.
_____

The Special Note summarizes my overall thoughts about our economic situation

SPX at 1352.93 as this post is written