Friday, June 28, 2013

Long-Term Charts Of The ECRI WLI & ECRI WLI, Gr. – June 28, 2013 Update

As I stated in my July 12, 2010 post ("ECRI WLI Growth History"):
For a variety of reasons, I am not as enamored with ECRI’s WLI and WLI Growth measures as many are.
However, I do think the measures are important and deserve close monitoring and scrutiny.
The movement of the ECRI WLI and WLI, Gr. is particularly notable at this time, as ECRI publicly announced on September 30, 2011 that the U.S. was “tipping into recession,” and ECRI has reiterated the view that the U.S. economy is currently in a recession, seen most recently in these five sources :
Other past notable 2012 reaffirmations of the September 30, 2011 recession call by ECRI were seen (in chronological order)  on March 15 (“Why Our Recession Call Stands”) as well as various interviews and statements the week of May 6, including:
Also, subsequent to May 2012:
-

Below are three long-term charts, from Doug Short’s blog post of June 28 titled “ECRI Recession Watch:  Weekly Update”  These charts are on a weekly basis through the June 28 release, indicating data through June 21, 2013.

Here is the ECRI WLI (defined at ECRI’s glossary):

(click on charts to enlarge images)

Dshort 6-28-13 ECRI-WLI 130.6

-

This next chart depicts, on a long-term basis, the Year-over-Year change in the 4-week moving average of the WLI:

Dshort 6-28-13 ECRI-WLI-YoY 7.6 percent

-

This last chart depicts, on a long-term basis, the WLI, Gr.:

Dshort 6-28-13 ECRI-WLI-growth-since-1965 5.8

_________

I post various economic indicators and indices because I believe they should be carefully monitored.  However, as those familiar with this blog are aware, I do not necessarily agree with what they depict or imply.
_____

The Special Note summarizes my overall thoughts about our economic situation

SPX at 1615.45 as this post is written

St. Louis Financial Stress Index – June 27, 2013 Update

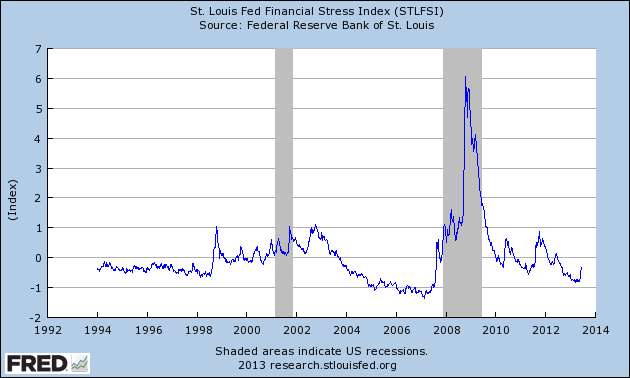
On March 28, 2011 I wrote a post ("The STLFSI") about the  St. Louis Fed’s Financial Stress Index (STLFSI) which is supposed to measure stress in the financial system.  For reference purposes, the most recent chart is seen below.  This chart was last updated on June 27, incorporating data from December 31,1993 to June 21, 2013, on a weekly basis.  The June 21, 2013 value is -.318 :

(click on chart to enlarge image)

STLFSI_6-27-13 -.318

-

Here is the STLFSI chart from a 1-year perspective:

STLFSI_6-27-13 -.318 1-year
Data Source: FRED, Federal Reserve Economic Data, Federal Reserve Bank of St. Louis; accessed June 28, 2013:

_________

I post various indicators and indices because I believe they should be carefully monitored.  However, as those familiar with this blog are aware, I do not necessarily agree with what they depict or imply.
_____

The Special Note summarizes my overall thoughts about our economic situation

SPX at 1613.11 as this post is written

Thursday, June 27, 2013

Statement Concerning Too Big To Fail (TBTF)

I found the Opening Statement at the Full Committee Hearing on 'Too-Big-to-Fail' Post- Dodd-Frank, made yesterday (June 26) by The Committee On Financial Services' Chairman Hensarling, to be notable.

While I don't necessarily agree with everything said in this Opening Statement - or with all aspects of the following excerpts - here are the excerpts I found most notable:
Today, though, there is a growing bipartisan consensus that the Dodd-Frank Act regrettably did not end the Too Big To Fail phenomenon or its consequent bailouts.
also:
Ending taxpayer funded bailouts is one of the reasons why this committee has invested so much time on Sustainable Housing Reform. The GSEs, Fannie and Freddie, are the original Too Big to Fail poster children, yet were untouched and unreformed in Dodd-Frank. They have received the largest taxpayer bailout ever - nearly $200 billion. Along with the FHA, the government now controls more than 90% of our nation’s mortgage finance market with no end in sight.
also:
Regrettably, Dodd-Frank not only fails to end Too Big to Fail and its attendant taxpayer bailouts – it actually codifies them into law. Title I, Section 113 allows the federal government to actually designate Too Big to Fail firms – also known as SIFIs. In turn, Title II, Section 210, notwithstanding its expost funding language, clearly creates a taxpayer funded bailout system that the CBO estimates will cost taxpayers over $20 billion.
Designating any firm Too Big to Fail is bad policy and worse economics. It causes the erosion of market discipline and risks further bailouts paid in full by hardworking Americans. It also becomes a self-fulfilling prophecy, helping make firms bigger and riskier than they otherwise would be. Since the passage of Dodd-Frank, the big financial institutions have gotten bigger, the small financial institutions have become fewer, the taxpayer has become poorer, and credit allocation has become more political.
my comment:

I’ve previously discussed “Too Big To Fail” and “Moral Hazard” in numerous posts.

I continue to believe that Too Big To Fail (TBTF) and Moral Hazard issues are of paramount importance.  Regrettably, my analyses indicate that the issues lack both recognition and effective remedy.
_____

The Special Note summarizes my overall thoughts about our economic situation

SPX at 1613.93 as this post is written

Deloitte “CFO Signals” Report 2Q 2013 – Notable Aspects

Recently Deloitte released their “CFO Signals” “High-Level Summary” report for the 2nd Quarter of 2013.
As seen in page 2 of the report, “One hundred and five CFOs responded this quarter. Seventy percent of the CFOs are from public companies, and 80% are from companies with more than $1B in annual revenue.”

Here are some of the excerpts that I found notable:

from page 3 :

How do CFOs regard the current and future health of some of the world’s major economies?
CFOs are feeling reasonably good about North America and China, but expectations for Europe are dour. More CFOs rate North America’s economic health as good than as bad, and nearly two-thirds are optimistic about the region’s trajectory. By comparison, 53% are optimistic about China, and just 14% are optimistic about Europe.

also:

How do companies expect performance, spending, and hiring to change over the next 12 months?
Growth and profitability expectations remain modest this quarter, with sales growth expectations only slightly higher at 5.7% (still below the 7% long-term average) and earnings growth lower at 10.3%* (well below the 12.3% historical average). Capital spending growth expectations declined to 7.5%*, but dividend growth rose to 4.5%* (well above their longer-term average). Domestic hiring growth expectations improved to a still-muted 2.4% (the U.S. sits at just 1.3%, and 21% of all CFOs still expect cuts).

How does CFOs’ optimism regarding their companies’ prospects compare to last quarter?
CFO optimism continued to rebound this quarter, rising from a strong +32 last quarter to an even stronger +46 this quarter. Nearly 60% of CFOs express rising optimism, and just 13% express rising pessimism (the lowest proportion in the three-year history of this survey).

from page 4:

On the face of things, this quarter seems a lot like the last. Companies are performing relatively well, but they’re still doing it mostly through tight cost management and intense business focus – and not by riding waves of growing customer demand.

also:

But despite all these similarities, this quarter feels notably different. CFOs’ responses this quarter seem to indicate an air of optimism that has been mostly absent for well over a year. Perhaps the best news is that CFOs mostly see North America’s economies as healthy, and they are particularly bullish about where they will be next year. And at a company level, more are positive about their own prospects than has been the case since the first quarter of 2012.

from page 5:

Modest growth expectations are continuing to take a toll on investment. At 7.5%, capital spending growth expectations are below their long-term survey average, and domestic hiring growth expectations are still muted at 2.4% (the U.S. sits at just 1.3%, and 21% of all CFOs expect cuts). Instead of committing to these longer-term investments, CFOs say their companies are more likely to give cash back to shareholders; dividend growth expectations reached their highest level in nearly three years, and share buybacks are expected to be one of the top uses of cash for 2013.

also:

Growth is important, but profitability is still king when it comes to driving CFO compensation. More than 95% of CFOs report at least moderate influence and 75% report strong influence. But it is interesting to note that economic performance (through metrics like ROIC that incorporate both income statement and balance sheet measures) are the next strongest driver of CFO pay, with more than 70% of CFOs reporting moderate or strong influence. Also interesting is that measures more limited to the functional scope of finance (factors like liquidity, cost of capital, treasury returns, and tax efficiency) are considerably less influential – but there are important industry differences.

_____

I post various business and economic surveys because I believe they should be carefully monitored.  However, as those familiar with this blog are aware, I do not necessarily agree with many of the consensus estimates and much of the commentary in these surveys.
_____

The Special Note summarizes my overall thoughts about our economic situation

SPX at 1614.88 as this post is written

June 2013 Duke/CFO Magazine Global Business Outlook Survey – Notable Excerpts

On June 5 the June Duke/CFO Magazine Global Business Outlook Survey (pdf) was released.  It contains a variety of statistics regarding how CFOs view business and economic conditions.

In this CFO Survey, I found the following to be the most notable excerpts:
...optimism among CFOs about the U.S. economy is now above the long-run average for only the second time since 2007.
also:
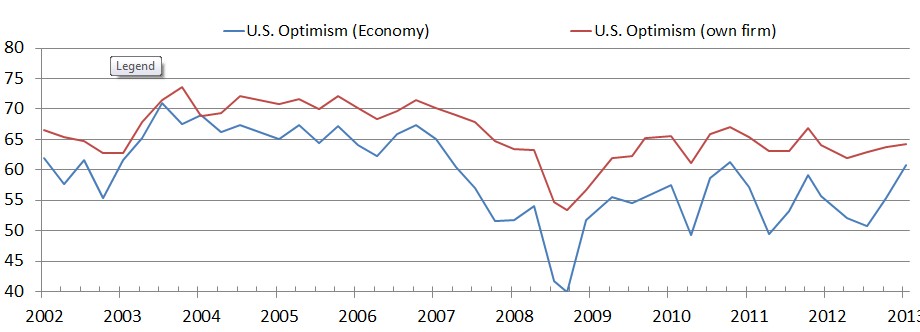
CFO optimism about the U.S. economy has rebounded this quarter. The U.S. Business Optimism Index rebounded to 61 on a scale from 0 to 100, well above last quarter’s reading of 55 and also above the long-run average index value of 59.  Latin American CFOs are the most optimistic in the world (66, down from 69 last quarter), followed by Asian business leaders (62). African (56) and European (53, same as last quarter) CFOs are less optimistic about the future.
Despite the jump in optimism about the overall economy, U.S. companies plan only moderate increases in business spending (planned increase of 6 percent over the next 12 months, up from 5 percent last quarter) and full-time domestic employment (up 1 percent, not enough to significantly affect the unemployment rate.)
The CFO survey contains the Optimism Index chart, showing U.S. Optimism (with regard to the economy) at 61, as seen below:
Duke CFO Magazine Survey US Optimism 6-5-13

-

It should be interesting to see how well the CFOs predict business and economic conditions going forward.   I discussed various aspects of this, and the importance of these predictions, in the July 9, 2010 post titled “The Business Environment”.

(past posts on CEO and CFO Surveys can be found under the “CFO and CEO Confidence” tag)
_____

I post various economic forecasts because I believe they should be carefully monitored.  However, as those familiar with this blog are aware, I do not necessarily agree with many of the consensus estimates and much of the commentary in these forecast surveys.
_____

The Special Note summarizes my overall thoughts about our economic situation

SPX at 1617.46 as this post is written

Consumer Confidence Surveys – As Of June 27, 2013

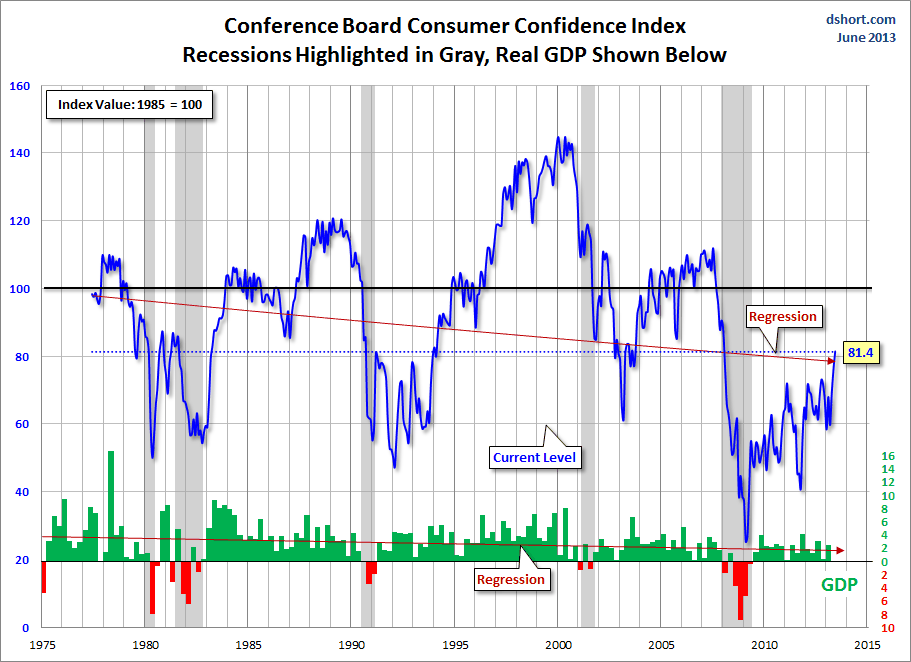
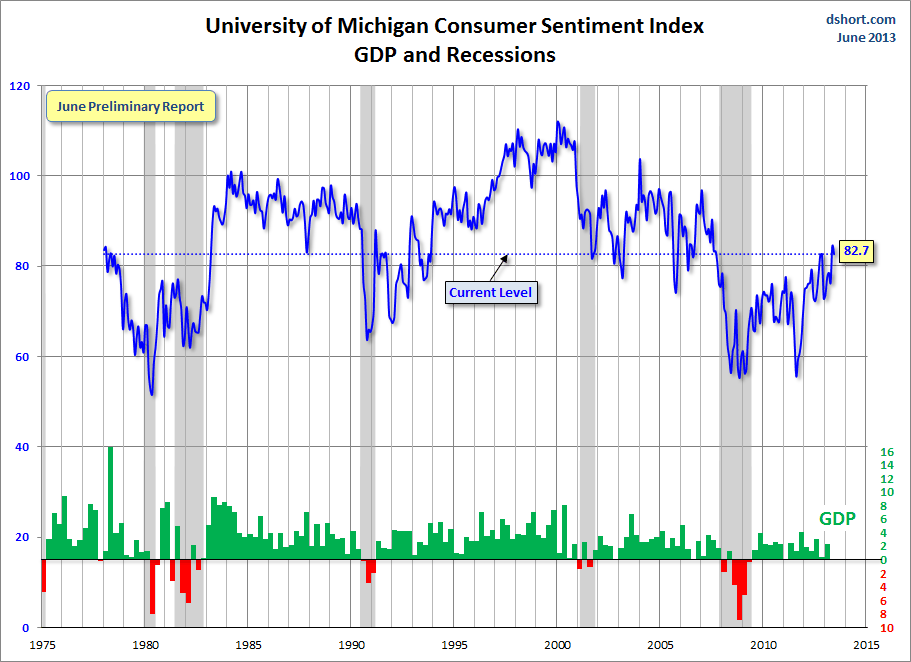
Doug Short had a blog post of June 25 ("Consumer Confidence Beats Expectations, Highest Since January 2008") in which he presents the latest Conference Board Consumer Confidence and Thomson/Reuters University of Michigan Consumer Sentiment Index charts.  They are presented below:

(click on charts to enlarge images)

Dshort 6-25-13 Conference-Board-consumer-confidence-index

-

Dshort 6-25-13 Michigan-consumer-sentiment-index

-

There are a few aspects of the above charts that I find highly noteworthy.  Of course, the continuing subdued absolute levels of these two surveys is disconcerting.

Also, I find the “behavior” of these readings to be quite disparate as compared to the other post-recession periods, as shown in the charts between the gray shaded areas (the gray areas denote recessions as defined by the NBER.)

While I don’t believe that confidence surveys should be overemphasized, I find these readings to be very problematical, especially in light of a variety of other highly disconcerting measures highlighted throughout this blog.
_____

The Special Note summarizes my overall thoughts about our economic situation

SPX at 1603.26 as this post is written

Wednesday, June 26, 2013

Durable Goods New Orders – Long-Term Charts Through May 2013

Many people place emphasis on Durable Goods New Orders as a prominent economic indicator and/or leading economic indicator.

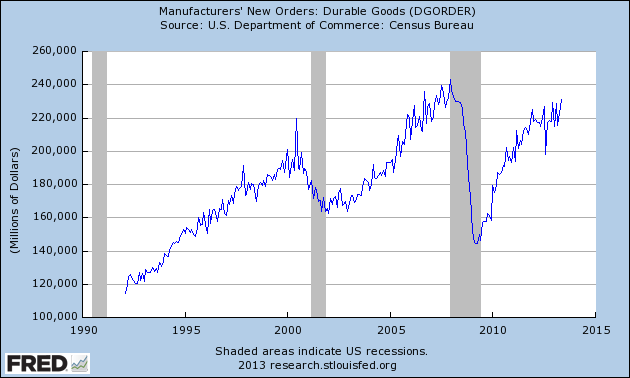
For reference, below are charts depicting this measure.

First, from the St. Louis Fed site (FRED), a chart through May, last updated on June 25.  This value is 231,030 ($ Millions) :

(click on charts to enlarge images)

DGORDER_6-25-13

-

Here is the chart depicting this measure on a “Percentage Change from a Year Ago” basis:

DGORDER_6-25-13 Percent Change From Year Ago
Data Source: FRED, Federal Reserve Economic Data, Federal Reserve Bank of St. Louis: Manufacturers’ New Orders:  Durable Goods [DGORDER] ; U.S. Department of Commerce: Census Bureau ; accessed June 26, 2013;

_________

I post various indicators and indices because I believe they should be carefully monitored.  However, as those familiar with this blog are aware, I do not necessarily agree with what they depict or imply.
_____

The Special Note summarizes my overall thoughts about our economic situation

SPX at 1599.73 as this post is written

Potential Losses In The Federal Reserve's Portfolio

I have written extensively on the issue of Quantitative Easing (QE) and Interventions as I believe many aspects of these practices lack recognition and understanding.   Quantitative Easing in general carries an array of risks, detrimental impacts, unintended consequences, and complex impacts on the economy and markets.

One such set of dynamics embedded within QE that I believe lacks recognition is the risk of losses that can occur in the Federal Reserve's portfolio.  I previously wrote of this in the post of March 7, 2012 titled "Dynamics And Risks Of The Federal Reserve's Portfolio."

While the subject of potential losses is complex - and quantification of such potential losses is made difficult due to the many factors involved - the sheer size of the numbers involved, as well as various adverse situations that may develop during the course of portfolio losses - make this an issue that deserves recognition.

It should be noted that various parties believe that numerous mitigating factors minimize the importance of the potential for losses from the Fed's portfolio.  For instance,  it appears that many people discount the risk of losses, as well as the potential for the Federal Reserve to exhaust its capital base, as they figure that the U.S. Treasury can always replenish the capital.  As well, there is the issue of "mark to market" losses vs. accounting losses, and how the markets view the difference.  (Note:  as seen in the FRBSF Economic Letter of April 11, 2011:  "...the Fed values its securities at acquisition cost and registers capital gains and losses only when securities are sold. Such historical-cost accounting is considered appropriate for a central bank that is motivated by macroeconomic policy objectives rather than financial profit and is consistent with the buy-and-hold securities strategy the Fed has traditionally followed.")  Other mitigating factors are cited as well, including reasoning cited by the Federal Reserve in the above-mentioned March 7, 2012 blog post.

However, if one believes that there is possible adverse impact(s) stemming from mark-to-market losses in the Federal Reserve's portfolio as well as the exhaustion of the Federal Reserve's capital, a disconcerting picture appears, especially in today's rising interest rate environment.

Subsequent to my March 7, 2012 blog post, there have been some published analyses that attempt to quantify the potential for losses in the Federal Reserve's portfolio.  Two of these include the January 2013 Federal Reserve paper titled "The Federal Reserve's Balance Sheet and Earnings:  A primer and projections," (discussed in the Wall Street Journal article of January 30, 2013 titled "Fed Risks Losses From Bonds") as well as the Bloomberg article of February 26, 2013 titled "Fed Faces Explaining Billion-Dollar Losses in QE Exit Stress."

While this Bloomberg article contains various interesting commentary, the following excerpts are especially notable:
MSCI’s data showed the greatest losses under the adverse scenario, as 10-year Treasury yields jump to 5.4 percent by the end of 2015 and three-month rates rise to 4 percent. The 10-year yield was 1.86 percent yesterday, and the three-month rate was 0.117 percent.
also:
Losses on the Fed’s portfolio rise steadily under the adverse scenario to $547 billion by the fourth quarter of 2015 in the MSCI analysis, which is purely a measure of interest-rate risk in the portfolio starting from bond prices at year end. It does not take account of purchases or sales the Fed may conduct in the future. The calculations are mark-to-market losses on the portfolio that take account of yield, amortization, accretion, and funding costs.
Also of critical importance is how sensitive the Federal Reserve's asset portfolio is to an increase in interest rates before the capital base is exhausted.  Cumberland Advisors publishes a CUMB-E Index (pdf) described as a measure of "Percentage  point parallel shift in yield curve needed to exhaust Federal Reserve capital account."  This CUMB-E Index value as of June 19 stood at .27.  (also of note is Cumberland's "Total Assets Of Major Central Banks" (pdf) which shows the size, trends, and composition of major Central Bank assets.)

In aggregate, my interpretation of this potential for losses in the Federal Reserve's portfolio is that the portfolio is highly susceptible (on an "all things considered" basis) to large (mark-to-market) losses.   While the amount of these losses depends upon many factors, the overall dynamics of interest rates and their potential for quick and substantial increases serves to further magnify the potential for large losses.

In addition to the direct (mark-to-market) losses, there are also an array of direct and indirect adverse impact(s) these losses can have on the Federal Reserve, U.S. financial standing, and financial markets.  While the extent of these various adverse impacts depends upon many factors, these impacts can cause many highly complex financial and policy problems.

For reference, here is a chart of the 10-Year Treasury Note Yield since 1980, depicted on a monthly LOG basis since 1980 through June 25, 2013, with price labels:

(click on chart to enlarge image)(chart courtesy of StockCharts.com; chart creation and annotation by the author)

EconomicGreenfield 6-25-13 TNX Monthly LOG since 1980

_____

The Special Note summarizes my overall thoughts about our economic situation

SPX at 1588.03 as this post is written

Tuesday, June 25, 2013

Trends Of S&P500 Earnings Forecasts

S&P500 earnings trends and estimates are a notably important topic, for a variety of reasons, at this point in time.

FactSet publishes a report titled “Earnings Insight” that contains a variety of information including the trends and expectations of S&P500 earnings.

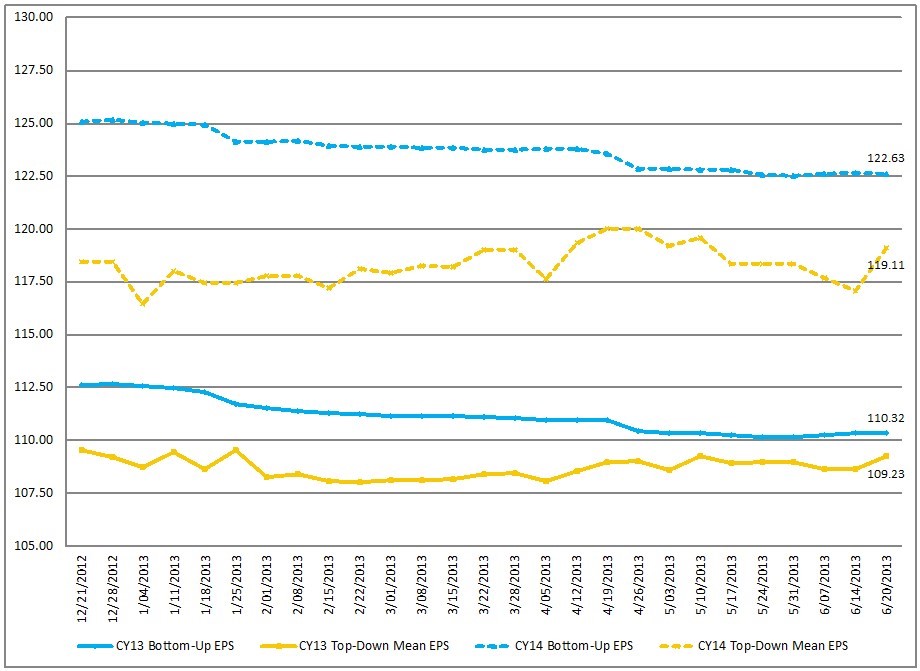
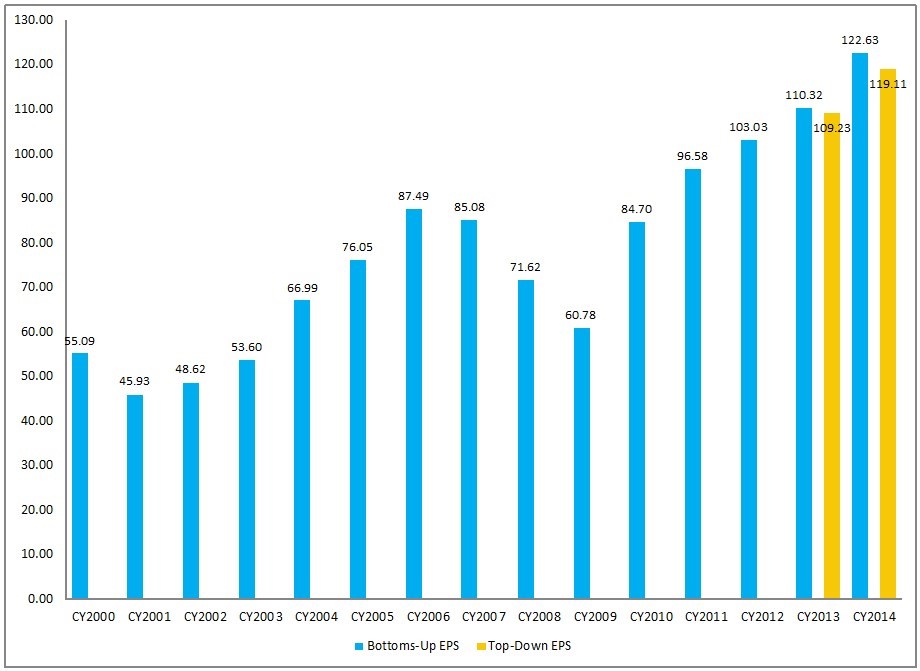
For reference purposes, here are two charts as seen in the “Earnings Insight” (pdf) report of June 21, 2013:

from page 17:

(click on charts to enlarge images)

CY Bottom-Up EPS vs. Top-Down Mean EPS (Trailing 26-Weeks)

EconomicGreenfield 6-25-13 FactSet EPS

-

from page 18:

Calendar Year Bottom-Up EPS Actuals & Estimates
EconomicGreenfield 6-25-13 FactSet 6-21-13 EPS Forecasts CY Actual and Estimates

_____

I post various economic forecasts because I believe they should be carefully monitored.  However, as those familiar with this blog are aware, I do not agree with many of the consensus estimates and much of the commentary in these forecast surveys.
_____

The Special Note summarizes my overall thoughts about our economic situation

SPX at 1586.21 as this post is written

S&P500 Earnings Estimates For Years 2013, 2014, And 2015

As many are aware, Thomson Reuters publishes earnings estimates for the S&P500.  (My other posts concerning S&P earnings estimates can be found under the S&P500 Earnings label)

The following estimates are from Exhibit 12 of “The Director’s Report” of June 24, 2013, and represent an aggregation of individual S&P500 component “bottom up” analyst forecasts:

Year 2013 estimate:
$111.01/share

Year 2014 estimate:
$123.65/share

Year 2015 estimate:
$135.92/share

_____

I post various economic forecasts because I believe they should be carefully monitored.  However, as those familiar with this blog are aware, I do not agree with many of the consensus estimates and much of the commentary in these forecast surveys.
_____

The Special Note summarizes my overall thoughts about our economic situation

SPX at 1573.09 as this post is written

Monday, June 24, 2013

Standard & Poor’s S&P500 Earnings Estimates For 2013 & 2014 – As Of June 21, 2013

As many are aware, Standard & Poor’s publishes earnings estimates for the S&P500.  (My posts concerning their estimates can be found under the S&P500 Earnings label)

For reference purposes, the most current estimates are reflected below, and are as of June 21, 2013:

Year 2013 estimates add to the following:
-From a “bottom up” perspective, operating earnings of $109.55/share
-From a “top down” perspective, operating earnings of $109.16/share
-From a “top down” perspective, “as reported” earnings of $102.80/share

Year 2014 estimates add to the following:
-From a “bottom up” perspective, operating earnings of $123.34/share
-From a “top down” perspective, operating earnings of $119.57/share
-From a “top down” perspective, “as reported” earnings of $116.90/share
_____

I post various economic forecasts because I believe they should be carefully monitored.  However, as those familiar with this blog are aware, I do not agree with many of the consensus estimates and much of the commentary in these forecast surveys.
_____

The Special Note summarizes my overall thoughts about our economic situation

SPX at 1580.63 as this post is written

Updates Of Economic Indicators June 2013

Here is an update on various indicators that are supposed to predict and/or depict economic activity.  These indicators have been discussed in previous blog posts:

The June Chicago Fed National Activity Index (CFNAI)(pdf) updated as of June 24, 2013:

cfnai_monthly_MA3 6-24-13

-


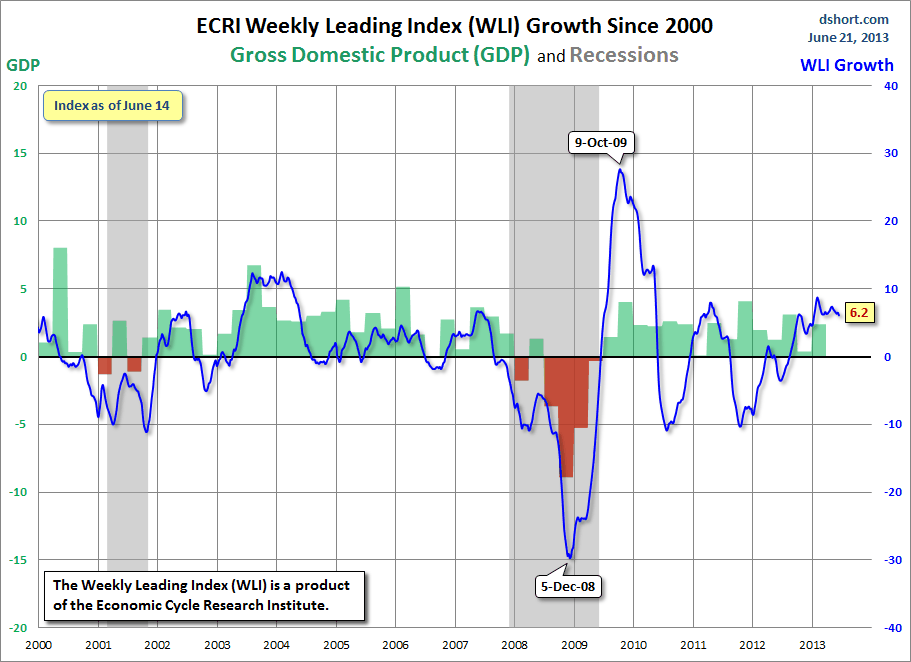
As of 6/21/13 (incorporating data through 6/14/13) the WLI was at 130.3 and the WLI, Gr. was at 6.2%.

A chart of the WLI, Gr. since 2000, from Doug Short’s blog of June 21 titled “ECRI Recession Watch:  Weekly Update” :

Dshort 6-21-13 - ECRI-WLI-growth-since-2000 6.2

-


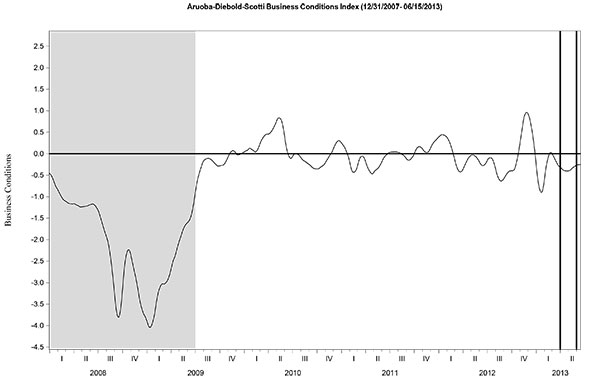
Here is the latest chart, depicting 12-31-07 through 6-15-13:

ads_12-31-07 - 6-15-13

-


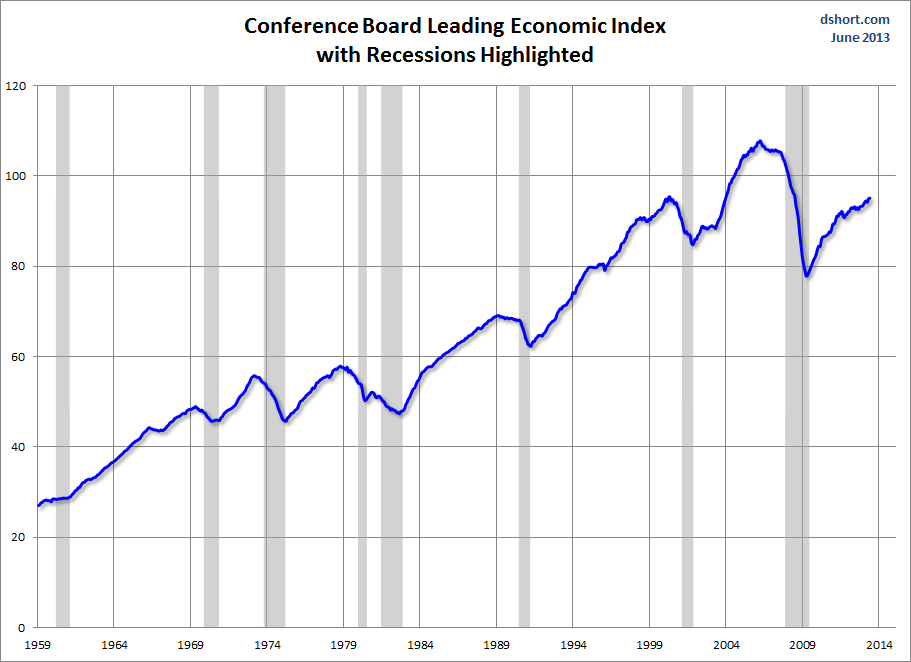
As per the June 20 press release, the LEI was at 95.2 and the CEI was at 105.6 in May.

An excerpt from the June 20 release:
Says Ataman Ozyildirim, economist at The Conference Board: “Despite month-to-month volatility, the LEI’s six-month growth rate remains steady, suggesting that conditions in the economy remain resilient. Widespread gains in the leading indicators over the last six months suggest there is some upside potential for economic activity in the second half of the year.”
Here is a chart of the LEI from Doug Short’s blog post of June 20 titled "Conference Board Leading Economic Index:  A Slight Rise in May" :

Dshort 6-20-13 - CB-LEI

_________

I post various indicators and indices because I believe they should be carefully monitored.  However, as those familiar with this blog are aware, I do not necessarily agree with what they depict or imply.
_____

The Special Note summarizes my overall thoughts about our economic situation

SPX at 1565.30 as this post is written

Current Economic Situation

With regard to our current economic situation,  my thoughts can best be described/summarized by the posts found under the 25 “Building Financial Danger” posts.

My thoughts concerning our ongoing economic situation – with future implications – can be seen on the page titled “A Special Note On Our Economic Situation,” which has been found near the bottom of every blog post since August 15, 2010.
_____

The Special Note summarizes my overall thoughts about our economic situation

SPX at 1592.43 as this post is written

Friday, June 21, 2013

Long-Term Charts Of The ECRI WLI & ECRI WLI, Gr. – June 21, 2013 Update

As I stated in my July 12, 2010 post ("ECRI WLI Growth History"):
For a variety of reasons, I am not as enamored with ECRI’s WLI and WLI Growth measures as many are.
However, I do think the measures are important and deserve close monitoring and scrutiny.
The movement of the ECRI WLI and WLI, Gr. is particularly notable at this time, as ECRI publicly announced on September 30, 2011 that the U.S. was “tipping into recession,” and ECRI has reiterated the view that the U.S. economy is currently in a recession, seen most recently in these five sources :
Other past notable 2012 reaffirmations of the September 30, 2011 recession call by ECRI were seen (in chronological order)  on March 15 (“Why Our Recession Call Stands”) as well as various interviews and statements the week of May 6, including:
Also, subsequent to May 2012:
-

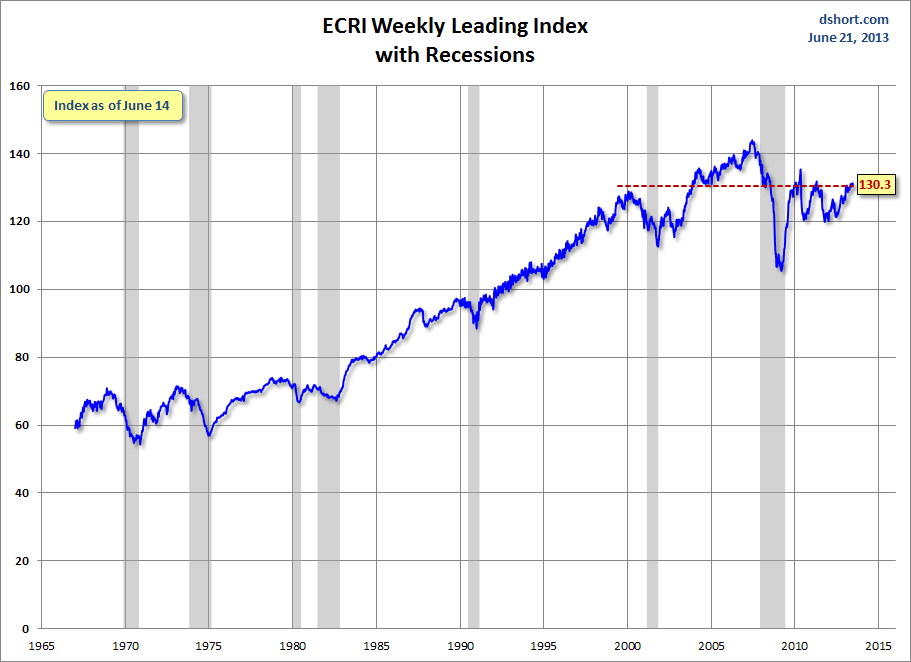
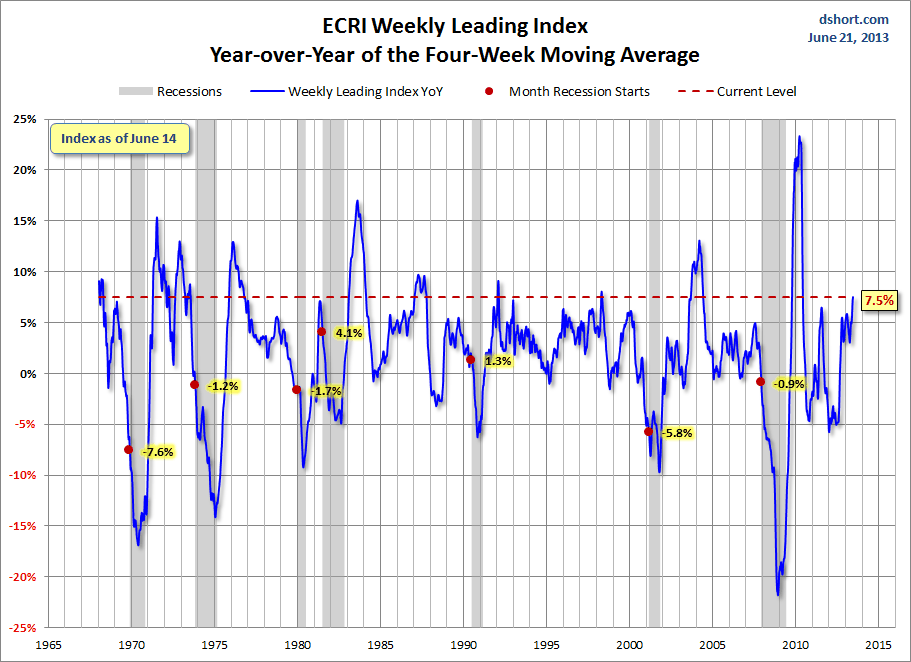
Below are three long-term charts, from Doug Short’s blog post of June 21 titled “ECRI Recession Watch:  Weekly Update”  These charts are on a weekly basis through the June 21 release, indicating data through June 14, 2013.

Here is the ECRI WLI (defined at ECRI’s glossary):

(click on charts to enlarge images)

Dshort 6-21-13 - ECRI-WLI 130.3

-

This next chart depicts, on a long-term basis, the Year-over-Year change in the 4-week moving average of the WLI:
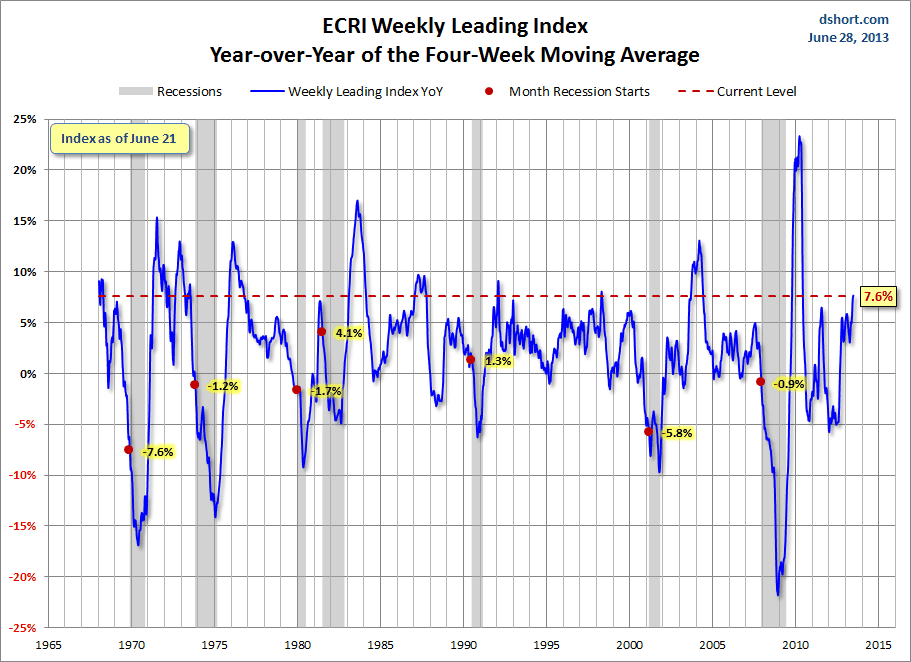
Dshort 6-21-13 - ECRI-WLI-YoY 7.5 percent

-

This last chart depicts, on a long-term basis, the WLI, Gr.:
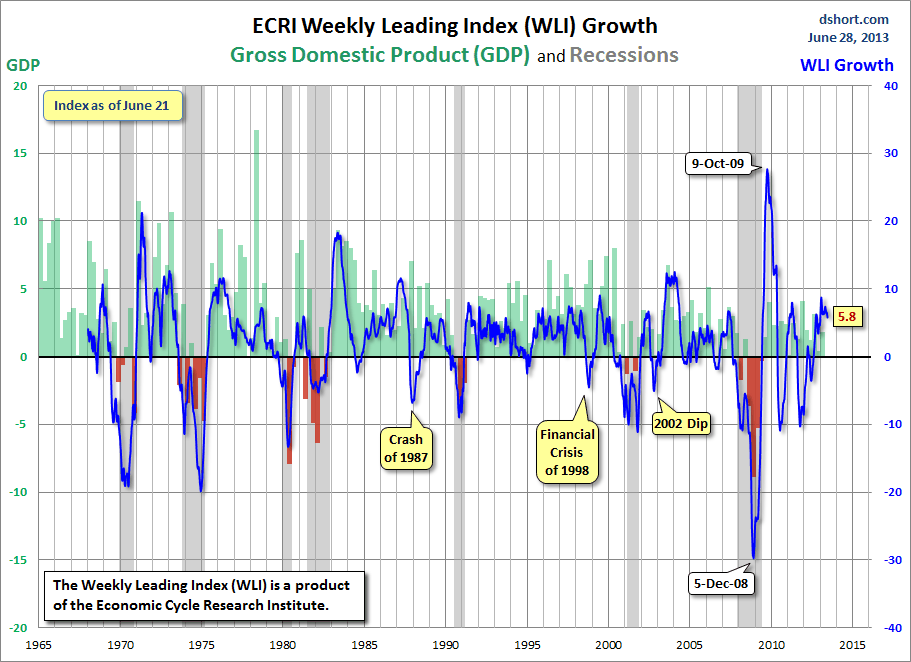
Dshort 6-21-13 - ECRI-WLI-growth-since-1965 6.2

_________

I post various economic indicators and indices because I believe they should be carefully monitored.  However, as those familiar with this blog are aware, I do not necessarily agree with what they depict or imply.
_____

The Special Note summarizes my overall thoughts about our economic situation

SPX at 1596.80 as this post is written