Wednesday, December 31, 2014

Chicago Fed National Financial Conditions Index (NFCI)

The St. Louis Fed’s Financial Stress Index (STLFSI) is one index that is supposed to measure stress in the financial system.  Its reading as of the December 24, 2014 update (reflecting data through December 19) is -.834.
Of course, there are a variety of other measures and indices that are supposed to measure financial stress and other related issues, both from the Federal Reserve as well as from private sources.
Two other indices that I regularly monitor include the Chicago Fed National Financial Conditions Index (NFCI) as well as the Chicago Fed Adjusted National Financial Conditions Index (ANFCI).
Here are summary descriptions of each, as seen in FRED:
The National Financial Conditions Index (NFCI) measures risk, liquidity and leverage in money markets and debt and equity markets as well as in the traditional and “shadow” banking systems. Positive values of the NFCI indicate financial conditions that are tighter than average, while negative values indicate financial conditions that are looser than average.
The adjusted NFCI (ANFCI). This index isolates a component of financial conditions uncorrelated with economic conditions to provide an update on how financial conditions compare with current economic conditions.
For further information, please visit the Federal Reserve Bank of Chicago’s web site:
Below are the most recently updated charts of the NFCI and ANFCI, respectively.
The NFCI chart below was last updated on December 31, incorporating data from January 5,1973 to December 26, 2014, on a weekly basis.  The December 26, 2014 value is -.76:
(click on chart to enlarge image)
NFCI
Data Source: FRED, Federal Reserve Economic Data, Federal Reserve Bank of St. Louis; accessed December 31, 2014:
The ANFCI chart below was last updated on December 31, incorporating data from January 5,1973 to December 26, 2014, on a weekly basis.  The December 26, 2014 value is .09:
ANFCI
Data Source: FRED, Federal Reserve Economic Data, Federal Reserve Bank of St. Louis; accessed December 31, 2014:
_________
I post various indicators and indices because I believe they should be carefully monitored.  However, as those familiar with this blog are aware, I do not necessarily agree with what they depict or imply.
_____
The Special Note summarizes my overall thoughts about our economic situation
SPX at 2075.88 as this post is written

House Prices Reference Chart

As a reference for long-term house price index trends, below is a chart, updated with the most current data (through October) from the CalculatedRisk blog post of December 30, 2014 titled “House Prices: Better Seasonal Adjustment; Real Prices and Price-to-Rent Ratio in October” :
(click on chart to enlarge image)
house price indices October 2014
_____
The Special Note summarizes my overall thoughts about our economic situation
SPX at 2083.46 as this post is written

Tuesday, December 30, 2014

Consumer Confidence Surveys – As Of December 30, 2014

Doug Short had a blog post of December 30, 2014 (“Consumer Confidence 'Rebounded Modestly' In December") in which he presents the latest Conference Board Consumer Confidence and Thomson/Reuters University of Michigan Consumer Sentiment Index charts.  They are presented below:
(click on charts to enlarge images)
Conference Board Consumer Confidence December 2014
Michigan Consumer Sentiment December 2014
There are a few aspects of the above charts that I find highly noteworthy.  Of course, the continuing subdued absolute levels of these two surveys is disconcerting.
Also, I find the “behavior” of these readings to be quite disparate as compared to the other post-recession periods, as shown in the charts between the gray shaded areas (the gray areas denote recessions as defined by the NBER.)
While I don’t believe that confidence surveys should be overemphasized, I find these readings to be very problematical, especially in light of a variety of other highly disconcerting measures highlighted throughout this blog.
_____
The Special Note summarizes my overall thoughts about our economic situation
SPX at 2079.68 as this post is written

Wednesday, December 24, 2014

Chicago Fed National Financial Conditions Index (NFCI)

The St. Louis Fed’s Financial Stress Index (STLFSI) is one index that is supposed to measure stress in the financial system.  Its reading as of the December 24, 2014 update (reflecting data through December 19) is -.834.
Of course, there are a variety of other measures and indices that are supposed to measure financial stress and other related issues, both from the Federal Reserve as well as from private sources.
Two other indices that I regularly monitor include the Chicago Fed National Financial Conditions Index (NFCI) as well as the Chicago Fed Adjusted National Financial Conditions Index (ANFCI).
Here are summary descriptions of each, as seen in FRED:
The National Financial Conditions Index (NFCI) measures risk, liquidity and leverage in money markets and debt and equity markets as well as in the traditional and “shadow” banking systems. Positive values of the NFCI indicate financial conditions that are tighter than average, while negative values indicate financial conditions that are looser than average.
The adjusted NFCI (ANFCI). This index isolates a component of financial conditions uncorrelated with economic conditions to provide an update on how financial conditions compare with current economic conditions.
For further information, please visit the Federal Reserve Bank of Chicago’s web site:
Below are the most recently updated charts of the NFCI and ANFCI, respectively.
The NFCI chart below was last updated on December 24, incorporating data from January 5,1973 to December 19, 2014, on a weekly basis.  The December 19, 2014 value is -.78:
(click on chart to enlarge image)
NFCI
Data Source: FRED, Federal Reserve Economic Data, Federal Reserve Bank of St. Louis; accessed December 24, 2014:
The ANFCI chart below was last updated on December 24, incorporating data from January 5,1973 to December 19, 2014, on a weekly basis.  The December 19, 2014 value is -.26:
ANFCI
Data Source: FRED, Federal Reserve Economic Data, Federal Reserve Bank of St. Louis; accessed December 24, 2014:
_________
I post various indicators and indices because I believe they should be carefully monitored.  However, as those familiar with this blog are aware, I do not necessarily agree with what they depict or imply.
_____
The Special Note summarizes my overall thoughts about our economic situation
SPX at 2081.88 as this post is written

Money Supply Charts Through November 2014

For reference purposes, below are two sets of charts depicting growth in the money supply.
The first shows the MZM (Money Zero Maturity), defined in FRED as the following:
M2 less small-denomination time deposits plus institutional money funds.
Money Zero Maturity is calculated by the Federal Reserve Bank of St. Louis.
Here is the “MZM Money Stock” (seasonally adjusted) chart, updated on December 19, 2014 depicting data through November 2014, with value $12,826.0 Billion:
MZM money supply
Here is the “MZM Money Stock” chart on a “Percent Change From Year Ago” basis:
MZM percent change from year ago
Data Source: FRED, Federal Reserve Economic Data, Federal Reserve Bank of St. Louis; accessed December 24, 2014:
The second set shows M2, defined in FRED as the following:
M2 includes a broader set of financial assets held principally by households. M2 consists of M1 plus: (1) savings deposits (which include money market deposit accounts, or MMDAs); (2) small-denomination time deposits (time deposits in amounts of less than $100,000); and (3) balances in retail money market mutual funds (MMMFs). Seasonally adjusted M2 is computed by summing savings deposits, small-denomination time deposits, and retail MMMFs, each seasonally adjusted separately, and adding this result to seasonally adjusted M1.
Here is the “M2 Money Stock” (seasonally adjusted) chart, updated on December 18, 2014, depicting data through November 2014, with value $11,562.1 Billion:
M2 money supply
Here is the “M2 Money Stock” chart on a “Percent Change From Year Ago” basis:
M2 percent change from year ago
Data Source: FRED, Federal Reserve Economic Data, Federal Reserve Bank of St. Louis; accessed December 24, 2014:
_____
The Special Note summarizes my overall thoughts about our economic situation
SPX at 2082.17 as this post is written

Tuesday, December 23, 2014

Durable Goods New Orders – Long-Term Charts Through November 2014

Many people place emphasis on Durable Goods New Orders as a prominent economic indicator and/or leading economic indicator.
For reference, below are charts depicting this measure.
First, from the St. Louis Fed site (FRED), a chart through November, updated on December 23, 2014.  This value is 242,275 ($ Millions) :
(click on charts to enlarge images)
durable goods new orders
Here is the chart depicting this measure on a “Percentage Change from a Year Ago” basis:
durable goods new orders percent change from year ago
Data Source: FRED, Federal Reserve Economic Data, Federal Reserve Bank of St. Louis: Manufacturers’ New Orders:  Durable Goods [DGORDER]; U.S. Department of Commerce: Census Bureau; accessed December 23, 2014;
_________
I post various indicators and indices because I believe they should be carefully monitored.  However, as those familiar with this blog are aware, I do not necessarily agree with what they depict or imply.
_____
The Special Note summarizes my overall thoughts about our economic situation
SPX at 2085.94 as this post is written

The U.S. Economic Situation – December 23, 2014 Update

Perhaps the main reason that I write of our economic situation is that I continue to believe, based upon various analyses, that our economic situation is in many ways misunderstood.  While no one likes to contemplate a future rife with economic adversity, current and future economic problems must be properly recognized and rectified if high-quality, sustainable long-term economic vitality is to be realized.
There are an array of indications and other “warning signs” – many readily apparent – that current economic activity and financial market performance is accompanied by exceedingly perilous dynamics.
I have written extensively about this peril, including in the following:
Building Financial Danger” (ongoing updates)
My analyses continues to indicate that the growing level of financial danger will lead to the next stock market crash that will also involve (as seen in 2008) various other markets as well.  Key attributes of this next crash is its outsized magnitude (when viewed from an ultra-long term historical perspective) and the resulting economic impact.  This next financial crash is of tremendous concern, as my analyses indicate it will lead to a Super Depression – i.e. an economy characterized by deeply embedded, highly complex, and difficult-to-solve problems.
For long-term reference purposes, here is a chart of the Dow Jones Industrial Average since 1900, depicted on a monthly basis using a LOG scale (updated through December 19, 2014, with a last value of 17804.80):
(click on chart to enlarge image)(chart courtesy of StockCharts.com)
DJIA 1900-present
 
_____
The Special Note summarizes my overall thoughts about our economic situation
SPX at 2078.54 as this post is written

Monday, December 22, 2014

Updates Of Economic Indicators December 2014

Here is an update of various indicators that are supposed to predict and/or depict economic activity. These indicators have been discussed in previous blog posts:
The December 2014 Chicago Fed National Activity Index (CFNAI) updated as of December 22, 2014:
CFNAI MA-3 12-22-14
As of December 19, 2014 (incorporating data through December 12, 2014) the WLI was at 131.1 and the WLI, Gr. was at -3.1%.
A chart of the WLI,Gr., from Doug Short’s post of December 19, 2014, titled “ECRI Recession Watch:  Update“:
ECRI WLI,Gr.
Here is the latest chart, depicting the ADS Index from December 31, 2007 through December 13, 2014:
ADS Index
As per the December 18, 2014 press release, titled “The Conference Board Leading Economic Index (LEI) for the U.S. Increased Again,” the LEI was at 105.5 and the CEI was at 110.7 in November.
An excerpt from the December 18 release:
“Widespread and persistent gains in the LEI point to strong underlying conditions in the U.S. economic expansion,” said Ataman Ozyildirim, Economist at The Conference Board. “The current situation, measured by the coincident economic index, has been improving steadily, with employment and industrial production making the largest contributions in November.”
Here is a chart of the LEI from Doug Short’s blog post of December 18 titled “Conference Board Leading Economic Index Increased Again in November“ :
Conference Board LEI
_________
I post various indicators and indices because I believe they should be carefully monitored.  However, as those familiar with this blog are aware, I do not necessarily agree with what they depict or imply.
_____
The Special Note summarizes my overall thoughts about our economic situation
SPX at 2071.85 as this post is written

Friday, December 19, 2014

Long-Term Charts Of The ECRI WLI & ECRI WLI, Gr. – December 19, 2014 Update

As I stated in my July 12, 2010 post (“ECRI WLI Growth History“):
For a variety of reasons, I am not as enamored with ECRI’s WLI and WLI Growth measures as many are.
However, I do think the measures are important and deserve close monitoring and scrutiny.
Below are three long-term charts, from Doug Short’s blog post of December 19, 2014 titled “ECRI Recession Watch:  Weekly Update.”  These charts are on a weekly basis through the December 19 release, indicating data through December 12, 2014.
Here is the ECRI WLI (defined at ECRI’s glossary):
ECRI WLI,Gr.
This next chart depicts, on a long-term basis, the Year-over-Year change in the 4-week moving average of the WLI:
Dshort 12-19-14 - ECRI-WLI-YoY - .1 percent
This last chart depicts, on a long-term basis, the WLI, Gr.:
ECRI WLI,Gr.
_________
I post various economic indicators and indices because I believe they should be carefully monitored.  However, as those familiar with this blog are aware, I do not necessarily agree with what they depict or imply.
_____
The Special Note summarizes my overall thoughts about our economic situation
SPX at 2070.65 as this post is written

Broad-Based Indicators Of Economic Activity

The Chicago Fed National Activity Index (CFNAI) and the Aruoba-Diebold-Scotti Business Conditions Index (ADS Index) are two broad-based economic indicators that I regularly feature in this site.
The short-term and long-term trends of each continue to be notable.
Doug Short, in his blog post of December 19, 2014, titled “The Philly Fed ADS Business Conditions Index” displays both the CFNAI MA-3 (3-month Moving Average) and ADS Index (91-Day Moving Average) from a variety of perspectives.
Of particular note, two of the charts, shown below, denote where the current levels of each reading is relative to the beginning of past recessionary periods, as depicted by the red dots.
The CFNAI MA-3:
(click on charts to enlarge images)
CFNAI MA-3
The ADS Index, 91-Day MA:
ADS Index
Also shown in the Doug Short’s aforementioned post is a chart of each with a long-term trendline (linear regression) as well as a chart depicting GDP for comparison purposes.
_________
I post various indicators and indices because I believe they should be carefully monitored.  However, as those familiar with this blog are aware, I do not necessarily agree with what they depict or imply.
_____
The Special Note summarizes my overall thoughts about our economic situation
SPX at 2064.72 as this post is written

Thursday, December 18, 2014

Janet Yellen’s December 17, 2014 Press Conference – Notable Aspects

On Wednesday, December 17, 2014 Janet Yellen gave her scheduled December press conference. (video and related materials)
Below are Janet Yellen’s comments I found most notable – although I don’t necessarily agree with them – in the order they appear in the transcript.  These comments are excerpted from the “Transcript of Chairman Yellen’s Press Conference“(preliminary)(pdf) of December 17, 2014, with the accompanying “FOMC Statement” and “Economic Projections of Federal Reserve Board Members and Federal Reserve Bank Presidents, December 2014“ (pdf).
From Janet Yellen’s opening comments:
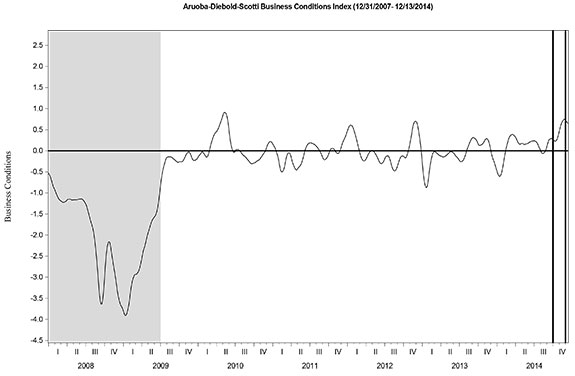
The Committee continues to see sufficient underlying strength in the economy to support ongoing improvement in the labor market.  Real GDP looks to have increased robustly in the third quarter, reflecting solid consumption and investment spending.  Smoothing through the quarterly ups and downs earlier this year, real GDP expanded around 2½ percent over the four quarters ending in the third quarter, and the available indicators suggest that economic growth is running at roughly that pace in the current quarter.  The Committee continues to expect a moderate pace of growth going forward.
Inflation has continued to run below the Committee’s 2 percent objective, and the recent sizable declines in oil prices will likely hold down overall inflation in the near term.  But as the effects of these oil price declines and other transitory factors dissipate, and as resource utilization continues to rise, the Committee expects inflation to move gradually back toward its objective.  In making this forecast, the Committee is mindful of the recent declines in market-based measures of inflation compensation.  At this point, the Committee views these movements as likely to prove transitory, and survey-based measures of longer-term inflation expectations have remained stable.  That said, developments in this area obviously bear close watching.
Janet Yellen’s responses as indicated to the various questions:
STEVE LIESMAN. Was there concern -- Steve Liesman, CNBC -- was there concern expressed at the meeting that the signal coming from markets -- and a variety of markets -- lower oil prices? Lower yields around the world, was one of deflation, and that that risk was one that should perhaps over shadow the concern about inflation on the other side?
CHAIR YELLEN. Well thanks Steve. We're very attentive to global developments. And certainly discuss them in the meeting. The very substantial decline we have seen in oil prices is one of the most important developments shaping the global outlook. It will have different effects in different regions, and could well have effects on financial markets, as we are seeing. I think the judgment of the committee is that from the standpoint of the United States and the U.S. outlook, that the decline we have seen in oil prices is likely to be on net; a positive. It's something that's certainly good for families, for households. It's putting more money in their pockets. Having to spend less on gas and energy, and so in that sense, it's like a tax cut that boosts their spending power. The United States remains -- although our production of oil has increased dramatically -- we still remain a net importer of oil. Of course there may be some offset in the form of reduced drilling activity, and possibly some change, some reduction in CAPEX plans in the drilling area. But on balance, I would see these developments as a positive for the standpoint of the U.S. economy. With respect to deflation, we see downward pressure on headline inflation from declining energy prices. We certainly recognize that that is going to be pushing down headline inflation. And may even spill over to some extent to core inflation. But at this point, although we indicated we're monitoring inflation developments carefully, we see these developments as transitory. And the committee continues to believe -- especially with the improvement we're seeing in the labor market -- which we expect to continue -- that inflation will move back up to our 2 percent objective over time. As I indicated, we will want to feel, I believe, that people will expect to feel reasonably confident about that when they -- when the process of normalization begins. But we do expect them to be transitory.
also:
STEVEN MUFSON. Hi. Steve Mufson from The Washington Post. I was just hoping you could go into a little more detail about the oil effect. Even though you see it as transitory, does that give you a little more room to keep rates low in the next few months? And if -- alternately, if prices bounce back, what's that going to do to your ability to changes rates, and how might you react to that?
CHAIR YELLEN. Well I -- I'd say, you know, that I think what we have seen since the mid-80s is that in an environment where inflation expectations are well-anchored, that movements in oil, and commodity prices, and import prices tend to have transitory effects on the inflation outlook. There were many years in which we had unanticipated increases in oil prices. Really, beginning in 2004 and 2005 that put upward pressure on headline inflation and sometimes even spilled through into core, and typically, the committee looked through those impacts on inflation with the view that they would be transitory. And I think, experience bears out that they were transitory. And I think that's the committee’s expectation here. Inflation, even core inflation, has been running below our inflation objective. Movements in oil, you know, are now down and perhaps later up, will move inflation around, certainly headline inflation. But the committee at this point anticipates those impacts to be transitory. So as long as participants feel reasonably confident that the inflation projection is one where we expect to meet our 2 percent objective over time. That's what I think they'll be looking at things as we decide on the path for the funds rate.
also:
PEDRO DA COSTA. Pedro Da Costa with Dow Jones Newswires. Enough about rates. I want to ask you about the New York Fed. The New York Fed's been in the news a lot lately. President Dudley was invited to Congress to testify about conflicts of interest there. You had things like the Segarra tapes, the Beim report, and most recently the revelation that a former New York Fed official was exchanging information with someone at Goldman Sachs who was also-had New York Fed connections. I just wonder--and also there was scandals during the crisis related to Stephen Freidman regarding the New York Fed, and his purchase of Goldman Sachs stock. Do you see the New York Fed as a black mark on the Fed system because of these recurring scandals? Have you talked to Bill Dudley about reforming the image of that particular regional Fed? And do you think a person that has--that spent 21 years of his career at Goldman Sachs is in a position to regain public credibility about conflicts of interest?
CHAIR YELLEN. Well, let me say that I think it's very important for the Federal Reserve System to have confidence in the quality of its supervision. And I do have--I have a good deal of confidence in the quality of our supervision program, for the banking organizations, we supervise in general, and that also applies to the largest banking organizations. We rely on examiners who are in the field and at the Reserve banks to be providing information about what's happening in those organizations. But that information feeds into a process in which it is not individuals at any single Reserve bank. But at the Board, it's a Board-led process, and it involves senior officials at a number of different Reserve banks. It's also a multi-disciplinary process that involves not only people from supervision, but those from markets, from economic research, experts who focus on financial stability all come together to evaluate the information that they have, and to assign supervisory ratings and decide on the appropriate program for all of those large institutions. We've strengthened the process of supervision enormously since the crisis, and I feel a very good sense of confidence in how we're carrying that out.
Now it is important to make sure that we have fed into the--this process. All the information that's relevant to making the right decisions. And when there are individuals who are examiners, who may disagree with others in their team about how to interpret what's going on at a particular institution, it's important that there be channels by which they can make sure that disagreements are fed up to the highest levels. This is true throughout the work we do. We do economic forecasting, and our--the FOMC receives information to help us make decisions. But obviously there are disagreements about--among economists about how to interpret developments. It's also important for us there to make sure we understand alternative views. So this is important in supervision. We've announced that the Board has undertaken a review of whether or not there are appropriate mechanisms in place in all of the Reserve banks that individuals who disagree with decisions can make those--make their own views known, and feed into the process, and we've also asked our inspector general to look into.
also:
GREG ROBB. There's a contagion risk to the--from low oil prices that people are talking about in the markets. What does it mean to the banks that have lent, you know, into the oil patch with the low oil prices? And I guess, you know, your warnings about leverage loans. You have made warnings over the past year about leveraged lending. Are you worried that they haven't been heeded? Thank you.
CHAIR YELLEN. So I mean there is some--you're talking about in the United States exposure? I mean we have seen some impacts of lower oil prices on the spreads for high-yield bonds, where there's exposure to oil companies that may see distress or a decline in their earnings, and we have seen some increase in spreads on high-yield bonds more generally. I think for the banking system as a whole the exposure to oil, I'm not aware of significant issues there.
This is the kind of thing that is part of risk management for banking organizations and the kind of thing they look at in stress tests. But the movements in oil prices have been very large, and undoubtedly unexpected.
We--in terms of leverage, and whether or not levered entities could be badly effected by movements in oil prices, leverage in the financial system in general is way down from the levels before the crisis. So it's not a major concern that there are levered entities that would be badly affected by this, but we'll have to watch carefully. There have been large and unexpected movements in oil prices.
also:
STEVE BECKNER. Good afternoon, Chair Yellen. Steve Beckner of MNI. I will go back to interest rates if you don't mind. Actually it's a question about balance sheet effects on the overall appropriate level of monetary policy. In reaffirming the reinvestment policy, the FOMC says once again that this will help maintain accommodative financial conditions. In the past it's said that the large portfolio securities will exert a downward effect on long-term interest rates. As you look forward to raising short-term rates, to what extent does the FOMC need to take into account this sort of residual, accommodative effect of maintaining a large balance sheet?
CHAIR YELLEN. So I agree, and that's why we stated it that we typically think of the monetary policy impact of our asset purchases as depending on the stock of assets that we hold on our balance sheet, rather than the flow of purchases, and so we're reminding the public that we continue to hold a large stock of assets, and that is tending to push down term premiums in longer-term yields. We made clear when we--or tried to make clear when we issued our normalization principals in September that we intend to use changes in our target for the federal funds rate as the main tool that we will actively use to adjust financial conditions. Rather than actively planning to sell the assets that we've put onto our balance sheet, some time after we begin raising our targets for short-term interest rates, depending on economic and financial conditions, we're likely to reduce or cease reinvestment and gradually run down the stock of our assets. But our active tool for adjusting monetary--the stance of monetary policy so that it is appropriate for the economic needs for the country, that will be done through adjusting our shortterm target range for the federal funds rate.
also:
KEVIN HALL. Kevin Hall with McClatchy Newspapers. I can't believe no one's asked you the most important question about what's going on with your San Francisco 49ers, since everybody's already wished you a happy holiday.
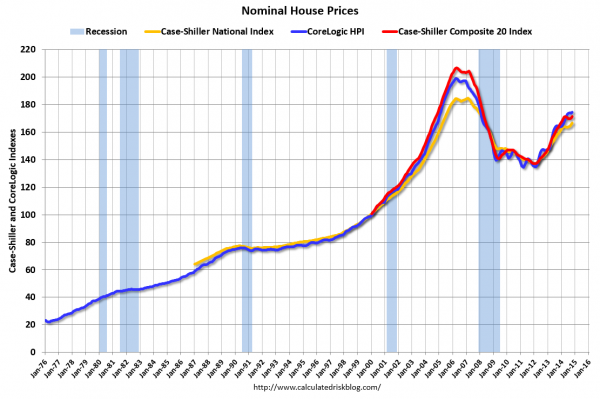
Can you talk a little bit about housing? Few things are more important to Americans in their wealth creation than housing. You've, in your statement, noted that it continues to be a drag. Mr. Dudley has--was actually relatively upbeat in his forecast. I don't know if that's a view shared on the Committee. What do you think is holding housing back? What can Congress do? What will you tell Congress in the coming year? And more--and a clarification on the Dudley question from earlier. You didn't mention him by name in your being pleased by quality of supervision. Are you pleased with Mr. Dudley's handling of the events?
CHAIR YELLEN. So let me start with that. I have great confidence in President Dudley. He's done a fine job in running the New York Fed, and I want to be very clear that I have great confidence in him. He's a distinguished public servant, and he has worked very hard in the aftermath of the crisis to make sure that the New York Fed is doing all that it needs to do to contribute to the work that we do both in the financial stability and in supervision.  And let's see, the other question that you asked about was about--
KEVIN HALL. Housing.
CHAIR YELLEN. --about housing. So, you know, I've been surprised that housing hasn't recovered more robustly than it has. In part I think it reflects very tight credit -- continuing tight credit conditions for any borrower that doesn't have really pristine credit, you know, credit ratings, and my hope is that that situation will ease over time. In addition, household formation has been very depressed, and my expectation is that as the labor market continues to improve and households feel better about their financial condition that we will see household formation pick up and a somewhat stronger recovery than we've seen thus far in housing.
_____
The Special Note summarizes my overall thoughts about our economic situation
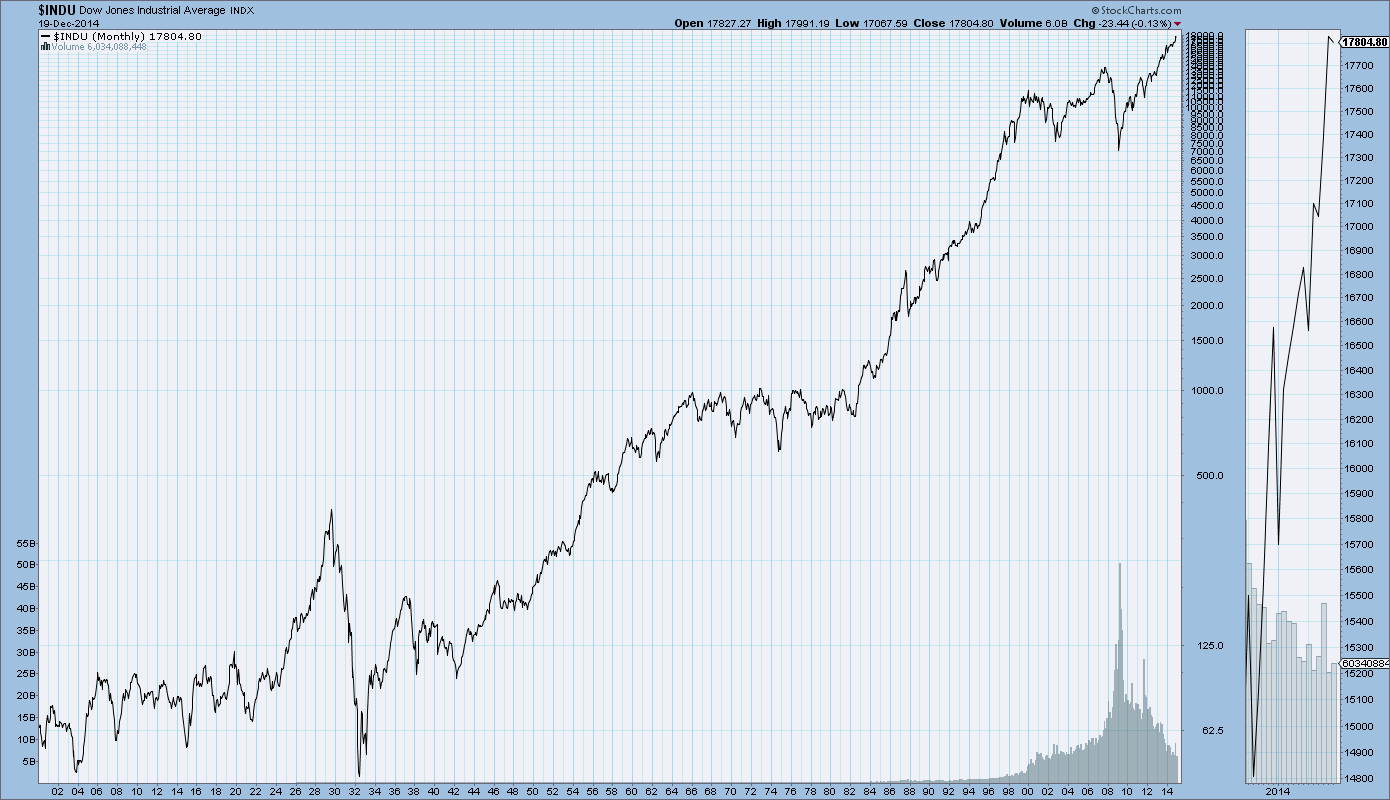
SPX at 2052.47 as this post is written

Trends Of S&P500 Earnings Forecasts

S&P500 earnings trends and estimates are a notably important topic, for a variety of reasons, at this point in time.
FactSet publishes a report titled “Earnings Insight” that contains a variety of information including the trends and expectations of S&P500 earnings.
For reference purposes, here are two charts as seen in the “Earnings Insight” (pdf) report of December 12, 2014:
from page 19:
(click on charts to enlarge images)
S&P500 earnings estimates 2014 & 2015
from page 20:
trends of S&P500 annual earnings
_____
I post various economic forecasts because I believe they should be carefully monitored.  However, as those familiar with this blog are aware, I do not agree with many of the consensus estimates and much of the commentary in these forecast surveys.
_____
The Special Note summarizes my overall thoughts about our economic situation
SPX at 2038.78 as this post is written

S&P500 Earnings Estimates – Years 2014 Through 2016

As many are aware, Thomson Reuters publishes earnings estimates for the S&P500.  (My other posts concerning S&P earnings estimates can be found under the S&P500 Earnings label)
The following estimates are from Exhibit 12 of “The Director’s Report” (pdf) of December 18, 2014, and represent an aggregation of individual S&P500 component “bottom up” analyst forecasts:
Year 2014 estimate:
$117.22/share
Year 2015 estimate:
$127.43/share
Year 2016 estimate:
$142.57/share
_____
I post various economic forecasts because I believe they should be carefully monitored.  However, as those familiar with this blog are aware, I do not agree with many of the consensus estimates and much of the commentary in these forecast surveys.
_____
The Special Note summarizes my overall thoughts about our economic situation
SPX at 2037.01 as this post is written

Standard & Poor’s S&P500 Earnings Estimates For 2014 & 2015 – As Of December 11, 2014

As many are aware, Standard & Poor’s publishes earnings estimates for the S&P500.  (My posts concerning their estimates can be found under the S&P500 Earnings label)
For reference purposes, the most current estimates are reflected below, and are as of December 11, 2014:
Year 2014 estimates add to the following:
-From a “bottom up” perspective, operating earnings of $116.94/share
-From a “top down” perspective, operating earnings of N/A
-From a “top down” perspective, “as reported” earnings of $109.50/share
Year 2015 estimates add to the following:
-From a “bottom up” perspective, operating earnings of $132.55/share
-From a “top down” perspective, operating earnings of $135.84/share
-From a “top down” perspective, “as reported” earnings of $134.90/share
_____
I post various economic forecasts because I believe they should be carefully monitored.  However, as those familiar with this blog are aware, I do not agree with many of the consensus estimates and much of the commentary in these forecast surveys.
_____
The Special Note summarizes my overall thoughts about our economic situation
SPX at 2012.89 as this post is written