Here are three charts from the St. Louis Fed depicting the velocity of money in terms of the MZM, M1 and M2 money supply measures.
All charts reflect quarterly data through the 2nd quarter of 2015, and were last updated as of July 30, 2015. As one can see, two of the three measures are at an all-time low for the periods depicted:
Velocity of MZM Money Stock, current value = 1.346:
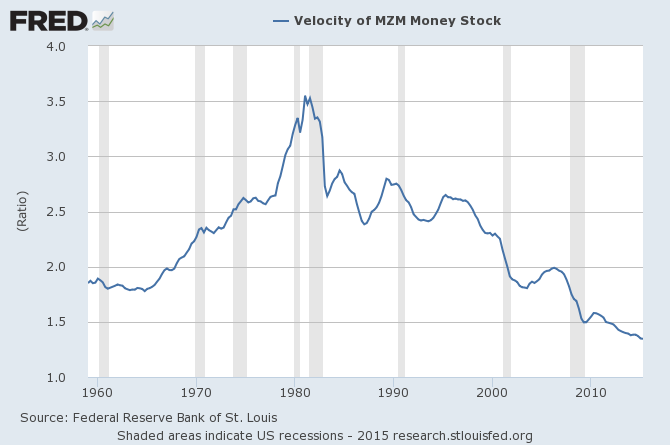
Data Source: FRED, Federal Reserve Economic Data, Federal Reserve Bank of St. Louis; accessed July 30, 2015:
–
Velocity of M1 Money Stock, current value = 5.956:
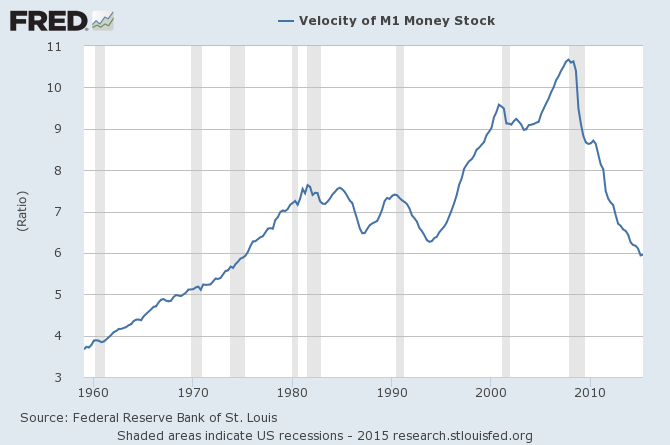
Data Source: FRED, Federal Reserve Economic Data, Federal Reserve Bank of St. Louis; accessed July 30, 2015:
–
Velocity of M2 Money Stock, current value = 1.494:
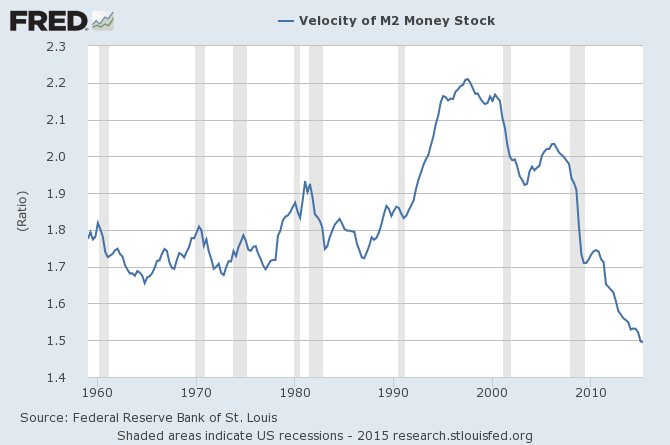
Data Source: FRED, Federal Reserve Economic Data, Federal Reserve Bank of St. Louis; accessed July 30, 2015:
_____
The Special Note summarizes my overall thoughts about our economic situation
SPX at 2108.63 as this post is written
No comments:
Post a Comment