Friday, March 27, 2015

Corporate Profits As A Percentage Of GDP

In the last post (“4th Quarter 2014 Corporate Profits“) I displayed, for reference purposes, a long-term chart depicting Corporate Profits After Tax.
There are many ways to view this measure, both on an absolute as well as relative basis.
One relative measure is viewing Corporate Profits as a Percentage of GDP.  I feel that this metric is important for a variety of reasons.  As well, the measure is important to a variety of parties, including investors, businesses, and government policy makers.
As one can see from the long-term chart below (updated through the fourth quarter), (After Tax) Corporate Profits as a Percentage of GDP is at levels that can be seen as historically (very) high.  While there are many reasons as to why this is so, from a going-forward standpoint I think it is important to recognize both that such a notable condition exists, as well as contemplate and/or plan for such factors and conditions that would come about if (and in my opinion “when”) a more historically “normal” ratio of Corporate Profits as a Percentage of GDP occurs.  This topic can be very complex in nature, and depends upon myriad factors.  In my opinion it deserves far greater recognition.
(click on chart to enlarge image)
corporate profits as a percentage of GDP
Data Source: FRED, Federal Reserve Economic Data, Federal Reserve Bank of St. Louis; accessed March 27, 2015
_____
The Special Note summarizes my overall thoughts about our economic situation
SPX at 2059.69 as this post is written

4th Quarter 2014 Corporate Profits

Today’s GDP release (Q4, 3rd Estimate)(pdf) was accompanied by the BLS Corporate Profits report for the 4th Quarter.
Of course, there are many ways to adjust and depict overall Corporate Profits.  For reference purposes, here is a chart from the St. Louis Federal Reserve (FRED) showing the Corporate Profits After Tax (last updated March 27, 2015, with a value of $1837.5 Billion):
corporate profits after tax
Here is the Corporate Profits After Tax measure shown on a Percentage Change from a Year Ago perspective:
Corporate Profits After Tax
Data Source: FRED, Federal Reserve Economic Data, Federal Reserve Bank of St. Louis: Corporate Profits After Tax [CP]; U.S. Department of Commerce: Bureau of Economic Analysis; accessed March 27, 2015;
https://research.stlouisfed.org/fred2/series/CP
_____
The Special Note summarizes my overall thoughts about our economic situation
SPX at 2057.58 as this post is written

Wednesday, March 25, 2015

Chicago Fed National Financial Conditions Index (NFCI)

The St. Louis Fed’s Financial Stress Index (STLFSI) is one index that is supposed to measure stress in the financial system.  Its reading as of the March 19, 2015 update (reflecting data through March 13) is -1.007.
Of course, there are a variety of other measures and indices that are supposed to measure financial stress and other related issues, both from the Federal Reserve as well as from private sources.
Two other indices that I regularly monitor include the Chicago Fed National Financial Conditions Index (NFCI) as well as the Chicago Fed Adjusted National Financial Conditions Index (ANFCI).
Here are summary descriptions of each, as seen in FRED:
The National Financial Conditions Index (NFCI) measures risk, liquidity and leverage in money markets and debt and equity markets as well as in the traditional and “shadow” banking systems. Positive values of the NFCI indicate financial conditions that are tighter than average, while negative values indicate financial conditions that are looser than average.
The adjusted NFCI (ANFCI). This index isolates a component of financial conditions uncorrelated with economic conditions to provide an update on how financial conditions compare with current economic conditions.
For further information, please visit the Federal Reserve Bank of Chicago’s web site:
Below are the most recently updated charts of the NFCI and ANFCI, respectively.
The NFCI chart below was last updated on March 25, 2015 incorporating data from January 5,1973 to March 20, 2015, on a weekly basis.  The March 20, 2015 value is -.78:
(click on chart to enlarge image)
NFCI 3-25-15
Data Source: FRED, Federal Reserve Economic Data, Federal Reserve Bank of St. Louis; accessed March 25, 2015:
The ANFCI chart below was last updated on March 25, 2015 incorporating data from January 5,1973 to March 20, 2015, on a weekly basis.  The March 20 value is .17:
ANFCI 3-25-15
Data Source: FRED, Federal Reserve Economic Data, Federal Reserve Bank of St. Louis; accessed March 25, 2015:
_________
I post various indicators and indices because I believe they should be carefully monitored.  However, as those familiar with this blog are aware, I do not necessarily agree with what they depict or imply.
_____
The Special Note summarizes my overall thoughts about our economic situation
SPX at 2062.33 as this post is written

Durable Goods New Orders – Long-Term Charts Through February 2015

Many people place emphasis on Durable Goods New Orders as a prominent economic indicator and/or leading economic indicator.
For reference, below are charts depicting this measure.
First, from the St. Louis Fed site (FRED), a chart through February, updated on March 25, 2015. This value is $231,291 ($ Millions):
(click on charts to enlarge images)
durable goods new orders
Here is the chart depicting this measure on a “Percentage Change from a Year Ago” basis:
durable goods new orders percent change from year ago
Data Source: FRED, Federal Reserve Economic Data, Federal Reserve Bank of St. Louis: Manufacturers’ New Orders:  Durable Goods [DGORDER]; U.S. Department of Commerce: Census Bureau; accessed March 25, 2015;
_________
I post various indicators and indices because I believe they should be carefully monitored.  However, as those familiar with this blog are aware, I do not necessarily agree with what they depict or imply.
_____
The Special Note summarizes my overall thoughts about our economic situation
SPX at 2067.37 as this post is written

Tuesday, March 24, 2015

Money Supply Charts Through February 2015

For reference purposes, below are two sets of charts depicting growth in the money supply.
The first shows the MZM (Money Zero Maturity), defined in FRED as the following:
M2 less small-denomination time deposits plus institutional money funds.
Money Zero Maturity is calculated by the Federal Reserve Bank of St. Louis.
Here is the “MZM Money Stock” (seasonally adjusted) chart, updated on March 20, 2015 depicting data through February 2015, with value $13,094.80 Billion:
MZM money stock
Here is the “MZM Money Stock” chart on a “Percent Change From Year Ago” basis:
MZMSL percent change from year ago
Data Source: FRED, Federal Reserve Economic Data, Federal Reserve Bank of St. Louis; accessed March 24, 2015:
The second set shows M2, defined in FRED as the following:
M2 includes a broader set of financial assets held principally by households. M2 consists of M1 plus: (1) savings deposits (which include money market deposit accounts, or MMDAs); (2) small-denomination time deposits (time deposits in amounts of less than $100,000); and (3) balances in retail money market mutual funds (MMMFs). Seasonally adjusted M2 is computed by summing savings deposits, small-denomination time deposits, and retail MMMFs, each seasonally adjusted separately, and adding this result to seasonally adjusted M1.
Here is the “M2 Money Stock” (seasonally adjusted) chart, updated on March 19, 2015, depicting data through February 2015, with value $11,820.30 Billion:
M2SL
Here is the “M2 Money Stock” chart on a “Percent Change From Year Ago” basis:
M2SL percent change from year ago
Data Source: FRED, Federal Reserve Economic Data, Federal Reserve Bank of St. Louis; accessed March 24, 2015:
_____
The Special Note summarizes my overall thoughts about our economic situation
SPX at 2096.43 as this post is written

Monday, March 23, 2015

Broad-Based Indicators Of Economic Activity

The Chicago Fed National Activity Index (CFNAI) and the Aruoba-Diebold-Scotti Business Conditions Index (ADS Index) are two broad-based economic indicators that I regularly feature in this site.
The short-term and long-term trends of each continue to be notable.
Doug Short, in his blog post of March 20, 2015, titled “The Philly Fed ADS Business Conditions Index” displays both the CFNAI MA-3 (3-month Moving Average) and ADS Index (91-Day Moving Average) from a variety of perspectives.
Of particular note, two of the charts, shown below, denote where the current levels of each reading is relative to the beginning of past recessionary periods, as depicted by the red dots.
The CFNAI MA-3:
(click on charts to enlarge images)
CFNAI-MA3
The ADS Index, 91-Day MA:
ADS-index-91-day-MA
Also shown in the Doug Short’s aforementioned post is a chart of each with a long-term trendline (linear regression) as well as a chart depicting GDP for comparison purposes.
_________
I post various indicators and indices because I believe they should be carefully monitored.  However, as those familiar with this blog are aware, I do not necessarily agree with what they depict or imply.
_____
The Special Note summarizes my overall thoughts about our economic situation
SPX at 2112.77 as this post is written

Updates Of Economic Indicators March 2015

Here is an update of various indicators that are supposed to predict and/or depict economic activity. These indicators have been discussed in previous blog posts:
The March 2015 Chicago Fed National Activity Index (CFNAI) updated as of March 23, 2015:
CFNAI-MA3 3-23-15
As of March 20, 2015 (incorporating data through March 13, 2015) the WLI was at 131.1 and the WLI, Gr. was at -3.7%.
A chart of the WLI,Gr., from Doug Short’s post of March 20, 2015, titled “ECRI Recession Watch:  Update“:
ECRI WLI,Gr. since 2000
Here is the latest chart, depicting the ADS Index from December 31, 2007 through March 15, 2015:
ADS Index
As per the March 19, 2015 press release, titled “The Conference Board Leading Economic Index (LEI) for the U.S. Increased Again,” the LEI was at 121.4 and the CEI was at 111.9 in February.
An excerpt from the March 19 release:
“Widespread gains among the leading indicators continue to point to short-term growth,” said Ataman Ozyildirim, Economist at The Conference Board. “However, easing in the LEI’s six-month change suggests that we may be entering a period of more moderate expansion. With the February increase, the LEI remains in growth territory, but weakness in the industrial sector and business investment is holding economic growth back, despite improvements in labor markets and consumer confidence.”
Here is a chart of the LEI from Doug Short’s blog post of March 20 titled “Conference Board Leading Economic Index Remains in Growth Territory“:
Conference Board LEI
 
_________
I post various indicators and indices because I believe they should be carefully monitored.  However, as those familiar with this blog are aware, I do not necessarily agree with what they depict or imply.
_____
The Special Note summarizes my overall thoughts about our economic situation
SPX at 2112.87 as this post is written

The U.S. Economic Situation – March 23, 2015 Update

Perhaps the main reason that I write of our economic situation is that I continue to believe, based upon various analyses, that our economic situation is in many ways misunderstood.  While no one likes to contemplate a future rife with economic adversity, current and future economic problems must be properly recognized and rectified if high-quality, sustainable long-term economic vitality is to be realized.
There are an array of indications and other “warning signs” – many readily apparent – that current economic activity and financial market performance is accompanied by exceedingly perilous dynamics.
I have written extensively about this peril, including in the following:
Building Financial Danger” (ongoing updates)
My analyses continues to indicate that the growing level of financial danger will lead to the next stock market crash that will also involve (as seen in 2008) various other markets as well.  Key attributes of this next crash is its outsized magnitude (when viewed from an ultra-long term historical perspective) and the resulting economic impact.  This next financial crash is of tremendous concern, as my analyses indicate it will lead to a Super Depression – i.e. an economy characterized by deeply embedded, highly complex, and difficult-to-solve problems.
For long-term reference purposes, here is a chart of the Dow Jones Industrial Average since 1900, depicted on a monthly basis using a LOG scale (updated through March 20, 2015, with a last value of 18127.65):
(click on chart to enlarge image)(chart courtesy of StockCharts.com)
DJIA 1900-March 20, 2015
_____
The Special Note summarizes my overall thoughts about our economic situation
SPX at 2112.87 as this post is written

Thursday, March 19, 2015

Janet Yellen’s March 18, 2015 Press Conference – Notable Aspects

On Wednesday, March 18, 2015 Janet Yellen gave her scheduled March 2015 FOMC Press Conference. (link of video and related materials)
Below are Janet Yellen’s comments I found most notable – although I don’t necessarily agree with them – in the order they appear in the transcript.  These comments are excerpted from the “Transcript of Chairman Yellen’s Press Conference“(preliminary)(pdf) of March 18, 2015, with the accompanying “FOMC Statement” and “Economic Projections of Federal Reserve Board Members and Federal Reserve Bank Presidents, March 2015“ (pdf).
From Janet Yellen’s opening comments:
We have seen continued progress toward our objective of maximum employment.  The pace of employment growth has remained strong, with job gains averaging nearly 290,000 per month over the past three months.  The unemployment rate was 5.5 percent in February; that’s three-tenths lower than the latest reading available at the time of our December meeting.  Broader measures of job market conditions—such as those counting individuals who want and are available to work but have not actively searched recently and people who are working part time but would rather work full time—have shown similar improvement.  As we noted in our statement, slack in the labor market continues to diminish.  Meanwhile, the labor force participation rate—the percentage of working-age Americans either working or seeking work—is lower than most estimates of its trend and wage growth remains sluggish, suggesting that some cyclical weakness persists.  So considerable progress clearly has been achieved, but room for further improvement in the labor market continues.
also:
Inflation has declined further below our longer-run objective, largely reflecting the lower energy prices I just mentioned.  Declining import prices have also restrained inflation and, in light of the recent appreciation of the dollar, will likely continue to do so in the months ahead.  My colleagues and I continue to expect that as the effects of these transitory factors dissipate and as the labor market improves further, inflation will move gradually back toward our 2 percent objective over the medium term.  In making this forecast, we are attentive to the low levels of market-based measures of inflation compensation.  In contrast, survey-based measures of longer term inflation expectations have remained stable.  The Committee will continue to monitor inflation developments carefully.
Janet Yellen’s responses as indicated to the various questions:
HOWARD SCHNEIDER. Howard Schneider with the Reuters. Hi. Thank you. So there's been this pretty consistent reference to expectations of above-trend growth over the last few months. Now, we're seeing growth downgraded in the context of very explicit references to international and external conditions, weak export growth, oil dragging down inflation, and your own comments now on the dollar. So my question is, doesn't this indicate that the Fed’s facing a tougher time, you know, kind of going it along to coupling form the rest of the world then perhaps you expected last fall when this first started to be an issue?
CHAIR YELLEN. Well, it looks like from incoming data pertaining to the first quarter that real GDP growth has declined somewhat below where it was for the last several quarters of last year. And that's really why the Committee indicated that growth has moderated somewhat. There has been a slight downgrading of estimates of growth for this year. You mentioned the dollar. We noted that export growth has weakened, probably the strong dollar is one reason for that.
On the other hand, the strength of the dollar also in part reflects the strength of the US economy. The strength of the dollar is also one factor that is--as I noted is holding down import prices and at least on a transitory basis at this point pushing inflation down. So we are taking account of international developments, including prospects for growth in our trade partners in making the forecast we have here.
Nevertheless, it is important to recognize that this is not a weak forecast. Taking everything into account, we continue to project above trend growth. We continue to project improvement in the labor market by the end of 2015. The central tendency of the participants is they are looking for an unemployment rate that will be down to 5.0 to 5.2 which is consistent with their estimates of its longer-run normal value. So, we do see considerable underlying strength in the US economy. And in spite of what looks like a weaker first quarter, we are projecting good performance for the economy.
also:
MARTIN CRUTSINGER. Marty Crutsinger, Associated Press. The policy statement today talks about one of the prerequisites you'll need to start raising rates is to be reasonably confident that inflation--your inflation target--will be met at 2 percent but that is coming out at a time when you have lowered your forecast on inflation. What--which I would think would make you less confident about it. What is it going to take to make you reasonably confident about inflation?
CHAIR YELLEN. So I don't have a mechanical answer for you. There is no single thing where I would say we must see such-and-such in order to achieve that level of confidence. We will be looking at a wide array of data.
Now, we have said that we also want to see continued improvement in the labor market. And a stronger labor market with less labor market slack is one factor that would tend to certainly for me increase my confidence that as slack diminishes, that inflation will move up over time. Other things I will be looking at, of course, the inflation data. But as we said, we expect inflation to remain quite low because of the depressing influence of energy price declines and the dollar. But we will be looking at the inflation data carefully to see if we can interpret for example low levels of inflation if we see that which we expect, as reflecting those influences.
We will be looking at wage growth. We have not seen wage growth pick up. We may not see wage growth pick up. I wouldn't say either that that is a precondition to raising rates. But if we did see wage growth pick up, that would be at least a symptom that inflation would likely move up over time. We'll be watching inflation expectations. Survey measures have been stable. I expect that to continue. But we will be watching it carefully. And market-based measures of inflation compensation have fallen. They are low. If they were to move up over time, that would probably serve to increase my confidence.
But there are a wide range of things that we will be looking at, including further improvement in the labor market. So there's no simple answer. This is a judgment that the Committee will have to make.
also:
PETER BARNES. Peter Barnes, Fox Business. Chair Yellen, I wanted to check in again with you on whether or not you see or have any concerns about bubbles out there in the economy, particularly the financial markets, debt and equity markets and I want to refer to your most recent Monetary Policy Report to Congress last month in which you said overall equity valuations by some conventional measures are somewhat higher than their historical levels, valuation metrics in some sectors continued to appear stretched relative to historical norms. In the same report last year, in July, the reports specifically mentioned biotech and social media stocks as being substantially. Let's see here, substantially stretched. Do you still feel that way and can you comment on bubbles and particularly these sectors?
CHAIR YELLEN. Well, I don't want to comment on those particular sectors. You know, as we said in the report, overall measures of equity valuations are on the high side, but not outside of historical ranges. In some corporate debt markets, we do see evidence of unusually low spreads. And that's what we referred to in the report.
More broadly, we do try to assess potential threats to financial stability. And in addition to looking at asset valuations, we also look at measures of credit growth of the extent of leverage being used in the economy and in the financial sector, and the extent of maturity transformation.
And taking into account a broad range of metrics that bear on financial stability, our overall assessment at this point is the threats are moderate.
also:
JEN LIBERTO. Jen Liberto, Politico. So, I want to switch gears a little bit and ask about some of the tension between the Fed and Congress lately with some lawmakers calling for more transparency and accountability measures. I wanted to ask to what degree that there might be room for the Fed to consider some of these measures, like maybe a rules-based approach, like the
Taylor rule, or some of these measures, that would change up who has a voting seat on the FOMC. To what degree does that make it more difficult to accomplish your mission?
CHAIR YELLEN. So, I believe the Federal Reserve is already one of the most transparent central banks of any around the globe. We provide an immense amount of information both financial about our balance sheet and our monetary policy operations. We have audited financial statements. We published our balance sheet every week. If you want to know exactly what's in the SOMA portfolio, it's listed on the New York Fed Web site on a CUSIP by CUSIP basis. I have press conferences; we issue minutes. We have, you know, statements that we release right after meetings and transcripts within five years. So, if you put all of that together, we are a transparent central bank.
With respect to Congressional changes that are under consideration that would politicize monetary policy by bringing Congress in to make policy judgments about in real-time on our monetary policy decisions. Congress itself decided in 1978 that that was a bad thing to do. That it would lead to poor economic performance. And they carved out this one area of policy reviews of monetary policy decision making from GAO audits. The GAO looks at everything else that goes on within the Fed. And I think that that is a central bank best practice.
The global experience shows that giving central banks independence to make monetary policy decisions that they think are in the best interest of the country and consistent with their mandates leads to lower inflation and more stable macroeconomic outcomes. So, I feel very strongly about that. But we are accountable to Congress. Of course, we are ready to provide information that Congress needs to evaluate the Fed's decision making in monetary policy and elsewhere.
With respect to monetary policy rules, they can be useful and I find them useful and long have as a kind of benchmark for thinking about what might be the appropriate stance of policy. But to chain a central bank to follow a simple mathematical rule that fails to take account of many things that are very important in making monetary policy. For example, I was earlier asked about being against zero lower bound which is an important special consideration, that would be a very foolish thing to do and I oppose it.
With respect to proposals having to do with voting and the structure of the Fed that you mentioned, a lot of ideas have been mentioned. I would say for my part, I think the Federal Reserve works well. The system we have was put into place by Congress decades ago. I don't think it's a system that's broken. Of course, Congress can revisit the decisions it's made about the structure of the Fed. There were good reasons for making the decisions that were about how the structure voting and other things. And I don't think the system is broken. I think it's working well. So I don't see a need for changes. But of course, it's up to Congress to review that.
also:
GREG ROBB. Greg Robb from MarketWatch. We hear that productivity takes a long time before you can understand it, but it’s been very low in this cycle. What that does mean for Fed policy?
CHAIR YELLEN. Well, I agree. It has been very low. It's been disappointingly low. A positive aspect of what is fundamentally a disappointment is that the labor market has improved more rapidly than might have been expected given the pace of economic growth. So the unemployment rate has come down more rapidly than I would have expected, and the labor market has improved more rapidly than I would have expected. We have written down our estimates of potential output. In the long run, it is a disappointing factor about the ultimate prospects for the U.S. economy. If it continues, I would expect it to pick up. And as you can see from the longer-run growth projections, most FOMC participants believe it will pick up above current levels. But it means it's something that would, if it persists, retard living standards and would likely retard real wage growth and improvement in living standards for ordinary households.
 
_____
The Special Note summarizes my overall thoughts about our economic situation
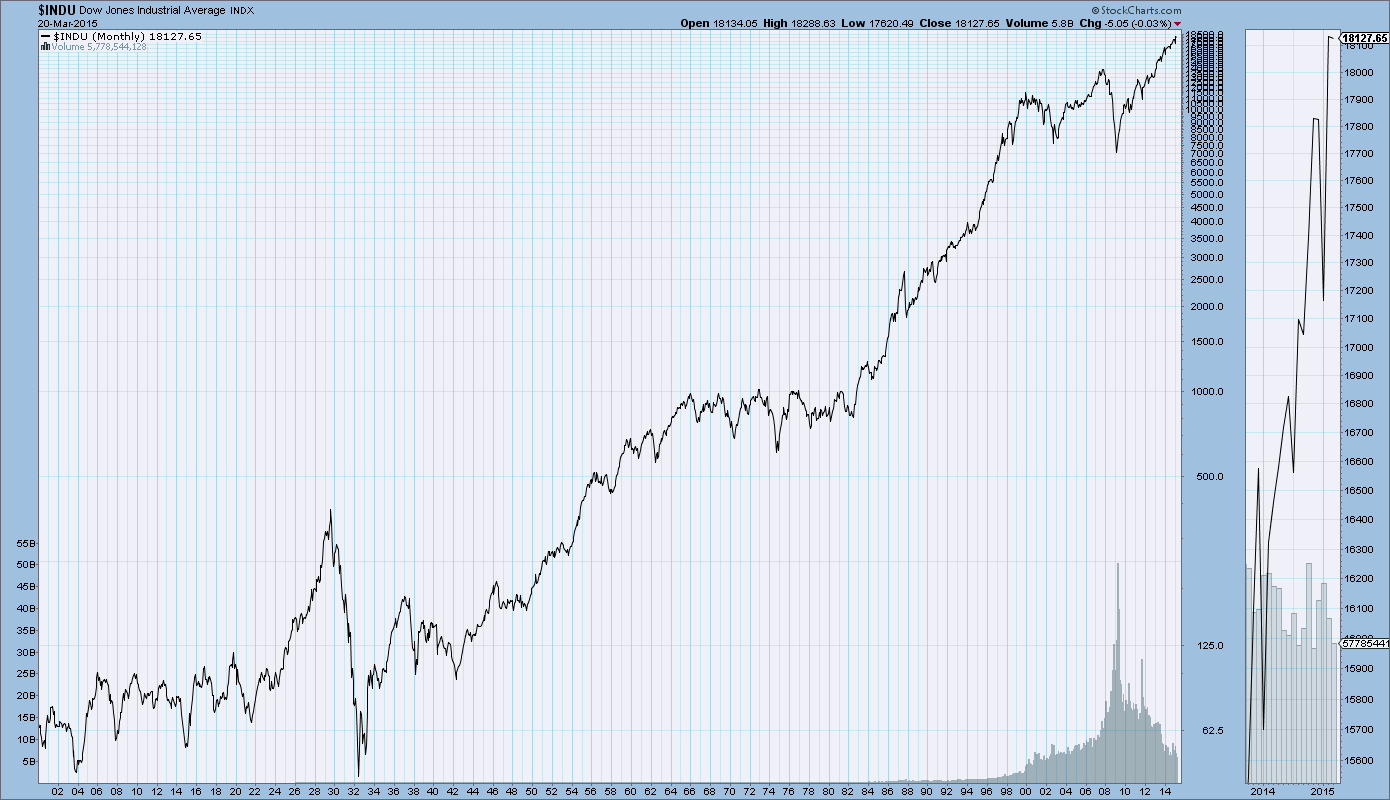
SPX at 2090.19 as this post is written

Stock Market Capitalization To GDP – Through Q4 2014

“Stock market capitalization to GDP” is a notable and important metric regarding stock market valuation.  In February of 2009 I wrote of it in “Does Warren Buffett’s Market Metric Still Apply?
Doug Short has recently published a post depicting this “stock market capitalization to GDP” metric.
As seen in his March 17, 2015 post titled “Market Cap to GDP:  The Buffett Valuation Indicator” he shows two different versions, varying by the definition of stock market capitalization. (note:  additional explanation is provided in his post.)
For reference purposes, here is the first chart, with the stock market capitalization as defined by the Federal Reserve:
(click on charts to enlarge images)
stock market cap to GDP
Here is the second chart, with the stock market capitalization as defined by the Wilshire 5000:
stock market cap to GDP
As one can see in both measures depicted above, “stock market capitalization to GDP” is at notably high levels from a long-term historical perspective.
_____
The Special Note summarizes my overall thoughts about our economic situation
SPX at 2087.71 as this post is written

Trends Of S&P500 Earnings Forecasts

S&P500 earnings trends and estimates are a notably important topic, for a variety of reasons, at this point in time.
FactSet publishes a report titled “Earnings Insight” that contains a variety of information including the trends and expectations of S&P500 earnings.
For reference purposes, here are two charts as seen in the “Earnings Insight” (pdf) report of March 13, 2015:
from page 21:
(click on charts to enlarge images)
2015 and 2016 earnings forecasts
from page 22:
S&P500 earnings 2005-2016
_____
I post various economic forecasts because I believe they should be carefully monitored.  However, as those familiar with this blog are aware, I do not agree with many of the consensus estimates and much of the commentary in these forecast surveys.
_____
The Special Note summarizes my overall thoughts about our economic situation
SPX at 2090.58 as this post is written

S&P500 Earnings – Estimates For Years 2014 Through 2016

As many are aware, Thomson Reuters publishes earnings estimates for the S&P500.  (My other posts concerning S&P earnings estimates can be found under the S&P500 Earnings label)
The following estimates are from Exhibit 12 of “The Director’s Report” (pdf) of March 18, 2015, and represent an aggregation of individual S&P500 component “bottom up” analyst forecasts.  For reference, the Year 2013 value is $109.68/share:
Year 2014 estimate:
$118.77/share
Year 2015 estimate:
$120.32/share
Year 2016 estimate:
$136.17/share
_____
I post various economic forecasts because I believe they should be carefully monitored.  However, as those familiar with this blog are aware, I do not agree with many of the consensus estimates and much of the commentary in these forecast surveys.
_____
The Special Note summarizes my overall thoughts about our economic situation
SPX at 2093.27 as this post is written

Wednesday, March 18, 2015

Standard & Poor’s S&P500 Earnings Estimates For 2015 & 2016 – As Of March 12, 2015

As many are aware, Standard & Poor’s publishes earnings estimates for the S&P500.  (My posts concerning their estimates can be found under the S&P500 Earnings label)
For reference purposes, the most current estimates are reflected below, and are as of March 12, 2015:
Year 2015 estimates add to the following:
-From a “bottom up” perspective, operating earnings of $118.70/share
-From a “top down” perspective, operating earnings of N/A
-From a “bottom up” perspective, “as reported” earnings of $111.33
Year 2016 estimates add to the following:
-From a “bottom up” perspective, operating earnings of $135.72/share
-From a “top down” perspective, operating earnings of N/A
-From a “bottom up” perspective, “as reported” earnings of $123.70/share
_____
I post various economic forecasts because I believe they should be carefully monitored.  However, as those familiar with this blog are aware, I do not agree with many of the consensus estimates and much of the commentary in these forecast surveys.
_____
The Special Note summarizes my overall thoughts about our economic situation
SPX at 2065.01 as this post is written

Chicago Fed National Financial Conditions Index (NFCI)

The St. Louis Fed’s Financial Stress Index (STLFSI) is one index that is supposed to measure stress in the financial system.  Its reading as of the March 12, 2015 update (reflecting data through March 6) is -1.062.
Of course, there are a variety of other measures and indices that are supposed to measure financial stress and other related issues, both from the Federal Reserve as well as from private sources.
Two other indices that I regularly monitor include the Chicago Fed National Financial Conditions Index (NFCI) as well as the Chicago Fed Adjusted National Financial Conditions Index (ANFCI).
Here are summary descriptions of each, as seen in FRED:
The National Financial Conditions Index (NFCI) measures risk, liquidity and leverage in money markets and debt and equity markets as well as in the traditional and “shadow” banking systems. Positive values of the NFCI indicate financial conditions that are tighter than average, while negative values indicate financial conditions that are looser than average.
The adjusted NFCI (ANFCI). This index isolates a component of financial conditions uncorrelated with economic conditions to provide an update on how financial conditions compare with current economic conditions.
For further information, please visit the Federal Reserve Bank of Chicago’s web site:
Below are the most recently updated charts of the NFCI and ANFCI, respectively.
The NFCI chart below was last updated on March 18, 2015 incorporating data from January 5,1973 to March 13, 2015, on a weekly basis.  The March 13, 2015 value is -.75:
(click on chart to enlarge image)
NFCI 3-18-15 -.75
Data Source: FRED, Federal Reserve Economic Data, Federal Reserve Bank of St. Louis; accessed March 18, 2015:
The ANFCI chart below was last updated on March 18, 2015 incorporating data from January 5,1973 to March 13, 2015, on a weekly basis.  The March 13 value is .22:
ANFCI 3-18-15
Data Source: FRED, Federal Reserve Economic Data, Federal Reserve Bank of St. Louis; accessed March 18, 2015:
_________
I post various indicators and indices because I believe they should be carefully monitored.  However, as those familiar with this blog are aware, I do not necessarily agree with what they depict or imply.
_____
The Special Note summarizes my overall thoughts about our economic situation
SPX at 2067.23 as this post is written