Tuesday, June 30, 2015

Consumer Confidence Surveys – As Of June 30, 2015

Doug Short had a blog post of June 30, 2015 (“Another Gain in Consumer Confidence“) in which he presents the latest Conference Board Consumer Confidence and Thomson/Reuters University of Michigan Consumer Sentiment Index charts.  They are presented below:
(click on charts to enlarge images)
Conference Board Consumer Confidence
Michigan Consumer Confidence
There are a few aspects of the above charts that I find highly noteworthy.  Of course, until the recent sudden upswing, the continued subdued absolute levels of these two surveys was disconcerting.
Also, I find the “behavior” of these readings to be quite disparate as compared to the other post-recession periods, as shown in the charts between the gray shaded areas (the gray areas denote recessions as defined by the NBER.)
While I don’t believe that confidence surveys should be overemphasized, I find these readings to be very problematical, especially in light of a variety of other highly disconcerting measures highlighted throughout this site.
_____
The Special Note summarizes my overall thoughts about our economic situation
SPX at 2060.38 as this post is written

Friday, June 26, 2015

Long-Term Charts Of The ECRI WLI & ECRI WLI, Gr. – June 26, 2015 Update

As I stated in my July 12, 2010 post (“ECRI WLI Growth History“):
For a variety of reasons, I am not as enamored with ECRI’s WLI and WLI Growth measures as many are.
However, I do think the measures are important and deserve close monitoring and scrutiny.
Below are three long-term charts, from Doug Short’s blog post of June 26, 2015 titled “ECRI Weekly Leading Index:  Little to No Change.”  These charts are on a weekly basis through the June 26 release, indicating data through June 19, 2015.
Here is the ECRI WLI (defined at ECRI’s glossary):
ECRI WLI
This next chart depicts, on a long-term basis, the Year-over-Year change in the 4-week moving average of the WLI:
Dshort 6-26-15 - ECRI-WLI-YoY -1.1 percent
This last chart depicts, on a long-term basis, the WLI, Gr.:
ECRI WLI,Gr.

_________
I post various economic indicators and indices because I believe they should be carefully monitored.  However, as those familiar with this blog are aware, I do not necessarily agree with what they depict or imply.
_____
The Special Note summarizes my overall thoughts about our economic situation
SPX at 2095.95 as this post is written

Thursday, June 25, 2015

Money Supply Charts Through May 2015

For reference purposes, below are two sets of charts depicting growth in the money supply.
The first shows the MZM (Money Zero Maturity), defined in FRED as the following:
M2 less small-denomination time deposits plus institutional money funds.
Money Zero Maturity is calculated by the Federal Reserve Bank of St. Louis.
Here is the “MZM Money Stock” (seasonally adjusted) chart, updated on June 19, 2015 depicting data through May 2015, with value $13,263.3 Billion:
MZMSL
Here is the “MZM Money Stock” chart on a “Percent Change From Year Ago” basis:
MZMSL percent change from a year ago
Data Source: FRED, Federal Reserve Economic Data, Federal Reserve Bank of St. Louis; accessed June 25, 2015:
The second set shows M2, defined in FRED as the following:
M2 includes a broader set of financial assets held principally by households. M2 consists of M1 plus: (1) savings deposits (which include money market deposit accounts, or MMDAs); (2) small-denomination time deposits (time deposits in amounts of less than $100,000); and (3) balances in retail money market mutual funds (MMMFs). Seasonally adjusted M2 is computed by summing savings deposits, small-denomination time deposits, and retail MMMFs, each seasonally adjusted separately, and adding this result to seasonally adjusted M1.
Here is the “M2 Money Stock” (seasonally adjusted) chart, updated on June 18, 2015, depicting data through May 2015, with value $11,937.70 Billion:
M2SL_6-18-15 11937.7
Here is the “M2 Money Stock” chart on a “Percent Change From Year Ago” basis:
M2SL_6-18-15 11937.7 Percent Change From Year Ago
Data Source: FRED, Federal Reserve Economic Data, Federal Reserve Bank of St. Louis; accessed June 25, 2015:
_____
The Special Note summarizes my overall thoughts about our economic situation
SPX at 2103.83 as this post is written

Wednesday, June 24, 2015

Chicago Fed National Financial Conditions Index (NFCI)

The St. Louis Fed’s Financial Stress Index (STLFSI) is one index that is supposed to measure stress in the financial system.  Its reading as of the June 18, 2015 update (reflecting data through June 12) is -1.009.
Of course, there are a variety of other measures and indices that are supposed to measure financial stress and other related issues, both from the Federal Reserve as well as from private sources.
Two other indices that I regularly monitor include the Chicago Fed National Financial Conditions Index (NFCI) as well as the Chicago Fed Adjusted National Financial Conditions Index (ANFCI).
Here are summary descriptions of each, as seen in FRED:
The National Financial Conditions Index (NFCI) measures risk, liquidity and leverage in money markets and debt and equity markets as well as in the traditional and “shadow” banking systems. Positive values of the NFCI indicate financial conditions that are tighter than average, while negative values indicate financial conditions that are looser than average.
The adjusted NFCI (ANFCI). This index isolates a component of financial conditions uncorrelated with economic conditions to provide an update on how financial conditions compare with current economic conditions.
For further information, please visit the Federal Reserve Bank of Chicago’s web site:
Below are the most recently updated charts of the NFCI and ANFCI, respectively.
The NFCI chart below was last updated on June 24, 2015 incorporating data from January 5,1973 to June 19, 2015, on a weekly basis.  The June 19, 2015 value is -.79:
(click on chart to enlarge image)
NFCI 6-24-15
Data Source: FRED, Federal Reserve Economic Data, Federal Reserve Bank of St. Louis; accessed June 24, 2015:
The ANFCI chart below was last updated on June 24, 2015 incorporating data from January 5,1973 to June 19, 2015, on a weekly basis.  The June 19 value is .59:
ANFCI
Data Source: FRED, Federal Reserve Economic Data, Federal Reserve Bank of St. Louis; accessed June 24, 2015:
_________
I post various indicators and indices because I believe they should be carefully monitored.  However, as those familiar with this blog are aware, I do not necessarily agree with what they depict or imply.
_____
The Special Note summarizes my overall thoughts about our economic situation
SPX at 2111.77 as this post is written

Tuesday, June 23, 2015

Durable Goods New Orders – Long-Term Charts Through May 2015

Many people place emphasis on Durable Goods New Orders as a prominent economic indicator and/or leading economic indicator.
For reference, below are charts depicting this measure.
First, from the St. Louis Fed site (FRED), a chart through May, updated on June 23, 2015. This value is $228,913 ($ Millions):
(click on charts to enlarge images)
Durable Goods New Orders
Here is the chart depicting this measure on a “Percentage Change from a Year Ago” basis:
Durable Goods New Orders Percent Change From Year Ago
Data Source: FRED, Federal Reserve Economic Data, Federal Reserve Bank of St. Louis: Manufacturers’ New Orders:  Durable Goods [DGORDER]; U.S. Department of Commerce: Census Bureau; accessed June 23, 2015;
_________
I post various indicators and indices because I believe they should be carefully monitored.  However, as those familiar with this blog are aware, I do not necessarily agree with what they depict or imply.
_____
The Special Note summarizes my overall thoughts about our economic situation
SPX at 2124.10 as this post is written

The U.S. Economic Situation – June 23, 2015 Update

Perhaps the main reason that I write of our economic situation is that I continue to believe, based upon various analyses, that our economic situation is in many ways misunderstood.  While no one likes to contemplate a future rife with economic adversity, current and future economic problems must be properly recognized and rectified if high-quality, sustainable long-term economic vitality is to be realized.
There are an array of indications and other “warning signs” – many readily apparent – that current economic activity and financial market performance is accompanied by exceedingly perilous dynamics.
I have written extensively about this peril, including in the following:
Building Financial Danger” (ongoing updates)
My analyses continues to indicate that the growing level of financial danger will lead to the next stock market crash that will also involve (as seen in 2008) various other markets as well.  Key attributes of this next crash is its outsized magnitude (when viewed from an ultra-long term historical perspective) and the resulting economic impact.  This next financial crash is of tremendous concern, as my analyses indicate it will lead to a Super Depression – i.e. an economy characterized by deeply embedded, highly complex, and difficult-to-solve problems.
For long-term reference purposes, here is a chart of the Dow Jones Industrial Average since 1900, depicted on a monthly basis using a LOG scale (updated through June 19, 2015, with a last value of 18014.28):
(click on chart to enlarge image)(chart courtesy of StockCharts.com)
DJIA since 1900
_____
The Special Note summarizes my overall thoughts about our economic situation
SPX at 2124.88 as this post is written

Monday, June 22, 2015

Updates Of Economic Indicators June 2015

Here is an update of various indicators that are supposed to predict and/or depict economic activity. These indicators have been discussed in previous blog posts:
The June 2015 Chicago Fed National Activity Index (CFNAI) updated as of June 22, 2015:
CFNAI-MA3
As of June 19, 2015 (incorporating data through June 12, 2015) the WLI was at 134.3 and the WLI, Gr. was at 1.0%.
A chart of the WLI,Gr., from Doug Short’s post of June 19, 2015, titled “ECRI:  'Shifting Patterns in Recessions and Recoveries'":
ECRI WLI,Gr.
Here is the latest chart, depicting the ADS Index from December 31, 2007 through June 13, 2015:
ADS Index
As per the June 18, 2015 press release, titled “The Conference Board Leading Economic Index (LEI) for the U.S. Increased Again,” the LEI was at 123.1 and the CEI was at 112.1 in May.
An excerpt from the June 18 release:
“The U.S. LEI increased sharply again in May, confirming the outlook for more economic expansion in the second half of the year after what looks to be a much weaker first half,” said Ataman Ozyildirim, Director, Business Cycles and Growth Research, at The Conference Board. “While residential construction and consumer expectations support the more positive outlook, industrial production and new orders in manufacturing are painting a somewhat more mixed picture.”
Here is a chart of the LEI from Doug Short’s blog post of June 18 titled “Conference Board Leading Economic Index Increased Again in May“:
Conference Board LEI
_________
I post various indicators and indices because I believe they should be carefully monitored.  However, as those familiar with this blog are aware, I do not necessarily agree with what they depict or imply.
_____
The Special Note summarizes my overall thoughts about our economic situation
SPX at 2128.69 as this post is written

Thursday, June 18, 2015

Janet Yellen’s June 17, 2015 Press Conference – Notable Aspects

On Wednesday, June 17, 2015 Janet Yellen gave her scheduled June 2015 FOMC Press Conference. (link of video and related materials)
Below are Janet Yellen’s comments I found most notable – although I don’t necessarily agree with them – in the order they appear in the transcript.  These comments are excerpted from the “Transcript of Chairman Yellen’s Press Conference“(preliminary)(pdf) of June 17, 2015, with the accompanying “FOMC Statement” and “Economic Projections of Federal Reserve Board Members and Federal Reserve Bank Presidents, June 2015“ (pdf).
From Janet Yellen’s opening comments:
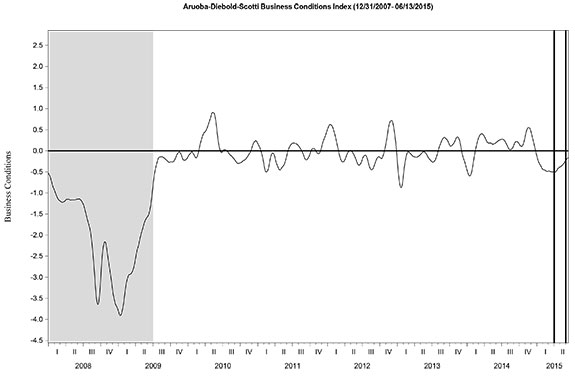
The U.S. economy hit a soft patch earlier this year; real gross domestic product (GDP) looks to have changed little in the first quarter. Growth in household spending slowed, business fixed investment edged down, and net exports were a substantial drag on growth. Part of this weakness was likely the result of transitory factors. Despite the soft first quarter, the fundamentals underlying household spending appear favorable and consumer sentiment remains solid. Looking ahead, the Committee still expects a moderate pace of GDP growth, with continuing job gains and lower energy prices supporting household spending.
Janet Yellen’s responses as indicated to the various questions:
STEVE LIESMAN. Madam Chair, I wonder if you might characterize the progress made towards fulfilling the Fed's two criteria. Are you somewhat more confident, not confident at all that you're moving towards 2%? Has there been a lot of improvement in the labor market, some improvement? And how should we judge when those two criteria have been fulfilled?
CHAIR YELLEN. Well, it's a judgment that the Committee is--will have to make and as I've said previously as we've said in this statement, it will depend on a wide range of data and not on any simple indicators. So I can't provide you--it would be wrong for me to provide you a roadmap that said something as simple as if the unemployment rate declines to X that then the labor market will have improved enough for us to begin to raise policy.
Obviously, we have to look at the pace of job creation. We have to look at what's happening to labor force participation, to part-time employment for economic reasons, to job openings, to the pace of quits, to wage inflation, and other indicators of the state of the labor market. I did say when we agreed that labor market slack has diminished to some extent in the intermitting period. And clearly, over a longer span of time over the last several years, obviously we've made considerable progress in moving toward our goal of maximum employment. So in spite of the fact that there is some progress on that front, the Committee wants to see some further progress before feeling that it will be appropriate to raise rates on inflation.
Again, there has been some progress in the sense energy prices appear to have stabilized. Now, inflation is going to--Overall inflation is likely to run at a low level for a substantial period of time. The big declines in energy prices came toward the end of last year and the beginning of this year and you're not going to wash out of the inflation data until late in this year. But the fact that energy prices have stabilized means that the pressure from that source is diminishing.
In addition, the dollar appears to have largely stabilized and with respect to core inflation, it has been running under our 2% objective but declining import prices have been reducing that pressure. I believe that as the labor market continues to improve and as our confidence in that forecast rises, at least for me my confidence will also rise that inflation will move back up toward 2%. I expect that to over time put up with pressure on core inflation.
also:
BINYAMIN APPELBAUM. Your latest economic projections show that you expect the unemployment rate, or many officials expect, an employment rate to fall more slowly this year, and then to fall, by implication, more quickly next year. Could you talk about what has changed in your assessment of the labor market and how that influences the path of policy?
CHAIR YELLEN. So we are--productivity growth has been--is a factor that affects the pace of improvement in the labor market. Productivity growth has been extremely slow for the last couple of years, and I think in part the pace of improvement in the labor market that we're projecting reflects the notion that there's likely to be some pickup in the pace of productivity growth. Obviously, that's something that's quite uncertain, and it's conceivable that if productivity growth disappoints--something I hope that we won't see because that has very negative implications for living standards--we could conceivably see faster improvement in the labor market.
But in addition, there are other margins of slack that don't show up in the unemployment rate. Labor force participation that has at least is--appears to be depressed at least to some extent because of cyclical weakness, and the fact that labor force participation rate has remained roughly stable for the last year or so when there's an underlying downward trend suggests that some slack is being taken up by, in a sense, improved or diminished cyclical impact on labor force participation. I expect that to continue, and I would expect also to see some improvement in the degree of part-time employment that's for economic reasons.
also:
CHRISTOPHER CONDON. Thank you. Chris Condon from Bloomberg News. Madam Chair, I'd like to come back to the topic of consumer spending. Consumer spending has been very disappointing for many months in the U.S. economy. I'm wondering, do you think there has been a meaningful shift and one that will persist in the behavior of households with respect to spending and savings? Or would you be more inclined to look at the recent more encouraging retail sales figures and see perhaps a return of the American consumer there?
CHAIR YELLEN. So I think in recent weeks we have received data that suggest that can consumer spending is growing at a moderate pace. I'd say, you know, car sales for example were very strong. Part of it probably represents payback for weak sales during the winter months, but nevertheless, the pace of car sales has been strong, and recent readings on retail sales and on spending on services have suggested an improvement in the pace of consumer spending.
There are questions at this point about just how much impact we've seen of lower energy prices on consumer spending. The decline in oil prices translates into an improvement in household income on average of something like $700 per household, and I'm not convinced yet by the data that we have seen the kind of response to that that I would ultimately expect. And I think it's hard to know at this point whether or not that reflects a very cautious consumer that is eager to add to savings and to work down borrowing, or in part some survey evidence suggests the consumers are not yet confident that the improvement they’ve seen a decline in their need to spend for energy for gasoline that that's going to be something that will be permanent. They may think it's a transitory change and not yet be responding. So I think the jury is out there, but I think we have seen some pickup in household spending.
also:
MARK HAMRICK. Madam Chair, Mark Hamrick with Bankrate.com. So much discussion about rising rates seems to focus on the potential negatives, and I'm wondering if you could talk a little bit if you envision some possible unintended benefits of higher rates. And one of the things I'm thinking about is the fact that savers have suffered through so many years of miserly returns, and many may be actually anticipating in a positive way saying a better return on their investment. Thank you.
CHAIR YELLEN. So let me say to my mind the most important positive is that it--I believe a decision to raise rates would signify very clearly that the U.S. economy has made great progress in recovering from the trauma of the financial crisis and that we're in a different place. I think, hopefully, that would be something would be confidence-inducing for many households and businesses.
From the point of view of savers, of course this has been a very difficult period. Many retirees, and I hear from some almost every day, are really suffering from low rates that they had anticipated would bolster their retirement income. This, you know, obviously has been one of the adverse consequences of a period of low rates.
The--you know, we have a good reason for having kept rates at the levels that we have. We--our charge from Congress is to pursue the goals of maximum employment and price stability. That's what we've been doing, and obviously there are benefits from a strong economy to every household in the economy, including savers, from having a better job market and a more secure economy. But, yes, when the time comes for us to raise rates, I think there will be some benefits that flow through to savers.

_____
The Special Note summarizes my overall thoughts about our economic situation
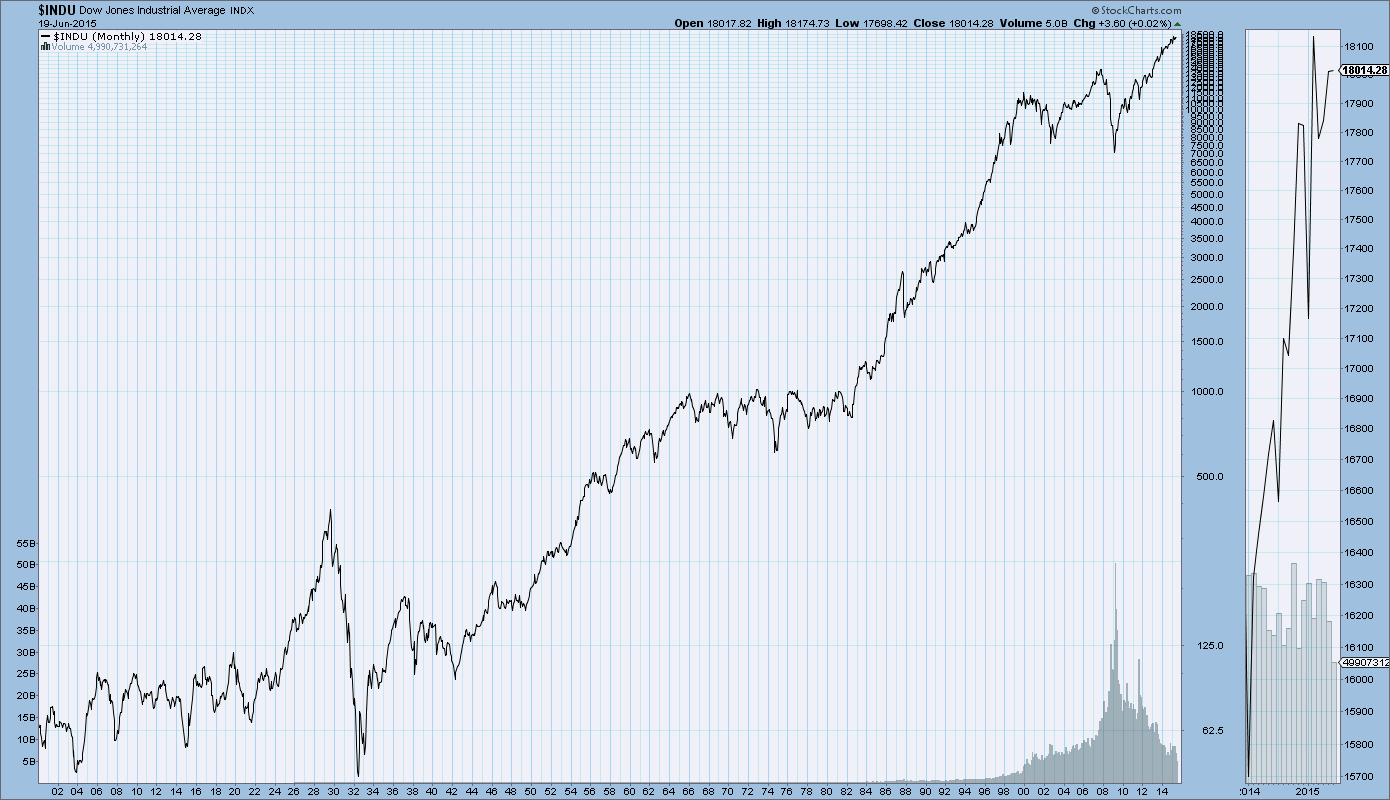
SPX at 2120.80 as this post is written

Trends Of S&P500 Earnings Forecasts

S&P500 earnings trends and estimates are a notably important topic, for a variety of reasons, at this point in time.
FactSet publishes a report titled “Earnings Insight” that contains a variety of information including the trends and expectations of S&P500 earnings.
For reference purposes, here are two charts as seen in the “Earnings Insight” (pdf) report of June 12, 2015:
from page 17:
(click on charts to enlarge images)
S&P500 earnings trends
from page 18:
S&P500 annual EPS

_____
I post various economic forecasts because I believe they should be carefully monitored.  However, as those familiar with this blog are aware, I do not agree with many of the consensus estimates and much of the commentary in these forecast surveys.
_____
The Special Note summarizes my overall thoughts about our economic situation
SPX at 2115.73 as this post is written

Wednesday, June 17, 2015

S&P500 Earnings – EPS Estimates For Years 2015, 2016 And 2017

As many are aware, Thomson Reuters publishes earnings estimates for the S&P500.  (My other posts concerning S&P earnings estimates can be found under the S&P500 Earnings label)
The following estimates are from Exhibit 12 of “The Director’s Report” (pdf) of June 17, 2015, and represent an aggregation of individual S&P500 component “bottom up” analyst forecasts.  For reference, the Year 2014 value is $118.78:
Year 2015 estimate:
$119.23/share
Year 2016 estimate:
$133.95/share
Year 2017 estimate:
$149.49/share
_____
I post various economic forecasts because I believe they should be carefully monitored.  However, as those familiar with this blog are aware, I do not agree with many of the consensus estimates and much of the commentary in these forecast surveys.
_____
The Special Note summarizes my overall thoughts about our economic situation
SPX at 2100.38 as this post is written

Standard & Poor’s S&P500 Earnings Estimates For 2015 & 2016 – As Of June 11, 2015

As many are aware, Standard & Poor’s publishes earnings estimates for the S&P500.  (My posts concerning their estimates can be found under the S&P500 Earnings label)
For reference purposes, the most current estimates are reflected below, and are as of June 11, 2015:
Year 2015 estimates add to the following:
-From a “bottom up” perspective, operating earnings of $115.85/share
-From a “top down” perspective, operating earnings of N/A
-From a “bottom up” perspective, “as reported” earnings of $105.97
Year 2016 estimates add to the following:
-From a “bottom up” perspective, operating earnings of $133.09/share
-From a “top down” perspective, operating earnings of N/A
-From a “bottom up” perspective, “as reported” earnings of $124.11/share
_____
I post various economic forecasts because I believe they should be carefully monitored.  However, as those familiar with this blog are aware, I do not agree with many of the consensus estimates and much of the commentary in these forecast surveys.
_____
The Special Note summarizes my overall thoughts about our economic situation
SPX at 2090.74 as this post is written

Chicago Fed National Financial Conditions Index (NFCI)

The St. Louis Fed’s Financial Stress Index (STLFSI) is one index that is supposed to measure stress in the financial system.  Its reading as of the June 11, 2015 update (reflecting data through June 5) is -1.031.
Of course, there are a variety of other measures and indices that are supposed to measure financial stress and other related issues, both from the Federal Reserve as well as from private sources.
Two other indices that I regularly monitor include the Chicago Fed National Financial Conditions Index (NFCI) as well as the Chicago Fed Adjusted National Financial Conditions Index (ANFCI).
Here are summary descriptions of each, as seen in FRED:
The National Financial Conditions Index (NFCI) measures risk, liquidity and leverage in money markets and debt and equity markets as well as in the traditional and “shadow” banking systems. Positive values of the NFCI indicate financial conditions that are tighter than average, while negative values indicate financial conditions that are looser than average.
The adjusted NFCI (ANFCI). This index isolates a component of financial conditions uncorrelated with economic conditions to provide an update on how financial conditions compare with current economic conditions.
For further information, please visit the Federal Reserve Bank of Chicago’s web site:
Below are the most recently updated charts of the NFCI and ANFCI, respectively.
The NFCI chart below was last updated on June 17, 2015 incorporating data from January 5,1973 to June 12, 2015, on a weekly basis.  The June 12, 2015 value is -.79:
(click on chart to enlarge image)
NFCI_6-17-15 -.79
Data Source: FRED, Federal Reserve Economic Data, Federal Reserve Bank of St. Louis; accessed June 17, 2015:
The ANFCI chart below was last updated on June 17, 2015 incorporating data from January 5,1973 to June 12, 2015, on a weekly basis.  The June 12 value is .65:
ANFCI_6-17-15 .65
Data Source: FRED, Federal Reserve Economic Data, Federal Reserve Bank of St. Louis; accessed June 17, 2015:
_________
I post various indicators and indices because I believe they should be carefully monitored.  However, as those familiar with this blog are aware, I do not necessarily agree with what they depict or imply.
_____
The Special Note summarizes my overall thoughts about our economic situation
SPX at 2090.63 as this post is written

Friday, June 12, 2015

Long-Term Charts Of The ECRI WLI & ECRI WLI, Gr. – June 12, 2015 Update

As I stated in my July 12, 2010 post (“ECRI WLI Growth History“):
For a variety of reasons, I am not as enamored with ECRI’s WLI and WLI Growth measures as many are.
However, I do think the measures are important and deserve close monitoring and scrutiny.
Below are three long-term charts, from Doug Short’s blog post of June 12, 2015 titled “ECRI:  'Trend Real GDP Growth Is Converging to 1 Percent a Year.”  These charts are on a weekly basis through the June 12 release, indicating data through June 5, 2015.
Here is the ECRI WLI (defined at ECRI’s glossary):
ECRI WLI
This next chart depicts, on a long-term basis, the Year-over-Year change in the 4-week moving average of the WLI:
Dshort 6-12-15 - ECRI-WLI-YoY -1.0 percent
This last chart depicts, on a long-term basis, the WLI, Gr.:
ECRI WLI,Gr.
_________
I post various economic indicators and indices because I believe they should be carefully monitored.  However, as those familiar with this blog are aware, I do not necessarily agree with what they depict or imply.
_____
The Special Note summarizes my overall thoughts about our economic situation
SPX at 2092.85 as this post is written

The June 2015 Wall Street Journal Economic Forecast Survey

The June Wall Street Journal Economic Forecast Survey was published on June 11, 2015.  The headline is “Economists See Bright Consumer Outlook.”
I found numerous items to be notable – although I don’t necessarily agree with them – both within the article and in the “Economist Q&A” section.
Two excerpts:
But the forecasters think a high level of spending will be sustained this year because labor markets are strengthening. According to the average forecast, payrolls should increase at a monthly pace of 221,000 for the rest of the year, a notch above the 217,000 averaged in the first five months. The jobless rate is projected to fall to 5.1% by December from 5.5% in May.
also:
A return of the consumer would power overall economic output. On average, the forecasters think inflation-adjusted gross domestic product is expanding at a 2.6% annual rate in the second quarter and then will grow just over 3% in the second half. The economy contracted 0.7% in the first quarter according to the most recent estimate, a drop that reflected shipping problems related to the West coast port slowdown and harsh weather.
As seen in the “Recession Probability” section, the average response as to the odds of another recession starting within the next 12 months was 10.33%; the average response in May was 11.62%.
The current average forecasts among economists polled include the following:
GDP:
full-year 2015:  2.1%
full-year 2016:  2.7%
full-year 2017:  2.6%
Unemployment Rate:
December 2015: 5.1%
December 2016: 4.8%
December 2017: 4.8%
10-Year Treasury Yield:
December 2015: 2.63%
December 2016: 3.34%
December 2017: 3.76%
CPI:
December 2015:  1.2%
December 2016:  2.3%
December 2017:  2.4%
Crude Oil  ($ per bbl):
for 12/31/2015: $61.77
for 12/31/2016: $69.07
(note: I highlight this WSJ Economic Forecast survey each month; commentary on past surveys can be found under the “Economic Forecasts” label)
_____
I post various economic forecasts because I believe they should be carefully monitored.  However, as those familiar with this blog are aware, I do not necessarily agree with many of the consensus estimates and much of the commentary in these forecast surveys.
_____
The Special Note summarizes my overall thoughts about our economic situation
SPX at 2092.14 as post is written