I view Walmart’s results and comments as particularly noteworthy given their retail prominence and focus on low prices. I have previously commented on their quarterly management call comments; these previous posts are found under the “
paycheck to paycheck” label.
Here are various excerpts that I find most notable:
comments from Doug McMillon, President and CEO, page 7:
In the second quarter, Walmart generated more than $120 billion in revenue and delivered earnings per share of $1.08. I’m encouraged by the improvement in our constant currency sales and recognize that our bottom line results should have been better. We had margin pressure from pharmacy reimbursements and higher shrink than we expected during the quarter. These impacts, coupled with higher wage investments, impacted EPS.
comments from Greg Foran, president and CEO of Walmart U.S., page 13:
Second, we’re investing in our associates. This April, we raised the minimum starting wage in our stores to $9.00 per hour, resulting in over 500,000 associates receiving a raise. This new wage structure is expanding our applicant pool. We are also introducing 8,000 new department manager positions, a more focused role that allows the associate to be trained and become more knowledgeable with the areas they support, providing our customers with a better experience in the store. Additionally, we are continuing to focus on career development for all of our associates. Finally, we’ve increased the amount an associate will receive upon being promoted into higher levels of responsibility. These changes gave pay raises to an additional 150,000 associates who are critical to improving the in-store experience.
comments from Greg Foran, president and CEO of Walmart U.S., page 17:
Moving on to the remainder of our financials…gross profit rate declined 41 basis points this quarter. As I said before, this was driven by a handful of key issues. Let’s talk about pharmacy. Reflecting industrywide trends, we are seeing reduced reimbursement rates from Pharmacy Benefit Managers, which is negatively impacting gross margin.
We are also seeing a lower mix of higher-margin cash transactions, reflecting a marketplace shift in which more customers are now benefiting from greater drug insurance coverage. While we are taking a number of actions to lessen the impact, we expect to have pressure on pharmacy for the rest of the fiscal year. Additionally, inventory shrinkage was meaningfully higher than plan for the quarter. We are reviewing the end-to-end inventory management process with a special focus on shrinkage and working to close gaps. Investments are being made in training programs for store and asset protection associates as well as investments in staffing in high shrink areas of the store. But it will take time to see results, so this will impact us versus plan for the rest of the year.
_____
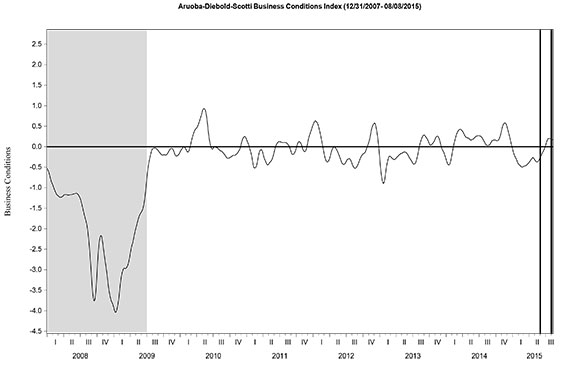
The Special Note summarizes my overall thoughts about our economic situation
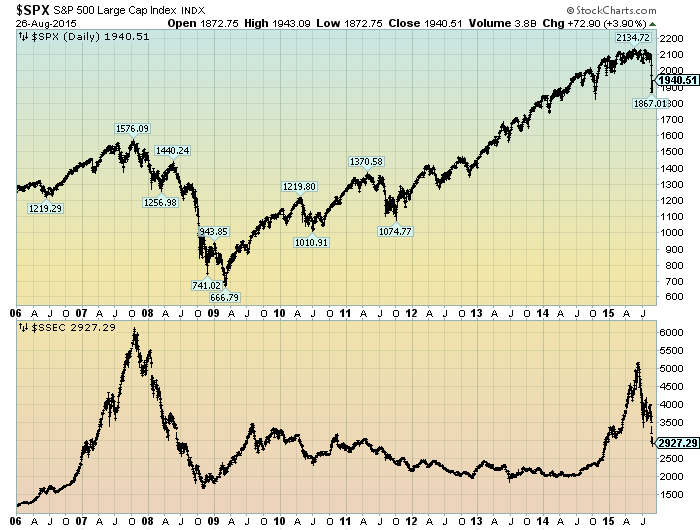
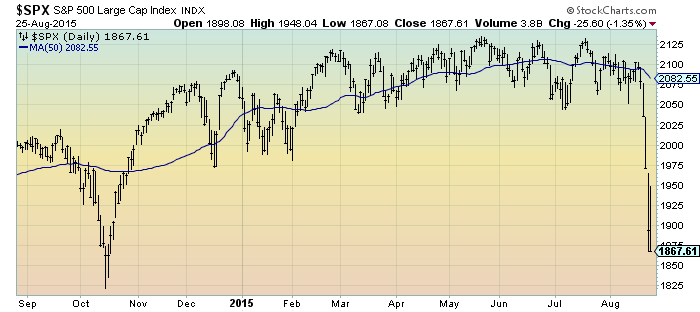
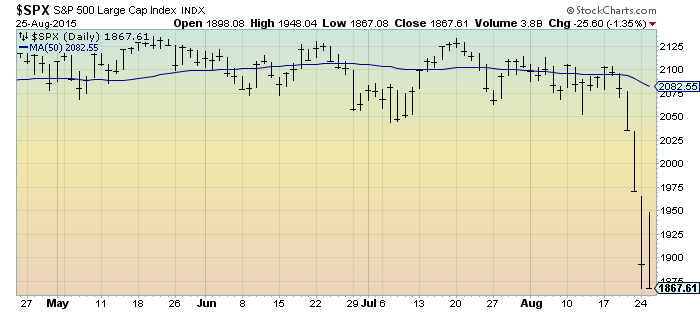
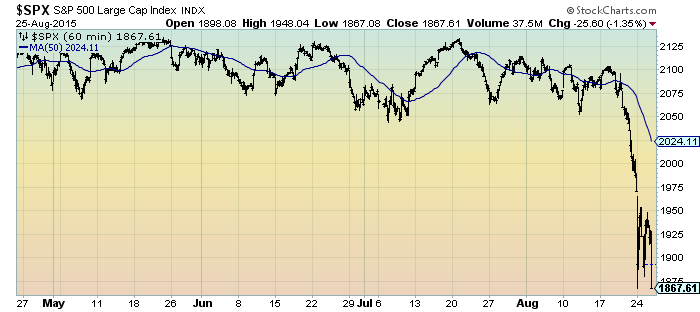
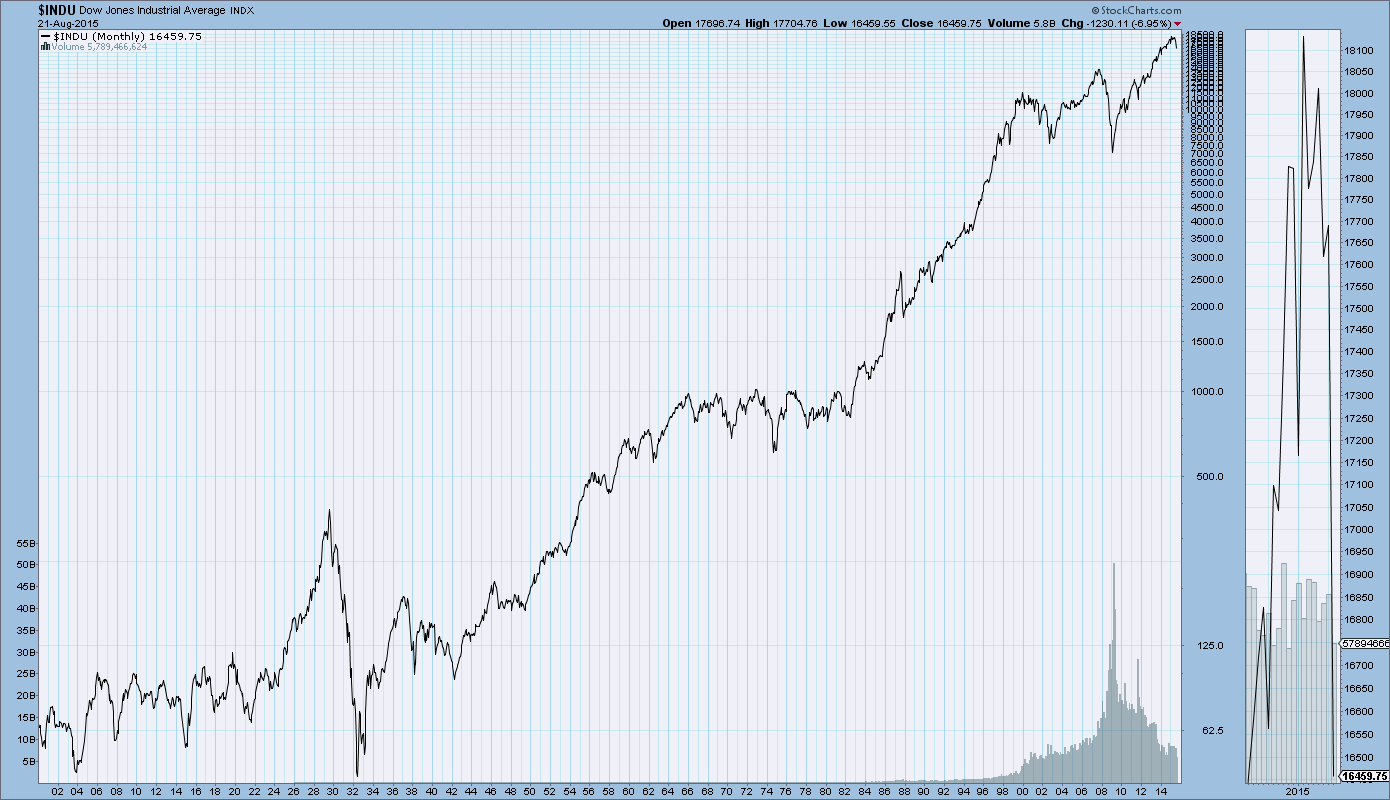
SPX at 2101.39 as this post is written