Friday, February 28, 2014

Long-Term Charts Of The ECRI WLI & ECRI WLI, Gr. – February 28, 2014 Update

As I stated in my July 12, 2010 post (“ECRI WLI Growth History“):
For a variety of reasons, I am not as enamored with ECRI’s WLI and WLI Growth measures as many are.
However, I do think the measures are important and deserve close monitoring and scrutiny.
The movement of the ECRI WLI and WLI, Gr. is particularly notable at this time, as ECRI publicly announced on September 30, 2011 that the U.S. was “tipping into recession,” and ECRI has reiterated the view that the U.S. economy is currently in a recession, seen most recently in these twelve sources :
Other past notable year 2012 reaffirmations of the September 30, 2011 recession call by ECRI were seen (in chronological order) on March 15 (“Why Our Recession Call Stands”) as well as various interviews and statements the week of May 6, including:
Also, subsequent to May 2012:
__
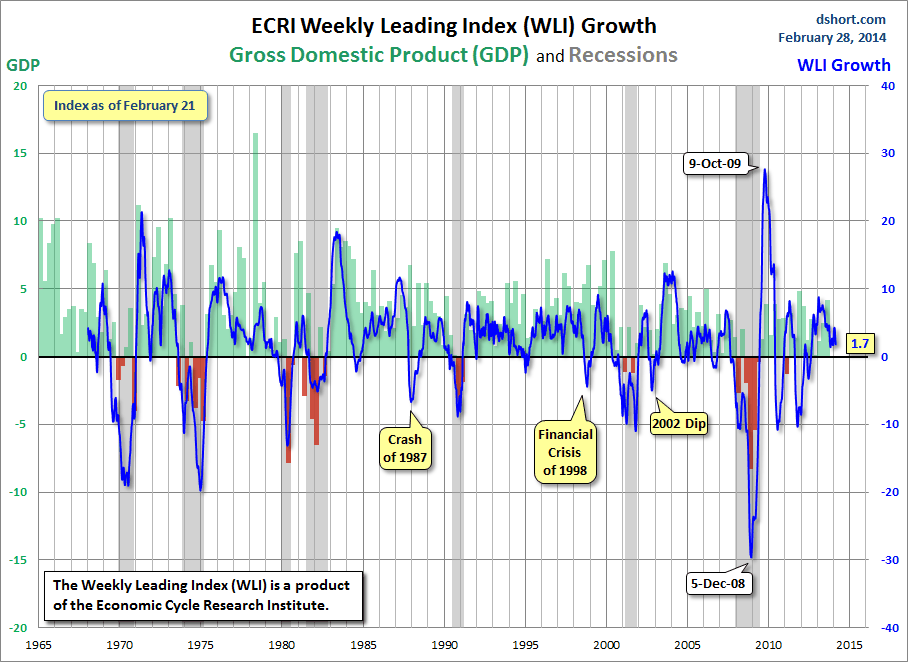
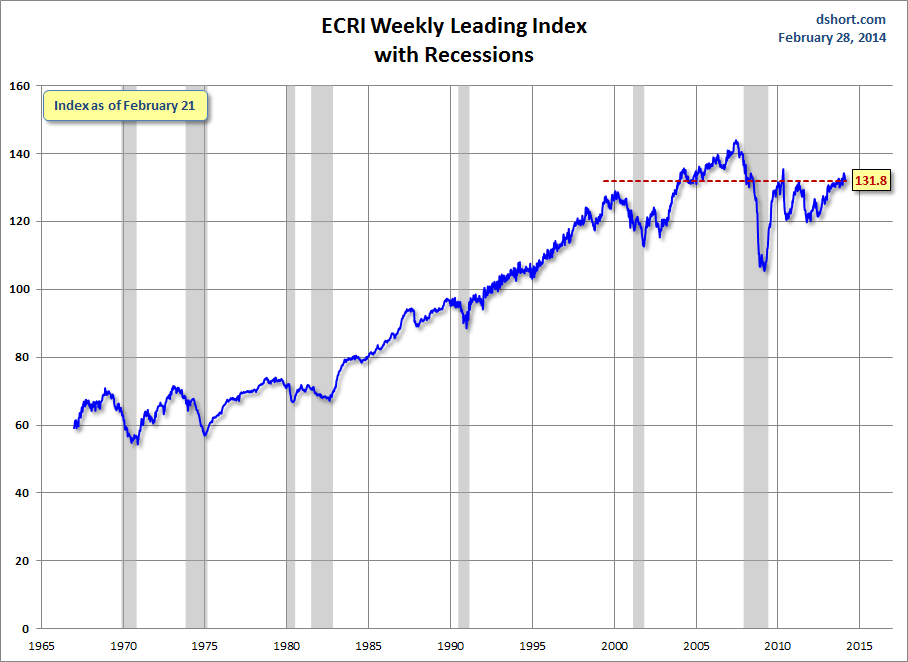
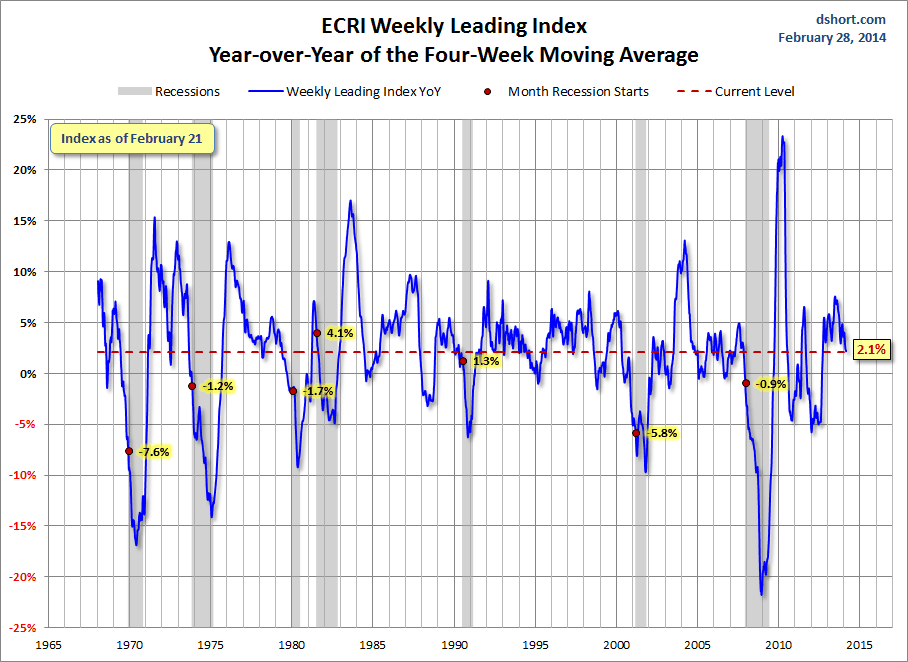
Below are three long-term charts, from Doug Short’s blog post of February 28, 2014 titled “ECRI Recession Watch:  Weekly Update.”  These charts are on a weekly basis through the February 28 release, indicating data through February 21, 2014.
Here is the ECRI WLI (defined at ECRI’s glossary):
ECRI WLI
-
This next chart depicts, on a long-term basis, the Year-over-Year change in the 4-week moving average of the WLI:
Dshort 2-28-14 - ECRI-WLI-YoY 2.1 percent
-
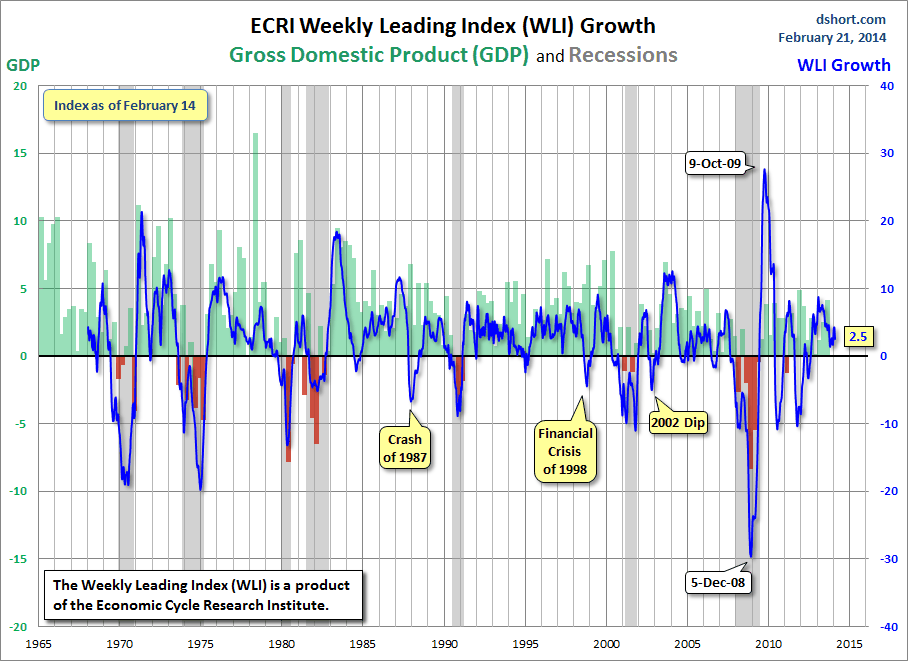
This last chart depicts, on a long-term basis, the WLI, Gr.:
ECRI WLI,Gr.

_________
I post various economic indicators and indices because I believe they should be carefully monitored.  However, as those familiar with this blog are aware, I do not necessarily agree with what they depict or imply.
_____
The Special Note summarizes my overall thoughts about our economic situation
SPX at 1856.78 as this post is written
Consumer Confidence Surveys – As Of February 28, 2014

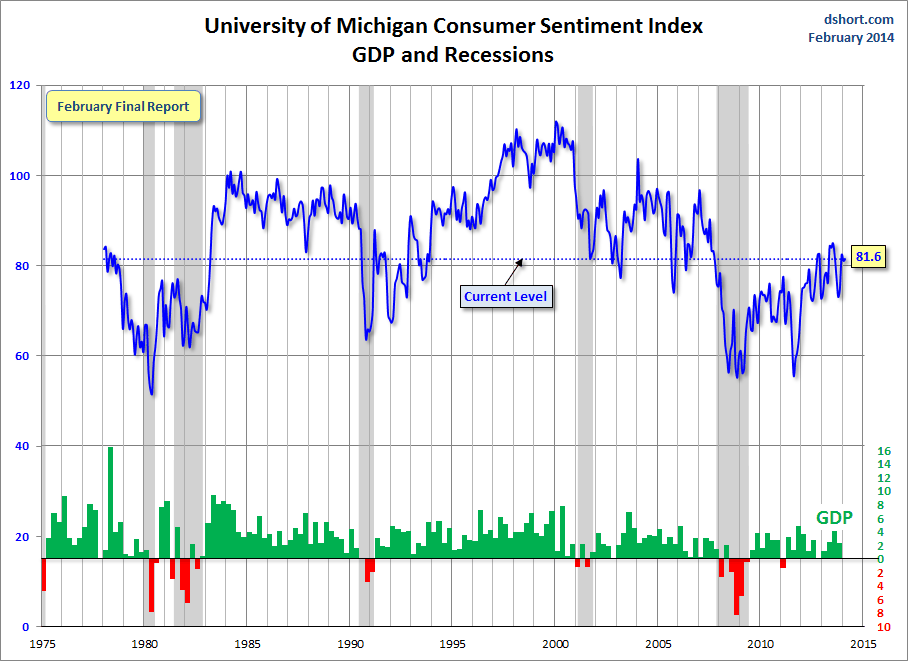
Doug Short had a blog post of February 28, 2014 (“Michigan Consumer Sentiment:  A Modest Increase Despite Bad Weather“) in which he presents the latest Conference Board Consumer Confidence and Thomson/Reuters University of Michigan Consumer Sentiment Index charts.  They are presented below:
(click on charts to enlarge images)
Conference Board Consumer Confidence
-
Michigan Consumer Sentiment
-
There are a few aspects of the above charts that I find highly noteworthy.  Of course, the continuing subdued absolute levels of these two surveys is disconcerting.
Also, I find the “behavior” of these readings to be quite disparate as compared to the other post-recession periods, as shown in the charts between the gray shaded areas (the gray areas denote recessions as defined by the NBER.)
While I don’t believe that confidence surveys should be overemphasized, I find these readings to be very problematical, especially in light of a variety of other highly disconcerting measures highlighted throughout this blog.
_____
The Special Note summarizes my overall thoughts about our economic situation
SPX at 1866.76 as this post is written
Thursday, February 27, 2014

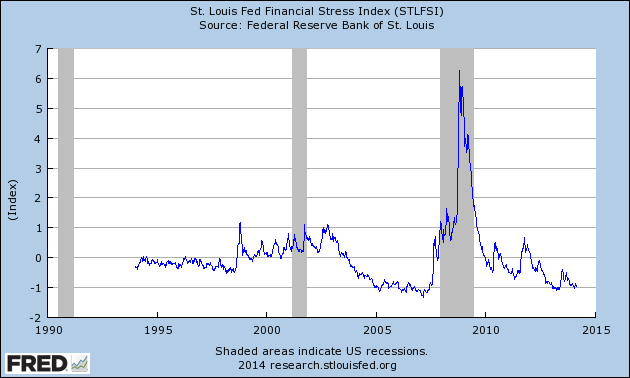
St. Louis Financial Stress Index – February 27, 2014 Update

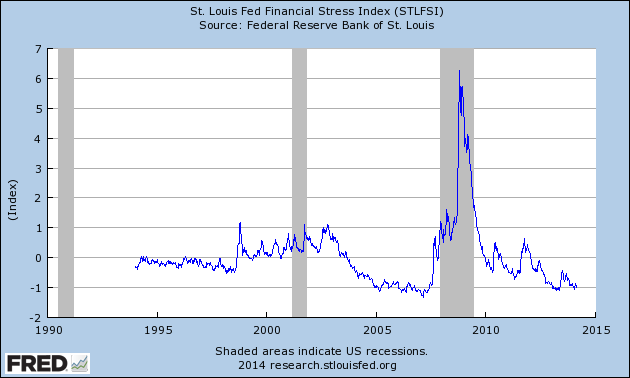
On March 28, 2011 I wrote a post (“The STLFSI“) about the St. Louis Fed’s Financial Stress Index (STLFSI) which is supposed to measure stress in the financial system.  For reference purposes, the most recent chart is seen below.  This chart was last updated on February 27, incorporating data from December 31,1993 to February 21, 2014, on a weekly basis.  The February 21, 2014 value is -.981:
(click on chart to enlarge image)
STLFSI
-
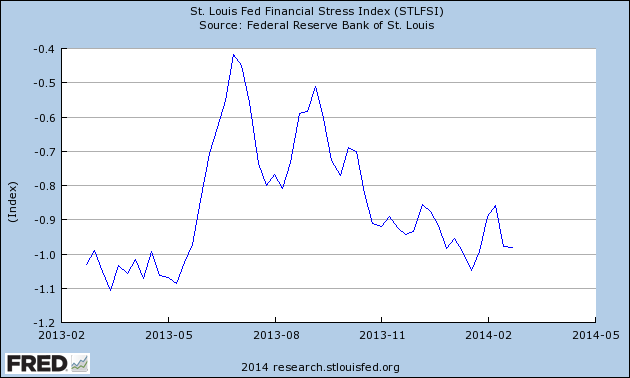
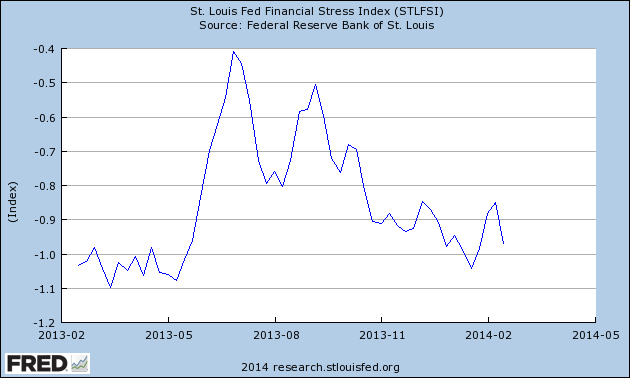
Here is the STLFSI chart from a 1-year perspective:
STLFSI 1-year chart
Data Source: FRED, Federal Reserve Economic Data, Federal Reserve Bank of St. Louis; accessed February 27, 2014:
_________
I post various indicators and indices because I believe they should be carefully monitored.  However, as those familiar with this blog are aware, I do not necessarily agree with what they depict or imply.
_____
The Special Note summarizes my overall thoughts about our economic situation
SPX at 1846.84 as this post is written
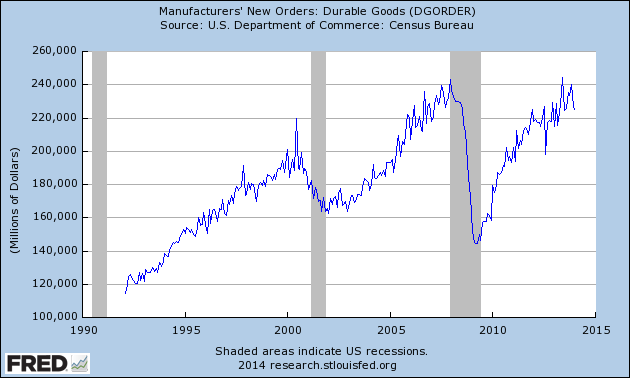
Durable Goods New Orders – Long-Term Charts Through January 2014

Many people place emphasis on Durable Goods New Orders as a prominent economic indicator and/or leading economic indicator.
For reference, below are charts depicting this measure.
First, from the St. Louis Fed site (FRED), a chart through January, last updated on February 27, 2014.  This value is 224,975 ($ Millions) :
(click on charts to enlarge images)
Durable Goods New Orders
-
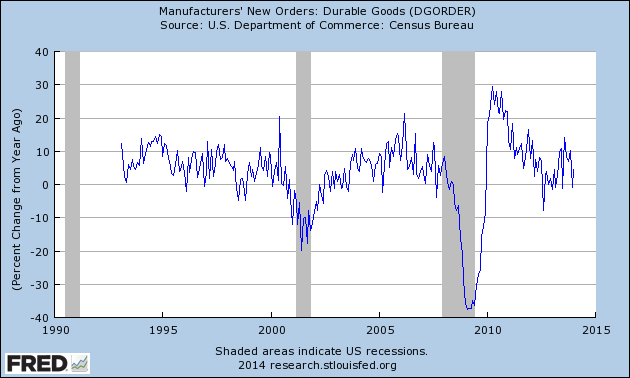
Here is the chart depicting this measure on a “Percentage Change from a Year Ago” basis:
Durable Goods New Orders percent change from year ago
Data Source: FRED, Federal Reserve Economic Data, Federal Reserve Bank of St. Louis: Manufacturers’ New Orders:  Durable Goods [DGORDER] ; U.S. Department of Commerce: Census Bureau ; accessed February 27, 2014;
_________
I post various indicators and indices because I believe they should be carefully monitored.  However, as those familiar with this blog are aware, I do not necessarily agree with what they depict or imply.
_____
The Special Note summarizes my overall thoughts about our economic situation
SPX at 1845.43 as this post is written
Monday, February 24, 2014

Economic Expansion, Recession Or Depression?

On April 29, 2011, I wrote a post titled "Recovery, Recession, Or Depression?" in which I highlighted the issue of whether the U.S. economy was then in an economic recovery, economic recession, or economic depression.
Now, almost three years since that post, and nearly five years since the end of June 2009 NBER Business Cycle Dating Committee's (BCDC) "end of the recession,"  the issue of what part of the business cycle the U.S. economy is in still seems debatable.
While many will find the defining and classification of the business cycle to be semantics – figuring that economic activity “is what it is” - I believe that for many reasons the correct determination of where we are in the business cycle has important implications in understanding future economic activity.
Of course, many economic indicators - perhaps most notably real GDP growth - continues to show "economic expansion." As well, many other economic indicators, including those that (purportedly) most influence the NBER BCDC's official classification of the business cycle, support the current "economic expansion" classification.  Some indicators, including aggregate corporate profits are at all-time record highs and have performed strongly.  And, of course, various U.S. and international stock markets are very close to record highs, after having performed strongly in 2013.
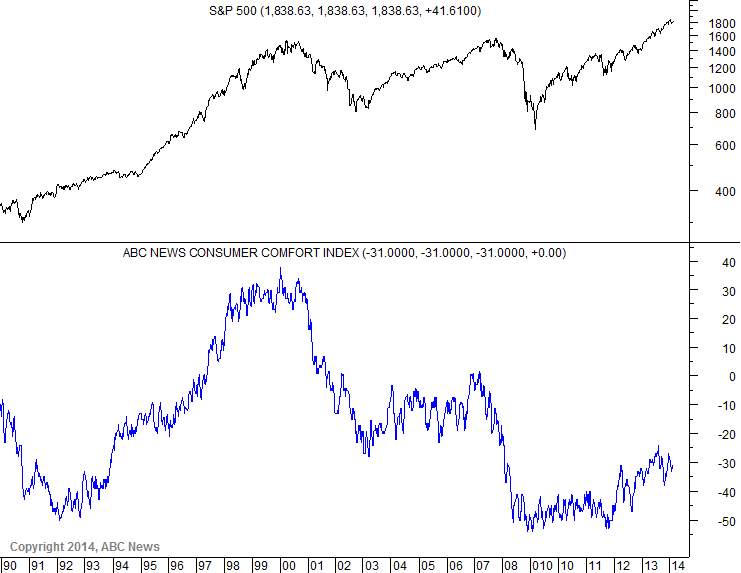
However, against this backdrop of indicators that (strongly) support the U.S. "economic expansion" classification are many other indicators that indicate (very) problematical economic conditions.  The list is long.  One area that is notable is that of consumer confidence and consumer sentiment, which continue to show subdued levels relative to that of past periods of economic expansions.  I find the long-term chart depicting the Bloomberg Consumer Comfort Index to be particularly interesting.  Here is a recent chart (updated through February 21, 2014) from the SentimenTrader site, showing the Index (which was formerly called the "ABC News Consumer Comfort Index") compared against the S&P500:
ABC News Consumer Comfort Index
-
Also supporting these various subdued consumer confidence readings are various surveys that continually indicate that respondents don't seem to believe that the U.S. economy is in an expansion.  One of these was the Marist Poll results of February 5, in which 61% of respondents believe that the U.S. economy is in a recession.
Interestingly, despite the various economic indicators, surveys, and other factors that support a "recession" classification, very few prominent economic forecasters or economic models indicate such a "recession" classification.  In fact, not only do these various economic forecasters and models affirm that the U.S. economy is not in a recession, but they also indicate that the probability of the U.S. economy entering a recession in the near-term is low, if not very much so.  One notable exception is ECRI, which has repeatedly reaffirmed that the U.S. continues to be in a recession.
As to whether the U.S. economy is in an economic depression is a complex topic.  One of the issues, as I explain in the "Defining An Economic Depression" post, is that the NBER BCDC does not define an economic depression, nor does it use the term as a classification.
While I am not aware of any prominent parties who believe that the U.S. is currently experiencing an economic depression, if one believes that the U.S. is not experiencing an economic expansion, the question as to whether we are experiencing an economic depression should (at least) be contemplated.
As I mentioned in the "Defining An Economic Depression" post mentioned above, perhaps the main "unofficial" guidepost of an economic depression is a 10% decline in economic output.  While the U.S. certainly has not experienced such a decline, if one takes a longer-term view of the economic history, and includes a broad list of economic indicators, factors, and surveys, one can make an argument that there is a protracted period of economic weakness in various indicators, as well as many other highly disturbing signs that should reside outside of even a "recession" classification.  I discuss my continuing view on how I interpret the ongoing economic situation in the "A Special Note On Our Economic Situation" page.
Of course, the paramount question is "what happens next?" Will the U.S. economy continue to avoid (as almost universally forecast) widespread economic weakness - or will widespread economic weakness occur?
I continue to believe, based upon various analyses, that various underlying "unresolved issues" - including many exceedingly large asset bubbles - and trends both in the economy and financial system continue to be vastly problematical.  On an "all things considered" basis, the underlying dynamics bode very poorly for the future economic situation.
_____
The Special Note summarizes my overall thoughts about our economic situation
SPX at 1847.71 as this post is written
Current Economic Situation

With regard to our current economic situation, my thoughts can best be described/summarized by the posts found under the 33 “Building Financial Danger” posts.
My thoughts concerning our ongoing economic situation – with future implications – can be seen on the page titled “A Special Note On Our Economic Situation,” which has been found near the bottom of every blog post since August 15, 2010.
_____
The Special Note summarizes my overall thoughts about our economic situation
SPX at 1849.85 as this post is written
Updates Of Economic Indicators February 2014

Here is an update of various indicators that are supposed to predict and/or depict economic activity. These indicators have been discussed in previous blog posts:
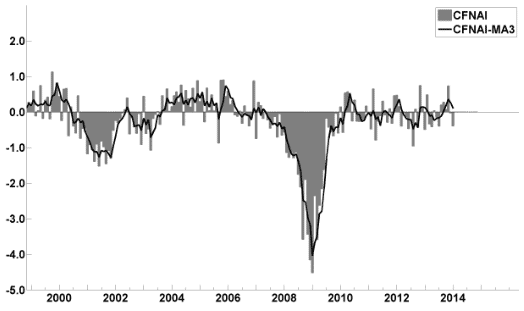
The February 2014 Chicago Fed National Activity Index (CFNAI)(pdf) updated as of February 24, 2014:
CFNAI-MA3
-
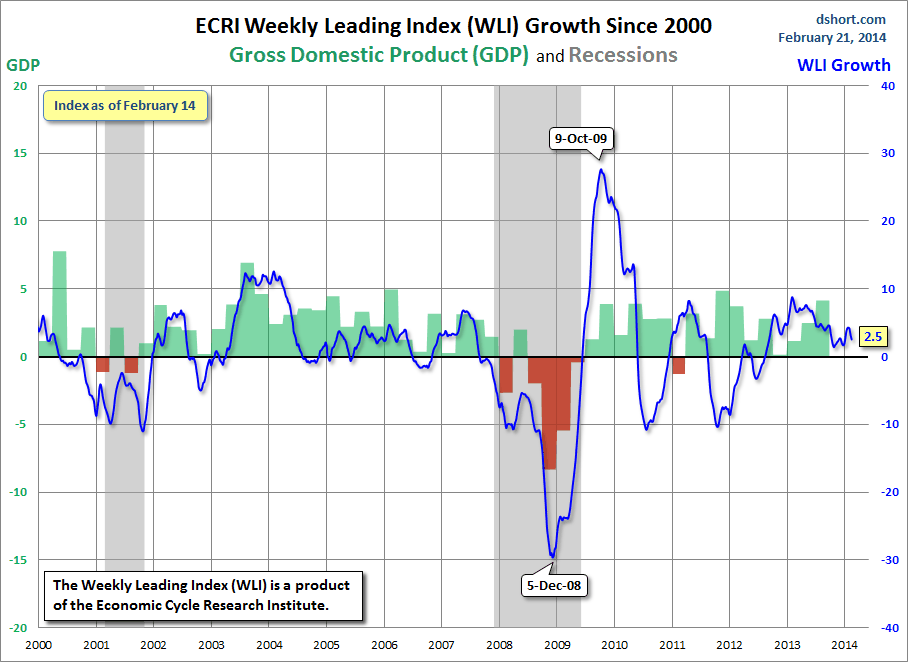
As of February 21, 2014 (incorporating data through February 14, 2014) the WLI was at 133.2 and the WLI, Gr. was at 2.5%.
Here is a chart of the ECRI WLI,Gr., from Doug Short's February 21, 2014 post titled "ECRI Recession Watch:  Weekly Update" :
ECRI WLI, Gr.
-
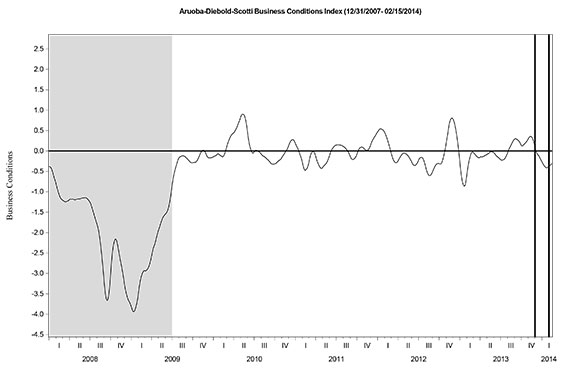
Here is the latest chart, depicting the ADS Index from December 31, 2007 through February 15, 2014:
ADS Index
-
As per the February 20, 2014 press release, the LEI was at 99.5 and the CEI was at 108.1 in January.
An excerpt from the February 20 release:
“The increase in the Leading Economic Index reflects an economy that is expanding moderately, although the pace is somewhat held back by persistent and severe inclement weather in most parts of the country,” said Economist Ken Goldstein. “If the economy is going to move on to a faster track in 2014 compared to last year, consumer demand and especially investment will need to pick up significantly from their current trends.
Here is a chart of the LEI from Doug Short’s blog post of February 23 titled “Conference Board Leading Economic Index Edged up in January“ :
Conference Board LEI

_________
I post various indicators and indices because I believe they should be carefully monitored.  However, as those familiar with this blog are aware, I do not necessarily agree with what they depict or imply.
_____
The Special Note summarizes my overall thoughts about our economic situation
SPX at 1856.26 as this post is written
Friday, February 21, 2014

Long-Term Charts Of The ECRI WLI & ECRI WLI, Gr. – February 21, 2014 Update

As I stated in my July 12, 2010 post (“ECRI WLI Growth History“):
For a variety of reasons, I am not as enamored with ECRI’s WLI and WLI Growth measures as many are.
However, I do think the measures are important and deserve close monitoring and scrutiny.
The movement of the ECRI WLI and WLI, Gr. is particularly notable at this time, as ECRI publicly announced on September 30, 2011 that the U.S. was “tipping into recession,” and ECRI has reiterated the view that the U.S. economy is currently in a recession, seen most recently in these twelve sources :
Other past notable year 2012 reaffirmations of the September 30, 2011 recession call by ECRI were seen (in chronological order) on March 15 (“Why Our Recession Call Stands”) as well as various interviews and statements the week of May 6, including:
Also, subsequent to May 2012:
__
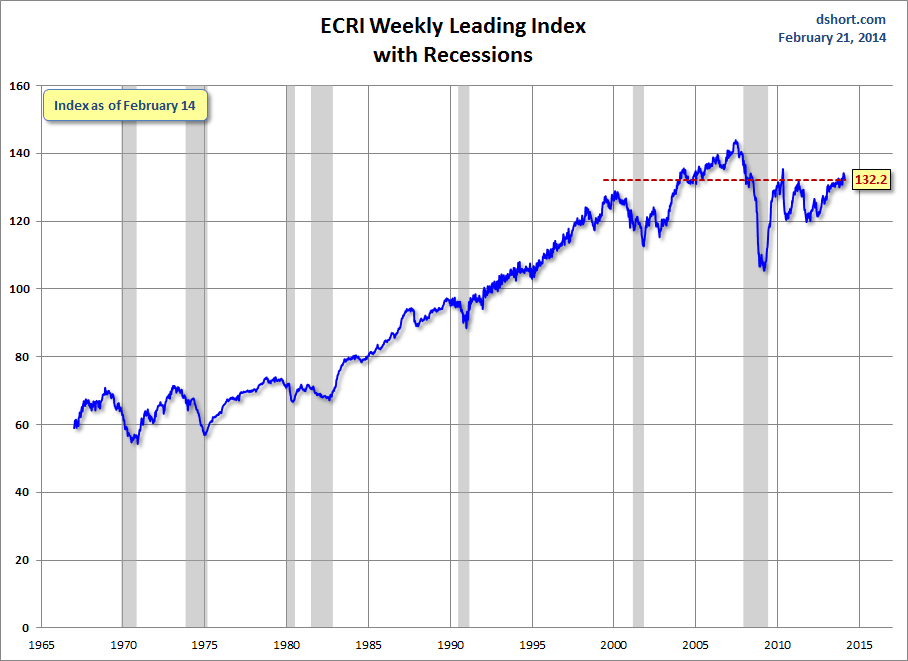
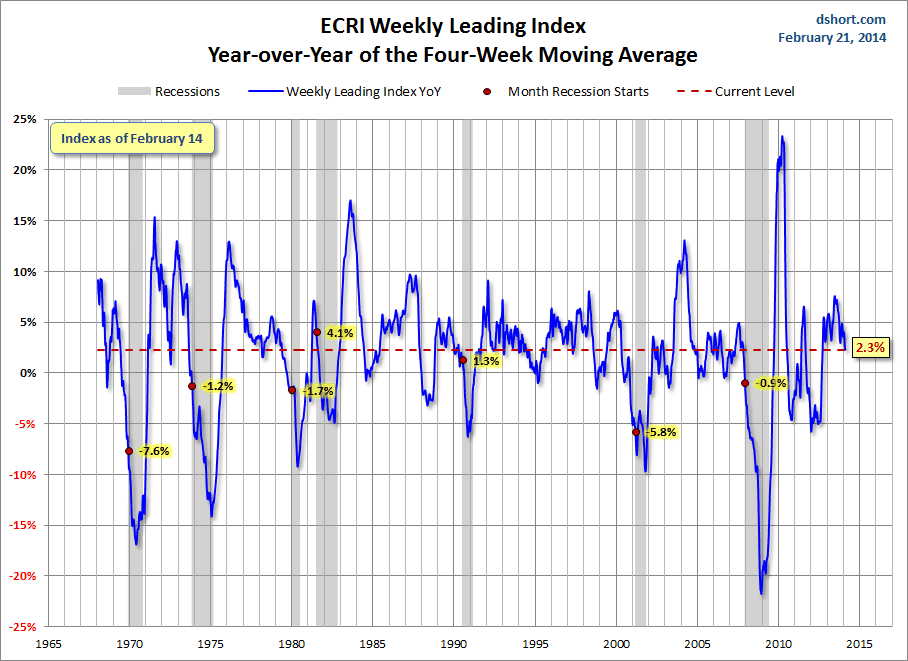
Below are three long-term charts, from Doug Short’s blog post of February 21, 2014 titled “ECRI Recession Watch:  Weekly Update.”  These charts are on a weekly basis through the February 21 release, indicating data through February 14, 2014.
Here is the ECRI WLI (defined at ECRI’s glossary):
Dshort 2-21-14 - ECRI-WLI 132.2
-
This next chart depicts, on a long-term basis, the Year-over-Year change in the 4-week moving average of the WLI:
Dshort 2-21-14 - ECRI-WLI-YoY 2.3 percent
-
This last chart depicts, on a long-term basis, the WLI, Gr.:
Dshort 2-21-14 - ECRI-WLI-growth-since-1965 2.5

_________
I post various economic indicators and indices because I believe they should be carefully monitored.  However, as those familiar with this blog are aware, I do not necessarily agree with what they depict or imply.
_____
The Special Note summarizes my overall thoughts about our economic situation
SPX at 1836.25 as this post is written
Markets During Periods Of Federal Reserve Intervention – February 20, 2014 Update

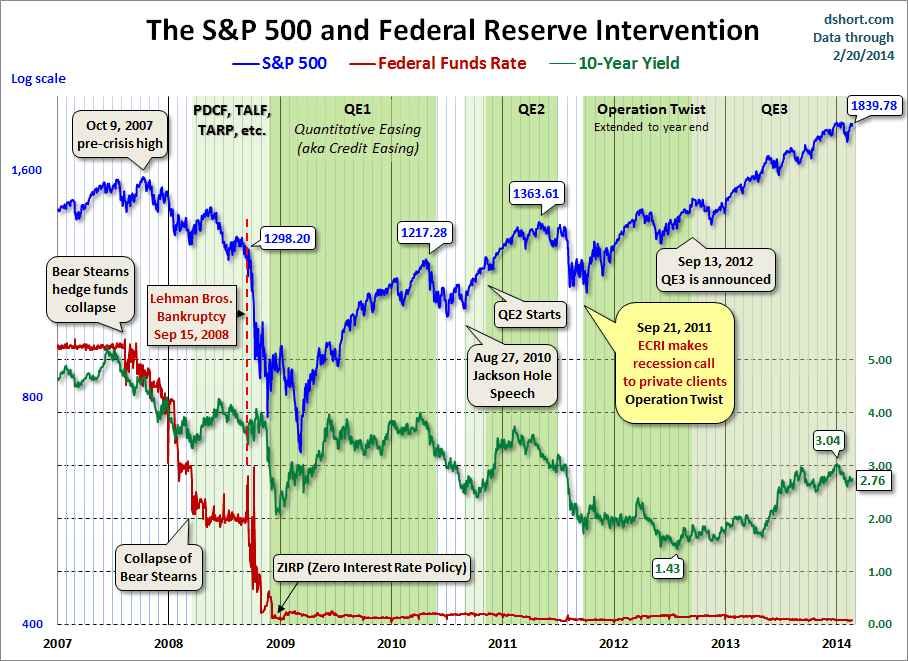
In the August 9, 2011 post (“QE3 – Various Thoughts“) I posted a chart that depicted the movements of the S&P500, 10-Year Treasury Yield and the Fed Funds rate spanning the periods of various Federal Reserve interventions since 2007.
For reference purposes, here is an updated chart from Doug Short’s blog post of February 21, 2014 (“ECRI Weekly Leading Index“) :
(click on chart to enlarge image)
Dshort 2-21-14 - ECRI-recession-call-crushed-by-the-Fed

_____
The Special Note summarizes my overall thoughts about our economic situation
SPX at 1843.61 as this post is written

Thursday, February 20, 2014

St. Louis Financial Stress Index – February 20, 2014 Update

On March 28, 2011 I wrote a post (“The STLFSI“) about the St. Louis Fed’s Financial Stress Index (STLFSI) which is supposed to measure stress in the financial system.  For reference purposes, the most recent chart is seen below.  This chart was last updated on February 20, incorporating data from December 31,1993 to February 14, 2014, on a weekly basis.  The February 14, 2014 value is -.97:
(click on chart to enlarge image)
STLFSI_2-20-14 -.97
-
Here is the STLFSI chart from a 1-year perspective:
STLFSI_2-20-14 -.97 1-year
Data Source: FRED, Federal Reserve Economic Data, Federal Reserve Bank of St. Louis; accessed February 20, 2014:
_________
I post various indicators and indices because I believe they should be carefully monitored.  However, as those familiar with this blog are aware, I do not necessarily agree with what they depict or imply.
_____
The Special Note summarizes my overall thoughts about our economic situation
SPX at 1839.97 as this post is written

Chicago Fed National Financial Conditions Index (NFCI)

Each week I have been posting two charts of the St. Louis Fed’s Financial Stress Index (STLFSI), which is supposed to measure stress in the financial system.
Of course, there are a variety of other measures and indices that are supposed to measure financial stress and other related issues, both from the Federal Reserve as well as from private sources.
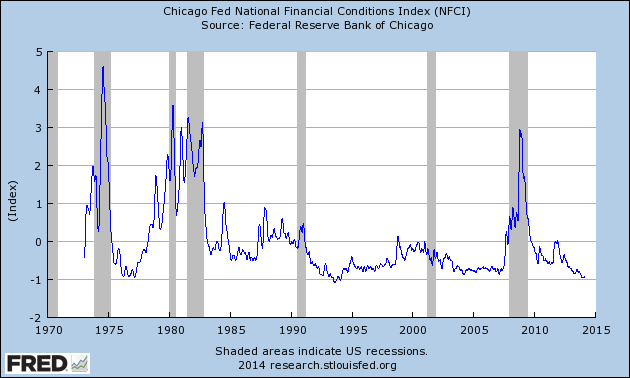
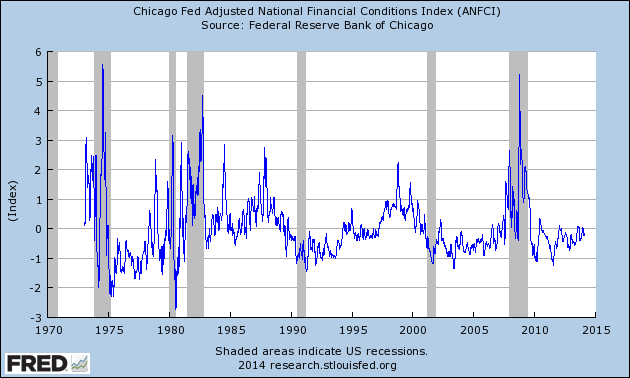
Two other indices that I regularly monitor include the Chicago Fed National Financial Conditions Index (NFCI) as well as the Chicago Fed Adjusted National Financial Conditions Index (ANFCI).
Here are summary descriptions of each, as seen in FRED:
The National Financial Conditions Index (NFCI) measures risk, liquidity and leverage in money markets and debt and equity markets as well as in the traditional and “shadow” banking systems. Positive values of the NFCI indicate financial conditions that are tighter than average, while negative values indicate financial conditions that are looser than average.
The adjusted NFCI (ANFCI). This index isolates a component of financial conditions uncorrelated with economic conditions to provide an update on how financial conditions compare with current economic conditions.
For further information, please visit the Federal Reserve Bank of Chicago’s web site:
Here are the most recently updated charts of the NFCI and ANFCI, respectively.
The NFCI chart below was last updated on February 20, incorporating data from January 5,1973 to February 14, 2014, on a weekly basis.  The February 14, 2014 value is -.94:
(click on chart to enlarge image)
NFCI_2-20-14 -.94
Data Source: FRED, Federal Reserve Economic Data, Federal Reserve Bank of St. Louis; accessed February 20, 2014:
-
The ANFCI chart below was last updated on February 20, incorporating data from January 5,1973 to February 14, 2014, on a weekly basis.  The February 14, 2014 value is -.19:
(click on chart to enlarge image)
ANFCI_2-20-14 -.19
Data Source: FRED, Federal Reserve Economic Data, Federal Reserve Bank of St. Louis; accessed February 20, 2014:
_________
I post various indicators and indices because I believe they should be carefully monitored.  However, as those familiar with this blog are aware, I do not necessarily agree with what they depict or imply.
_____
The Special Note summarizes my overall thoughts about our economic situation
SPX at 1839.79 as this post is written

Walmart’s Q4 2014 Results – Comments

I found various notable items in Walmart’s Q4 2014 management call transcript (pdf) dated February 20, 2014.  (as well, there is Walmart's press release of the Q4 and Full Year 2014 results)

I view Walmart’s results and comments as particularly noteworthy given their retail prominence and focus on low prices.  I have previously commented on their quarterly conference call comments; these previous posts are found under the “paycheck to paycheck” tag.
Here are various excerpts that I find most notable:
comments from Claire Babineaux-Fontenot, EVP of finance and treasurer, page 9:
Strategic price investment within all three operating segments contributed to a 40 basis point reduction in our gross profit rate, bringing it to 23.9 percent for the quarter.
comments from Claire Babineaux-Fontenot, EVP of finance and treasurer, pages 10-11:
For the 53-week period ended January 31, U.S. comp sales, without fuel, decreased 0.4 percent.
While our gross profit grew 1.5 percent, our gross profit rate declined 3 basis points to 24.3 percent, which reflects our ongoing investment in price, as well as our global merchandise mix.
comments from Bill Simon, president and CEO of Walmart U.S., page 13:
Net sales grew by $1.8 billion or 2.4 percent.  For the 14 weeks ending January 31, comp store sales were down 0.4 percent, with ticket up 1.3 percent and traffic down 1.7 percent.  In the absence of a reduction of government SNAP benefits, which represented approximately 40 basis points of impact to comp sales, we believe the quarter would have been flat.  Additionally, comps were pressured by winter storms, which forced the closure of over 200 stores at some point over the course of quarter.
also:
In addition, we continue to be pleased with the strength of our small formats.  These stores continue to deliver positive comp sales and traffic increases each quarter.  In fact, comp sales, without fuel, for Neighborhood Markets grew approximately 5 percent for the 14-week period.
also:
Gross profit increased 0.8 percent, with our gross profit rate down 41 basis points, driven primarily by a commitment to price leadership.  Our customers rely on us to deliver low prices on the items they want most.  We believe our price investment was a material driver to accelerated share gains and positive comps during the holiday season.
comments from Bill Simon, president and CEO of Walmart U.S., page 16:
Gross profit for the year increased 1.8 percent, with a slight gross profit rate decline.  Price investments were offset by cost of goods savings initiatives.
comments from Bill Simon, president and CEO of Walmart U.S., page 18:
In the first quarter, we expect the retail landscape to remain challenging.  Comp sales were down at the beginning of the 13-week period, due largely to continued winter storms.  However, we’re encouraged by our underlying business trends and anticipate a positive sales comp for the balance of the quarter.  Therefore, we expect a relatively flat sales comp for the 13-week period ending May 2.   Last year’s 13-week comp ending April 26, 2013 was down 1.4 percent.
David Cheesewright, president and CEO of Walmart International, page 20:
Around the globe, the holiday season was softer than we would’ve liked, particularly in our larger markets, as we continue to see customers manage on a relatively tight budget.
Gross profit rate, on a reported basis, fell 53 basis points and on a constant currency basis, decreased 44 basis points.  This was primarily driven by price investments in Brazil, Canada and Mexico.
comments from Charles Holley, CFO, page 38:
  • We delivered over $473 billion in net sales.  E-commerce sales grew over 30 percent to more than $10 billion, including acquisitions.
comments from Charles Holley, CFO, page 41:
Let’s turn to guidance. We expect economic factors to have more negative than positive effect on our outlook. Now, you’ve heard today about some of the factors affecting the U.S. business, including reductions in government benefits, and along with higher taxes and tight credit, these items will continue to weigh on our customers.
_____
The Special Note summarizes my overall thoughts about our economic situation
SPX at 1829.11 as this post is written