Pages

Wednesday, December 30, 2015

Chicago Fed National Financial Conditions Index (NFCI)

The St. Louis Fed’s Financial Stress Index (STLFSI) is one index that is supposed to measure stress in the financial system.  Its reading as of the December 24, 2015 update (reflecting data through December 18) is -.557.
Of course, there are a variety of other measures and indices that are supposed to measure financial stress and other related issues, both from the Federal Reserve as well as from private sources.
Two other indices that I regularly monitor include the Chicago Fed National Financial Conditions Index (NFCI) as well as the Chicago Fed Adjusted National Financial Conditions Index (ANFCI).
Here are summary descriptions of each, as seen in FRED:
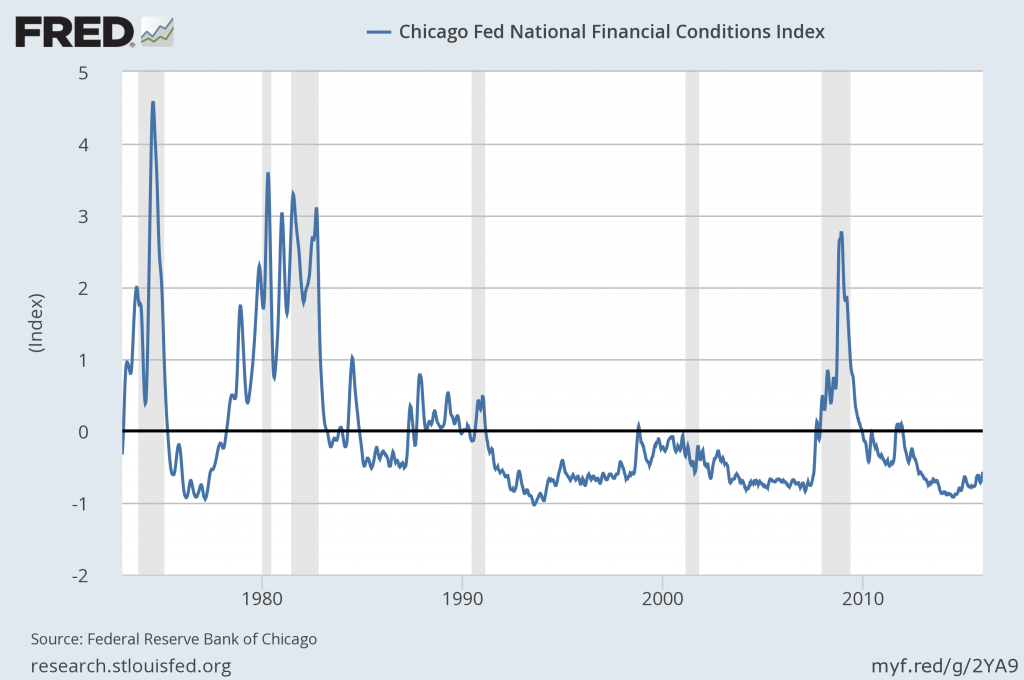
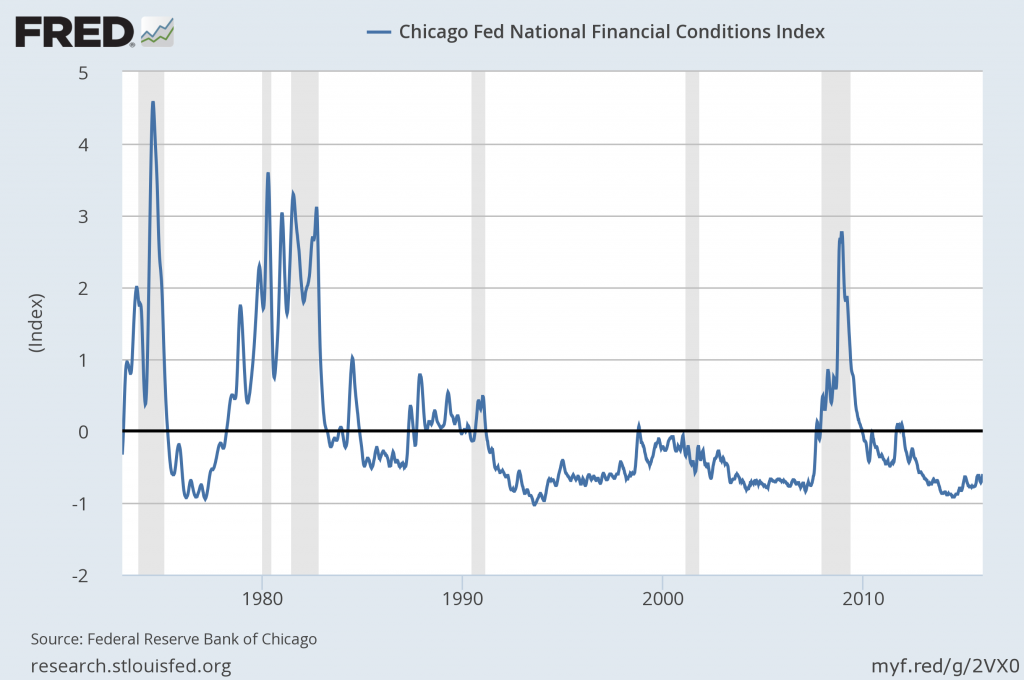
The National Financial Conditions Index (NFCI) measures risk, liquidity and leverage in money markets and debt and equity markets as well as in the traditional and “shadow” banking systems. Positive values of the NFCI indicate financial conditions that are tighter than average, while negative values indicate financial conditions that are looser than average.
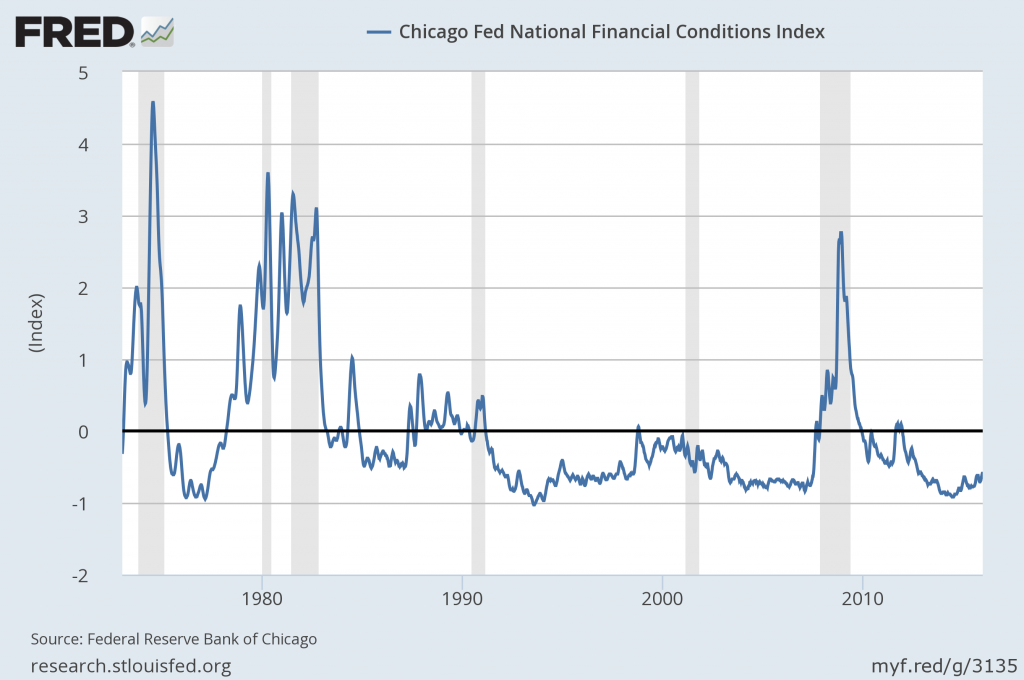
The adjusted NFCI (ANFCI). This index isolates a component of financial conditions uncorrelated with economic conditions to provide an update on how financial conditions compare with current economic conditions.
For further information, please visit the Federal Reserve Bank of Chicago’s web site:
Below are the most recently updated charts of the NFCI and ANFCI, respectively.
The NFCI chart below was last updated on December 30, 2015 incorporating data from January 5,1973 to December 25, 2015, on a weekly basis.  The December 25, 2015 value is -.59:
NFCI
Data Source: FRED, Federal Reserve Economic Data, Federal Reserve Bank of St. Louis; accessed December 30, 2015:
The ANFCI chart below was last updated on December 30, 2015 incorporating data from January 5,1973 to December 25, 2015, on a weekly basis.  The December 25 value is -.32:
anfci
Data Source: FRED, Federal Reserve Economic Data, Federal Reserve Bank of St. Louis; accessed December 30, 2015:
_________
I post various indicators and indices because I believe they should be carefully monitored.  However, as those familiar with this blog are aware, I do not necessarily agree with what they depict or imply.
_____
The Special Note summarizes my overall thoughts about our economic situation
SPX at 2072.04 as this post is written

Tuesday, December 29, 2015

Consumer Confidence Surveys – As Of December 29, 2015

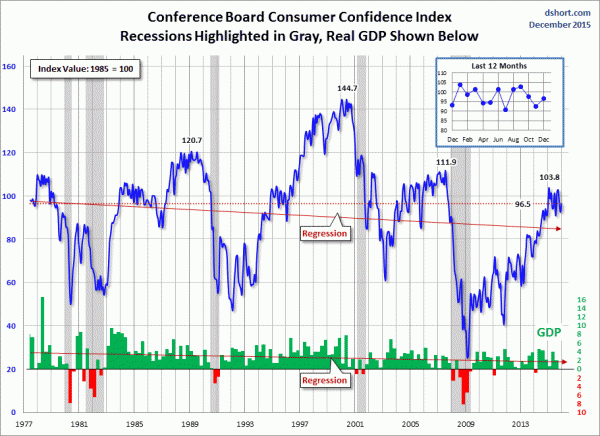
Doug Short had a blog post of December 29, 2015 (“Consumer Confidence Improved in December“) in which he presents the latest Conference Board Consumer Confidence and Thomson/Reuters University of Michigan Consumer Sentiment Index charts.  They are presented below:
(click on charts to enlarge images)
Conference Board Consumer Confidence
Michigan Consumer Sentiment
There are a few aspects of the above charts that I find highly noteworthy.  Of course, until the recent sudden upswing, the continued subdued absolute levels of these two surveys was disconcerting.
Also, I find the “behavior” of these readings to be quite disparate as compared to the other post-recession periods, as shown in the charts between the gray shaded areas (the gray areas denote recessions as defined by the NBER.)
While I don’t believe that confidence surveys should be overemphasized, I find these readings to be very problematical, especially in light of a variety of other highly disconcerting measures highlighted throughout this site.
_____
The Special Note summarizes my overall thoughts about our economic situation
SPX at 2074.72 as this post is written

misc. note – corrections of blog posts

In the July 2, 2010 post I explained my policy with regard to changing the content of posts after the day the posts have been published on the blog.

Wednesday, December 23, 2015

Chicago Fed National Financial Conditions Index (NFCI)

The St. Louis Fed’s Financial Stress Index (STLFSI) is one index that is supposed to measure stress in the financial system.  Its reading as of the December 17, 2015 update (reflecting data through December 11) is -.691.
Of course, there are a variety of other measures and indices that are supposed to measure financial stress and other related issues, both from the Federal Reserve as well as from private sources.
Two other indices that I regularly monitor include the Chicago Fed National Financial Conditions Index (NFCI) as well as the Chicago Fed Adjusted National Financial Conditions Index (ANFCI).
Here are summary descriptions of each, as seen in FRED:
The National Financial Conditions Index (NFCI) measures risk, liquidity and leverage in money markets and debt and equity markets as well as in the traditional and “shadow” banking systems. Positive values of the NFCI indicate financial conditions that are tighter than average, while negative values indicate financial conditions that are looser than average.
The adjusted NFCI (ANFCI). This index isolates a component of financial conditions uncorrelated with economic conditions to provide an update on how financial conditions compare with current economic conditions.
For further information, please visit the Federal Reserve Bank of Chicago’s web site:
Below are the most recently updated charts of the NFCI and ANFCI, respectively.
The NFCI chart below was last updated on December 23, 2015 incorporating data from January 5,1973 to December 18, 2015, on a weekly basis.  The December 18, 2015 value is -.57:
NFCI
Data Source: FRED, Federal Reserve Economic Data, Federal Reserve Bank of St. Louis; accessed December 23, 2015:
The ANFCI chart below was last updated on December 23, 2015 incorporating data from January 5,1973 to December 18, 2015, on a weekly basis.  The December 18 value is -.38:
ANFCI_ 12-23-15 -.38
Data Source: FRED, Federal Reserve Economic Data, Federal Reserve Bank of St. Louis; accessed December 23, 2015:
_________
I post various indicators and indices because I believe they should be carefully monitored.  However, as those familiar with this blog are aware, I do not necessarily agree with what they depict or imply.
_____
The Special Note summarizes my overall thoughts about our economic situation
SPX at 2056.63 as this post is written

Durable Goods New Orders – Long-Term Charts Through November 2015

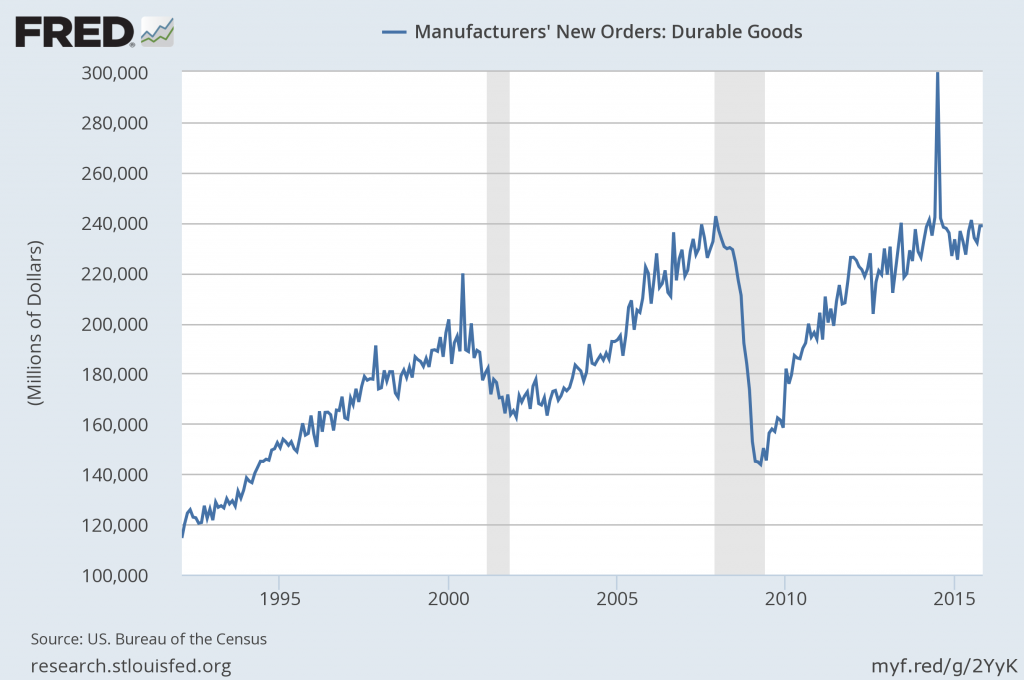
Many people place emphasis on Durable Goods New Orders as a prominent economic indicator and/or leading economic indicator.
For reference, below are two charts depicting this measure.
First, from the St. Louis Fed site (FRED), a chart through November, updated on December 23, 2015. This value is $238,776 ($ Millions):
(click on charts to enlarge images)
Durable Goods New Orders
Second, here is the chart depicting this measure on a “Percentage Change from a Year Ago” basis:
Durable Goods New Orders
Data Source: FRED, Federal Reserve Economic Data, Federal Reserve Bank of St. Louis: Manufacturers’ New Orders:  Durable Goods [DGORDER]; U.S. Department of Commerce: Census Bureau; accessed December 23, 2015;
_________
I post various indicators and indices because I believe they should be carefully monitored.  However, as those familiar with this blog are aware, I do not necessarily agree with what they depict or imply.
_____
The Special Note summarizes my overall thoughts about our economic situation
SPX at 2053.35 as this post is written

The U.S. Economic Situation – December 23, 2015 Update

Perhaps the main reason that I write of our economic situation is that I continue to believe, based upon various analyses, that our economic situation is in many ways misunderstood.  While no one likes to contemplate a future rife with economic adversity, current and future economic problems must be properly recognized and rectified if high-quality, sustainable long-term economic vitality is to be realized.
There are an array of indications and other “warning signs” – many readily apparent – that current economic activity and financial market performance is accompanied by exceedingly perilous dynamics.
I have written extensively about this peril, including in the following:
Building Financial Danger” (ongoing updates)
My analyses continues to indicate that the growing level of financial danger will lead to the next stock market crash that will also involve (as seen in 2008) various other markets as well.  Key attributes of this next crash is its outsized magnitude (when viewed from an ultra-long term historical perspective) and the resulting economic impact.  This next financial crash is of tremendous concern, as my analyses indicate it will lead to a Super Depression – i.e. an economy characterized by deeply embedded, highly complex, and difficult-to-solve problems.
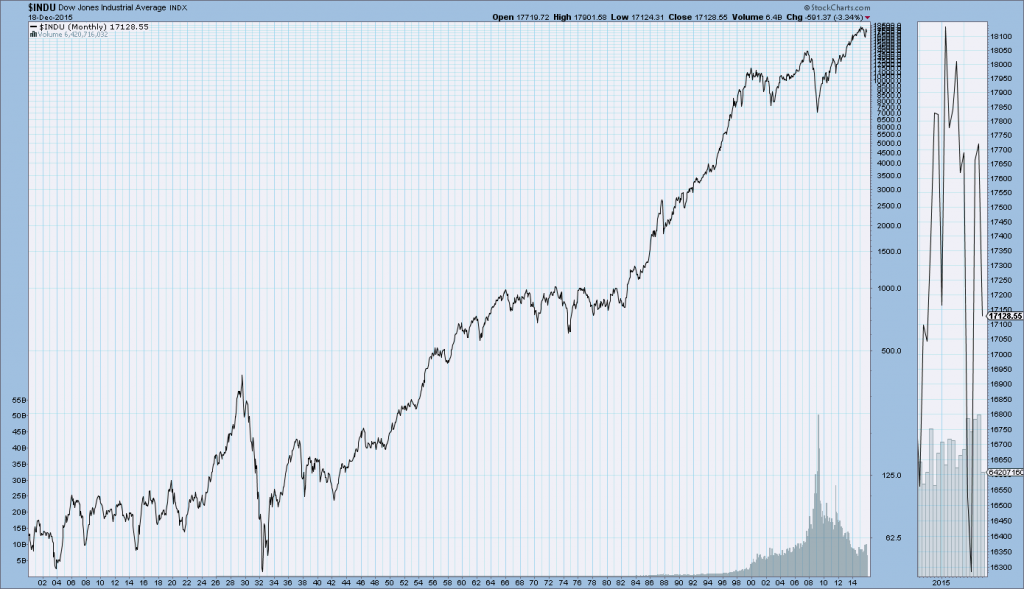
For long-term reference purposes, here is a chart of the Dow Jones Industrial Average since 1900, depicted on a monthly basis using a LOG scale (updated through December 18, 2015, with a last value of 17128.55):
(click on chart to enlarge image)(chart courtesy of StockCharts.com)
DJIA from 1900
_____
The Special Note summarizes my overall thoughts about our economic situation
SPX at 2053.81 as this post is written

Tuesday, December 22, 2015

Money Supply Charts Through November 2015

For reference purposes, below are two sets of charts depicting growth in the money supply.
The first shows the MZM (Money Zero Maturity), defined in FRED as the following:
M2 less small-denomination time deposits plus institutional money funds.
Money Zero Maturity is calculated by the Federal Reserve Bank of St. Louis.
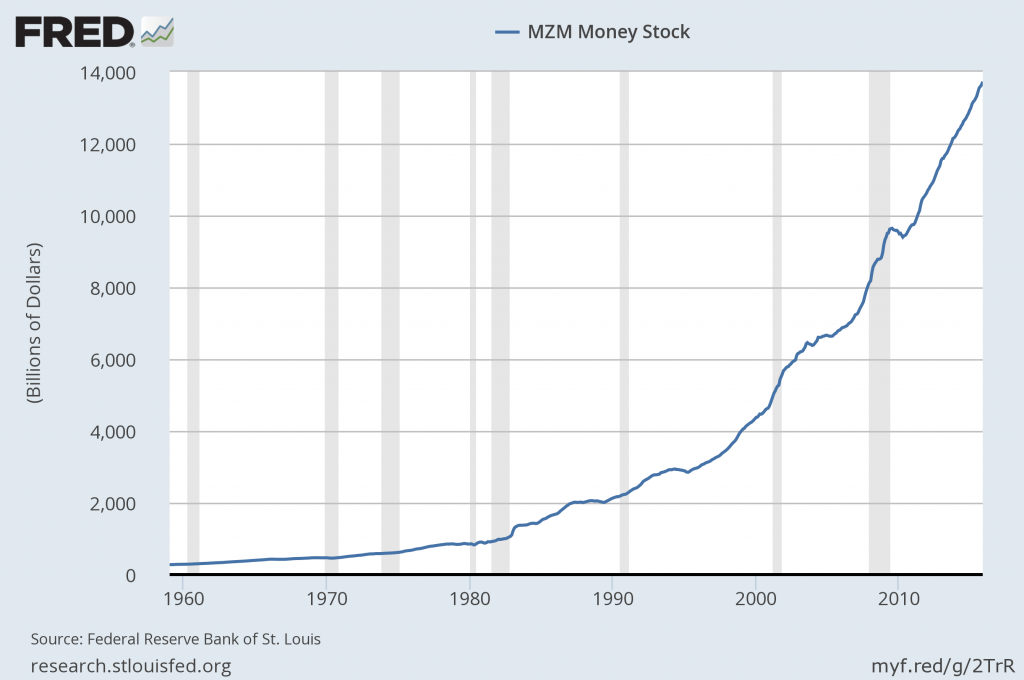
Here is the “MZM Money Stock” (seasonally adjusted) chart, updated on December 18, 2015 depicting data through November 2015, with a value of $13,725.8 Billion:
MZM Money Supply
Here is the “MZM Money Stock” chart on a “Percent Change From Year Ago” basis:
MZM money supply percent change from year ago
Data Source: FRED, Federal Reserve Economic Data, Federal Reserve Bank of St. Louis; accessed December 22, 2015:
The second set shows M2, defined in FRED as the following:
M2 includes a broader set of financial assets held principally by households. M2 consists of M1 plus: (1) savings deposits (which include money market deposit accounts, or MMDAs); (2) small-denomination time deposits (time deposits in amounts of less than $100,000); and (3) balances in retail money market mutual funds (MMMFs). Seasonally adjusted M2 is computed by summing savings deposits, small-denomination time deposits, and retail MMMFs, each seasonally adjusted separately, and adding this result to seasonally adjusted M1.
Here is the “M2 Money Stock” (seasonally adjusted) chart, updated on December 17, 2015, depicting data through November 2015, with a value of $12,288.3 Billion:
M2SL
Here is the “M2 Money Stock” chart on a “Percent Change From Year Ago” basis:
M2SL Percent Change From Year Ago
Data Source: FRED, Federal Reserve Economic Data, Federal Reserve Bank of St. Louis; accessed December 22, 2015:
_____
The Special Note summarizes my overall thoughts about our economic situation
SPX at 2027.01 as this post is written

Monday, December 21, 2015

Updates Of Economic Indicators December 2015

Here is an update of various indicators that are supposed to predict and/or depict economic activity. These indicators have been discussed in previous blog posts:
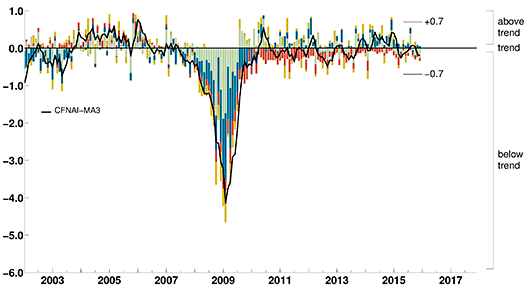
The December 2015 Chicago Fed National Activity Index (CFNAI) updated as of December 21, 2015:
CFNAI-MA3
As of December 18, 2015 (incorporating data through December 11, 2015) the WLI was at 131.1 and the WLI, Gr. was at -.6%.
A chart of the WLI,Gr., from Doug Short’s post of December 18, 2015, titled “ECRI Weekly Leading Index: ‘Another Fractional Decrease from Previous Week'“:
ECRI WLI,Gr.
Here is the latest chart, depicting the ADS Index from December 31, 2007 through December 12, 2015:
ADS Index
The Conference Board Leading (LEI), Coincident (CEI) Economic Indexes, and Lagging Economic Indicator (LAG):
As per the December 17, 2015 press release, titled “The Conference Board Leading Economic Index (LEI) for the U.S. Increased,” (pdf) the LEI was at 124.6, the CEI was at 113.3, and the LAG was 119.6 in November.
An excerpt from the December 17 release:
“The U.S. LEI registered another increase in November, with building permits, the interest rate spread, and stock prices driving the improvement,” said Ataman Ozyildirim, Director of Business Cycles and Growth Research at The Conference Board. “Although the six-month growth rate of the LEI has moderated, the economic outlook for the final quarter of the year and into the new year remains positive.”
Here is a chart of the LEI from Doug Short’s blog post of December 17 titled “Conference Board Leading Economic Index: Slight Increase in November“:
Conference Board LEI
_________
I post various indicators and indices because I believe they should be carefully monitored.  However, as those familiar with this blog are aware, I do not necessarily agree with what they depict or imply.
_____
The Special Note summarizes my overall thoughts about our economic situation
SPX at 2013.38 as this post is written

Trends Of S&P500 Earnings Forecasts

S&P500 earnings trends and estimates are a notably important topic, for a variety of reasons, at this point in time.
FactSet publishes a report titled “Earnings Insight” that contains a variety of information including the trends and expectations of S&P500 earnings.
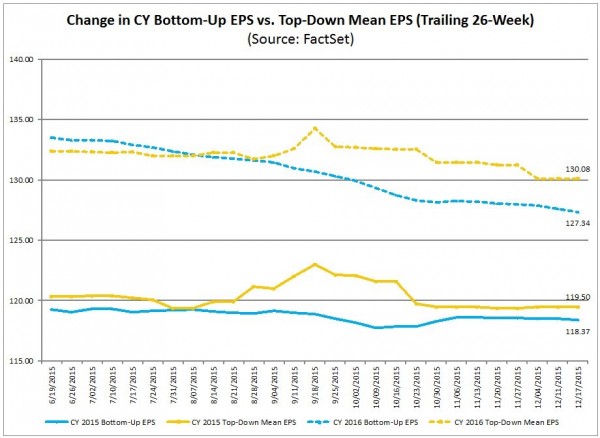
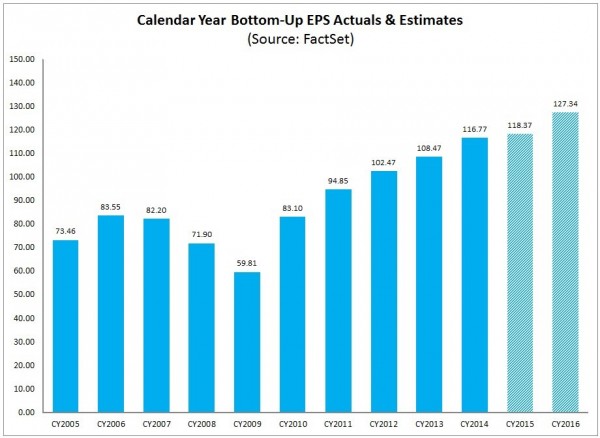
For reference purposes, here are two charts as seen in the “Earnings Insight” (pdf) report of December 18, 2015:
from page 20:
(click on charts to enlarge images)
S&P500 earnings estimate trends
from page 21:
S&P500 earnings
_____
I post various economic forecasts because I believe they should be carefully monitored.  However, as those familiar with this blog are aware, I do not agree with many of the consensus estimates and much of the commentary in these forecast surveys.
_____
The Special Note summarizes my overall thoughts about our economic situation
SPX at 2017.66 as this post is written

S&P500 2015, 2016 & 2017 Annual EPS Estimates

As many are aware, Thomson Reuters publishes earnings estimates for the S&P500.  (My other posts concerning S&P earnings estimates can be found under the S&P500 Earnings tag)
The following estimates are from Exhibit 12 of “The Director’s Report” (pdf) of December 18, 2015, and represent an aggregation of individual S&P500 component “bottom up” analyst forecasts.  For reference, the Year 2014 value is $118.78/share:
Year 2015 estimate:
$117.48/share
Year 2016 estimate:
$127.42/share
Year 2017 estimate:
$143.25/share
_____
I post various economic forecasts because I believe they should be carefully monitored.  However, as those familiar with this blog are aware, I do not agree with many of the consensus estimates and much of the commentary in these forecast surveys.
_____
The Special Note summarizes my overall thoughts about our economic situation
SPX at 2005.55 as this post is written

Friday, December 18, 2015

Standard & Poor’s S&P500 Earnings Estimates For 2015 & 2016 – As Of December 10, 2015

As many are aware, Standard & Poor’s publishes earnings estimates for the S&P500.  (My posts concerning their estimates can be found under the S&P500 Earnings label)
For reference purposes, the most current estimates are reflected below, and are as of December 10, 2015:
Year 2015 estimates add to the following:
-From a “bottom up” perspective, operating earnings of $106.55/share
-From a “top down” perspective, operating earnings of N/A
-From a “bottom up” perspective, “as reported” earnings of $95.57
Year 2016 estimates add to the following:
-From a “bottom up” perspective, operating earnings of $126.34/share
-From a “top down” perspective, operating earnings of N/A
-From a “bottom up” perspective, “as reported” earnings of $118.23/share
_____
I post various economic forecasts because I believe they should be carefully monitored.  However, as those familiar with this blog are aware, I do not agree with many of the consensus estimates and much of the commentary in these forecast surveys.
_____
The Special Note summarizes my overall thoughts about our economic situation
SPX at 2017.63 as this post is written

Long-Term Charts Of The ECRI WLI & ECRI WLI, Gr. – December 18, 2015 Update

As I stated in my July 12, 2010 post (“ECRI WLI Growth History“):
For a variety of reasons, I am not as enamored with ECRI’s WLI and WLI Growth measures as many are.
However, I do think the measures are important and deserve close monitoring and scrutiny.
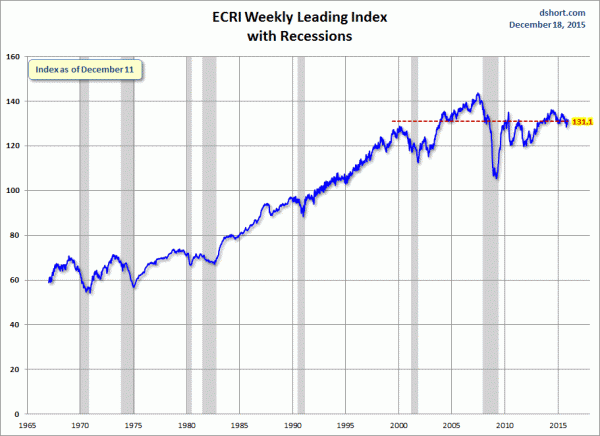
Below are three long-term charts, from Doug Short’s blog post of December 18, 2015 titled “ECRI Weekly Leading Index:  Another Fractional Decrease from Previous Week.”  These charts are on a weekly basis through the December 18, 2015 release, indicating data through December 11, 2015.
Here is the ECRI WLI (defined at ECRI’s glossary):
ECRI WLI
This next chart depicts, on a long-term basis, the Year-over-Year change in the 4-week moving average of the WLI:
Dshort 12-18-15 - ECRI-WLI-YoY -.5 percent
This last chart depicts, on a long-term basis, the WLI, Gr.:
ECRI WLI,Gr.
_________
I post various economic indicators and indices because I believe they should be carefully monitored.  However, as those familiar with this blog are aware, I do not necessarily agree with what they depict or imply.
_____
The Special Note summarizes my overall thoughts about our economic situation
SPX at 2020.66 as this post is written

Janet Yellen’s December 16, 2015 Press Conference – Notable Aspects

On Wednesday, December 16, 2015 Janet Yellen gave her scheduled December 2015 FOMC Press Conference. (link of video and related materials)
Below are Janet Yellen’s comments I found most notable – although I don’t necessarily agree with them – in the order they appear in the transcript.  These comments are excerpted from the “Transcript of Chairman Yellen’s Press Conference“(preliminary)(pdf) of December 16, 2015, with the accompanying “FOMC Statement” and “Economic Projections of Federal Reserve Board Members and Federal Reserve Bank Presidents, December 2015“ (pdf).
From Janet Yellen’s opening comments:
CHAIR YELLEN: Good afternoon. Earlier today, the Federal Open Market Committee decided to raise the target range for the federal funds rate by 1/4 percentage point, bringing it to 1/4 to 1/2 percent.
This action marks the end of an extraordinary seven-year period during which the federal funds rate was held near zero to support the recovery of the economy from the worst financial crisis and recession since the Great Depression. It also recognizes the considerable progress that has been made toward restoring jobs, raising incomes, and easing the economic hardship of millions of Americans. And it reflects the Committee’s confidence that the economy will continue to strengthen. The economic recovery has clearly come a long way, although it is not yet complete. Room for further improvement in the labor market remains, and inflation continues to run below our longer-run objective. But with the economy performing well and expected to continue to do so, the Committee judged that a modest increase in the federal funds rate target is now appropriate, recognizing that even after this increase monetary policy remains accommodative. As I will explain, the process of normalizing interest rates is likely to proceed gradually, although future policy actions will obviously depend on how the economy evolves relative to our objectives of maximum employment and 2 percent inflation.
also:
Since March, the Committee has stated that it would raise the target range for the federal funds rate when it had seen further improvement in the labor market and was reasonably confident that inflation would move back to its 2 percent objective over the medium term. In our judgment, these two criteria have now been satisfied.
The labor market has clearly shown significant further improvement toward our objective of maximum employment. So far this year, a total of 2.3 million jobs have been added to the economy, and over the most recent three months, job gains have averaged an estimated 218,000 per month, similar to the average pace since the beginning of the year. The unemployment rate, at 5 percent in November, is down six tenths of a percentage point from the end of last year and is close to the median of FOMC participants’ estimates of its longer-run normal level. A broader measure of unemployment that includes individuals who want and are available to work but have not actively searched recently and people who are working part time but would rather work full time also has shown solid improvement. That said, some cyclical weakness likely remains: The labor force participation rate is still below estimates of its demographic trend, involuntary parttime employment remains somewhat elevated, and wage growth has yet to show a sustained pickup.
also:
The Committee currently expects that, with gradual adjustments in the stance of monetary policy, economic activity will continue to expand at a moderate pace and labor market indicators will continue to strengthen. Although developments abroad still pose risks to U.S. economic growth, these risks appear to have lessened since late summer. Overall, the Committee sees the risks to the outlook for both economic activity and the labor market as balanced.
Janet Yellen’s responses as indicated to the various questions:
MARTIN CRUTSINGER. Marty Crutsinger with the Associated Press. I guess the word is “finally.” The--and we have asked you for so long, “Why were you delaying? Why were you delaying?” So, I'll ask, given developments around the world that still--there is still weakness and the inflation is still nowhere near your target. What made you say “do it now?” Some have said it was because you feared a lack of credibility if you didn't move. Did that play a role in your decision?
CHAIR YELLEN. We decided to move at this time because we feel the conditions that we set out for a move, namely further improvement in the labor market and reasonable confidence that inflation would move back to 2 percent over the medium term, we felt that these conditions had been satisfied. We have been concerned, as you know, about the risks from the global economy. And those risks persist, but the U.S. economy has shown considerable strength. Domestic spending that accounts for 85 percent of aggregate spending in the U.S. economy has continued to hold up. It's grown at a solid pace. And while there is a drag from net exports, from relatively weak growth abroad, and the appreciation of the dollar, overall, we decided today that the risks to the outlook for the labor market and the economy are balanced.
And we recognize that monetary policy operates with lags. We would like to be able to move in a prudent, and as we've emphasized, gradual manner. It's been a long time since the Federal Reserve has raised interest rates, and I think it's prudent to be able to watch what the impact is on financial conditions and spending in the economy and moving in a timely fashion enables us to do this.
Again, I think it's important not to overblow the significance of this first move. It's only 25 basis points. It--monetary policy remains accommodative. We've indicated that we will be watching what happens very carefully in the economy in terms of our actual and forecast our projected conditions relative to our employment and inflation goals and will adjust policy over time as seems appropriate to achieve those goals. Our expectation as I've indicated is that policy adjustments will be gradual over time, but of course they will be informed by the outlook, which in turn will evolve with incoming data.
STEVE LIESMAN. Madam Chair, thank you. Steve Liesman, CNBC. Under the old regime, before you were raising rates, it was easy to understand within your mandate what you wanted to do. You wanted the unemployment rate to fall, you wanted inflation to rise, and it was easy for the public to judge the success or failure of your policy. Could you explain under the new regime what you’re looking for? Do you want the unemployment rate to stop falling? Do you want it to rise? And what is it you hope for from inflation, which I think is a little more understandable, or is neutral itself now a policy goal?
CHAIR YELLEN. Neutral is not a policy goal. It is an assessment. It's a benchmark that I think is useful for assessing the stance of policy. Neutral is essentially a stance of policy, a level of short-term rates, which if the economy were operating near its potential--and we're reasonably, not quite at that, but reasonably close to it--it would be a level that would maintain or sustain those conditions. So if this point, policy, we judge to be accommodative. The Committee forecasts that the unemployment rate will continue to decline. And I think that's important and appropriate for two reasons. First of all, as I've indicated, I continue to judge that there remains slack in the economy, margins of slack that are not reflected in the standard unemployment rate. And in particular, I pointed to the depressed level of labor force participation and also the somewhat abnormally high level of part-time employment. So further decline in the unemployment rate and strengthening of labor market conditions, will help to erode those margins of slack but also we want to see inflation move back to our 2 percent objective over the medium term, and so seeing above trend growth and continuing tightness, greater tightness in labor and product markets, I think that will help us achieve our objective as well with respect to inflation.
STEVE LIESMAN. Just to follow up, how does raising rates help get you to either of those goals?
CHAIR YELLEN. We have kept rates at an extremely low level and had a high balance sheet for a very long time. We have considered the risks to the outlook and worried about the fact that with interest rates at zero, we have less scope to respond to negative shocks than to positive shocks that would call for a tightening of policy. That is a factor that has induced us to hold rates at zero for this long. But we recognize that policy is accommodative, and if we do not begin to slightly reduce the amount of accommodation, the odds are good that the economy would end up overshooting both our employment and inflation objectives. What we would like to avoid is a situation where we have waited so long that we're forced to tighten policy abruptly, which risks aborting what I would like to see as a very long-running and sustainable expansion. So, to keep the economy moving along the growth path it's on with improving and solid conditions in labor markets, we would like to avoid a situation where we have left so much accommodation in place for so long that we overshoot these objectives and then have to tighten abruptly and risk damaging, damaging that performance.
also:
REBECCA JARVIS. Thank you, Rebecca Jarvis, ABC News. Historically most economic expansions fade after this long. How confident are you that our economy won't slip back into recession in the near term?
CHAIR YELLEN. So let me start by saying that I feel confident about the fundamentals driving the U.S. economy, the health of U.S. households and domestic spending. There are pressures on some sectors of the economy particularly manufacturing and the energy sector reflecting global developments and developments in commodity markets and energy markets, but the underlying health of the U.S. economy, I considered to be quite sound. I think it's a myth that expansions die of old age. I do not think that they die of old age. So the fact that this has been quite a long expansion doesn't lead me to believe that it's one that has, that its days are numbered. But the economy does get hit by shocks, and they were both positive shocks and negative shocks. And so there is a significant odd, you know, probability in any year that the economy will suffer some shock that we don't know about that will put it into recession. And so, I'm not sure exactly how high that probability is in any year but maybe at least on the order of 10 percent. So yes, there is some probability that that could happen and of course we'd appropriately respond, but it isn't something that is fated to happen because we've had a long expansion and I don't see anything in the underlying strength of the economy that would lead me to be concerned about that outcome.
also:
YLAN MUI. Hi, Ylan from the Washington Post. You said earlier that expansions don't die of old age, but I think the other half of that is that it's often central banks that kill them off instead. So I'm wondering how worried you are about the possibility that the Fed will have to turn around after hiking rates. Other central banks that have tried to raise rates have had to do just that. And how damaging you think that might be to the Fed's credibility?
CHAIR YELLEN. So, when you say that central banks often kill them, I think the usual reason that that has been true when that has been true is that central banks have begun too late to tighten policy, and they’ve allowed inflation to get out of control. And at that point, they have had to tighten policy very abruptly and very substantially, and it's caused a downturn, and the downturn has served to lower inflation. So, if you don't mind my flipping the question on you, I would point out that it is because we don't want to cause a recession through that type of dynamic at some future date that it is prudent to begin early and gradually.
Now, it is true that some central banks have raised rates and later turned around. Not in every case has that reflected a policy mistake. Economies are subject to shocks. Sometimes when they have raised rates, it hasn't been the wrong thing to do, but conditions have changed in a way that they have had to reverse policy to respond to shocks.
I'm not denying that there are situations where central banks have moved too early. We have considered the risk of that. We have weighed that risk carefully in making today's decision. I don't believe we'll have to do it. But, look, you know, as I've--as the Committee has said, we're watching economic developments closely, and we will adjust policy in whatever way is necessary to support the attainment of our objectives.

_____
The Special Note summarizes my overall thoughts about our economic situation
SPX at 2041.89 as this post is written
Wednesday, December 16, 2015

Chicago Fed National Financial Conditions Index (NFCI)

The St. Louis Fed’s Financial Stress Index (STLFSI) is one index that is supposed to measure stress in the financial system.  Its reading as of the December 10, 2015 update (reflecting data through December 4) is -.832.
Of course, there are a variety of other measures and indices that are supposed to measure financial stress and other related issues, both from the Federal Reserve as well as from private sources.
Two other indices that I regularly monitor include the Chicago Fed National Financial Conditions Index (NFCI) as well as the Chicago Fed Adjusted National Financial Conditions Index (ANFCI).
Here are summary descriptions of each, as seen in FRED:
The National Financial Conditions Index (NFCI) measures risk, liquidity and leverage in money markets and debt and equity markets as well as in the traditional and “shadow” banking systems. Positive values of the NFCI indicate financial conditions that are tighter than average, while negative values indicate financial conditions that are looser than average.
The adjusted NFCI (ANFCI). This index isolates a component of financial conditions uncorrelated with economic conditions to provide an update on how financial conditions compare with current economic conditions.
For further information, please visit the Federal Reserve Bank of Chicago’s web site:
Below are the most recently updated charts of the NFCI and ANFCI, respectively.
The NFCI chart below was last updated on December 16, 2015 incorporating data from January 5,1973 to December 11, 2015, on a weekly basis.  The December 11, 2015 value is -.60:
NFCI
Data Source: FRED, Federal Reserve Economic Data, Federal Reserve Bank of St. Louis; accessed December 16, 2015:
The ANFCI chart below was last updated on December 16, 2015 incorporating data from January 5,1973 to December 11, 2015, on a weekly basis.  The December 11 value is -.50:
ANFCI
Data Source: FRED, Federal Reserve Economic Data, Federal Reserve Bank of St. Louis; accessed December 16, 2015:
_________
I post various indicators and indices because I believe they should be carefully monitored.  However, as those familiar with this blog are aware, I do not necessarily agree with what they depict or imply.
_____
The Special Note summarizes my overall thoughts about our economic situation
SPX at 2073.06 as this post is written