Pages

Friday, July 31, 2020

St. Louis Fed Price Pressures – Deflation Probability Through July 2020

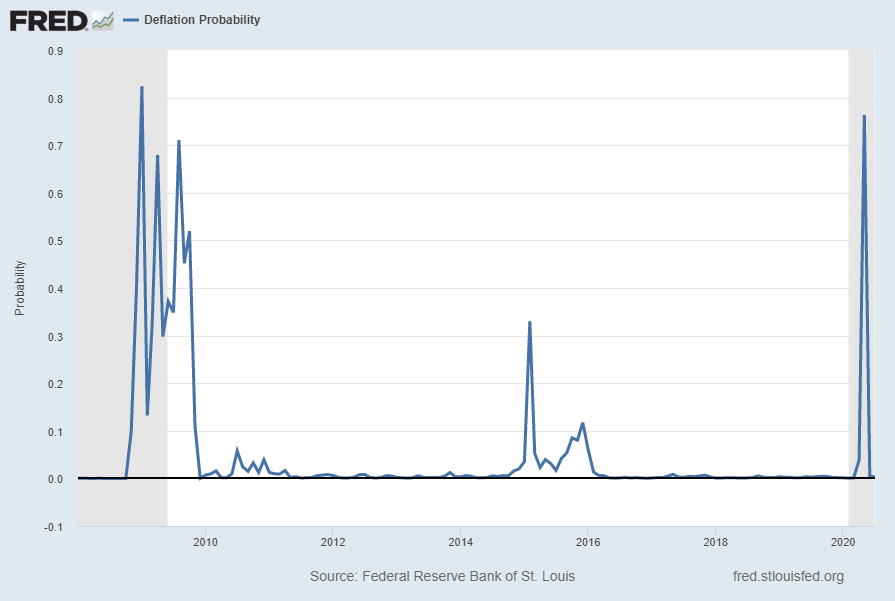
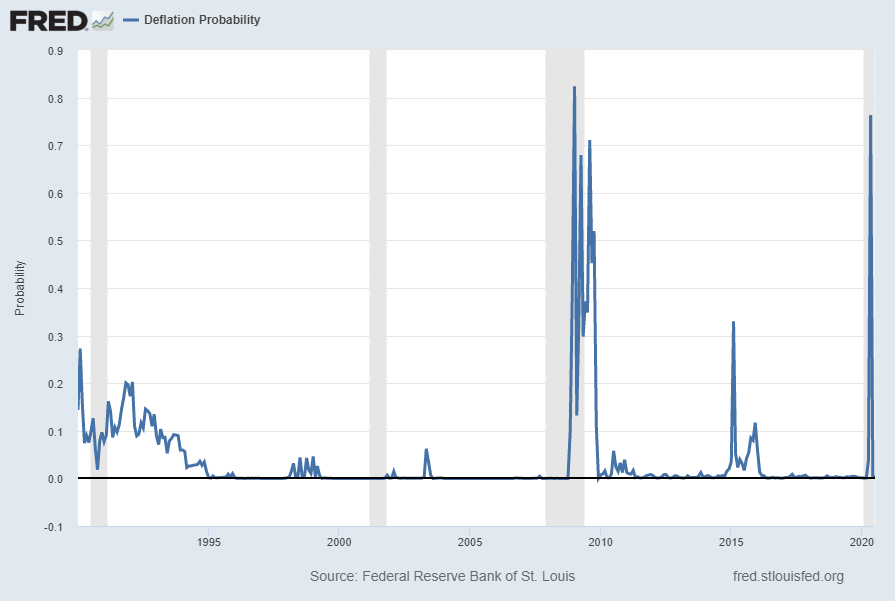
For reference, below is a chart of the St. Louis Fed Price Pressures Measures – Deflation Probability [FRED STLPPMDEF] through July 2020.

While I do not necessarily agree with the current readings of the measure, I view this as a proxy of U.S. deflation probability.

A description of this measure, as seen in FRED:

This series measures the probability that the personal consumption expenditures price index (PCEPI) inflation rate (12-month changes) over the next 12 months will fall below zero.

The chart, on a monthly basis from January 1990 – July 2020, with reading of .00286, last updated on July 31, 2020:

STLPPMDEF since 1990

Here is this same deflation probability measure since 2008:

STLPPMDEF since 2008

source:  Federal Reserve Bank of St. Louis, Deflation Probability [STLPPMDEF], retrieved from FRED, Federal Reserve Bank of St. Louis; accessed July 31, 2020: https://fred.stlouisfed.org/series/STLPPMDEF

_________

I post various economic indicators and indices because I believe they should be carefully monitored.  However, as those familiar with this site are aware, I do not necessarily agree with what they depict or imply.

_____

The Special Note summarizes my overall thoughts about our economic situation

SPX at 3252.99 as this post is written

Consumer Confidence Surveys – As Of July 31, 2020

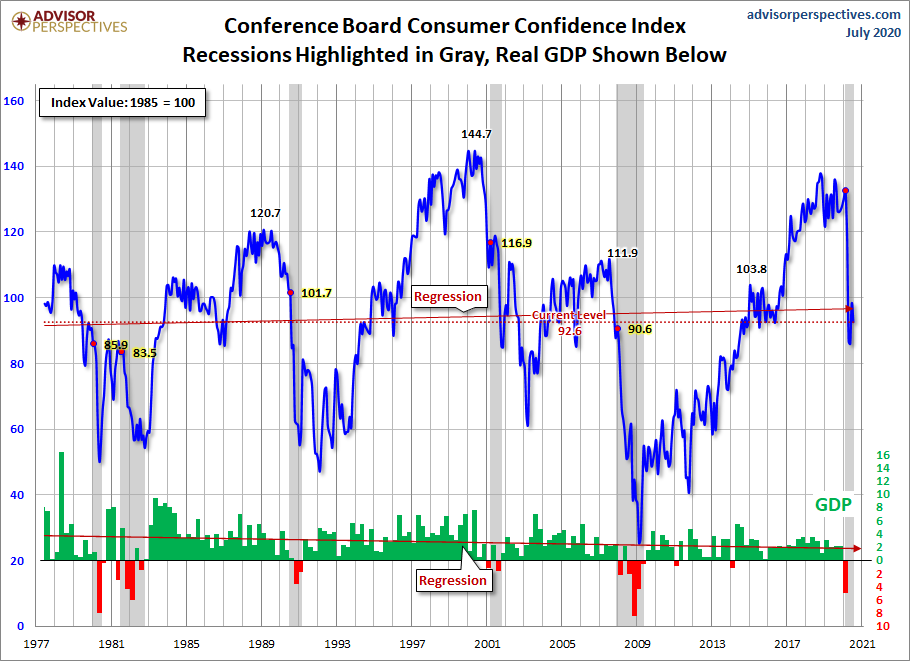
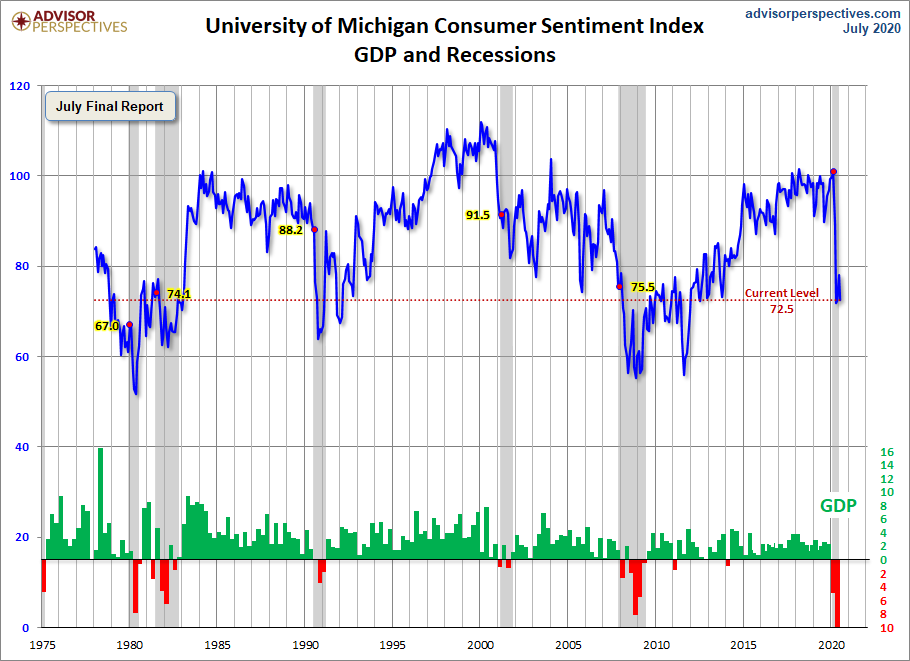
Advisor Perspectives had a post of July 31, 2020 (“Michigan Consumer Sentiment: July Final Sinks Further“) that displays the latest Conference Board Consumer Confidence and Thomson/Reuters University of Michigan Consumer Sentiment Index charts.  They are presented below:

(click on charts to enlarge images)

Conference Board Consumer Confidence Index

University of Michigan Consumer Sentiment Index

There are a few aspects of the above charts that I find highly noteworthy.  Of course, until the sudden upswing in 2014, the continued subdued absolute levels of these two surveys was disconcerting.

Also, I find the “behavior” of these readings to be quite disparate as compared to the other post-recession periods, as shown in the charts between the gray shaded areas (the gray areas denote recessions as defined by the NBER.)

While I don’t believe that confidence surveys should be overemphasized, I find these readings to be notable, especially in light of a variety of other highly disconcerting measures highlighted throughout this site.

_____

The Special Note summarizes my overall thoughts about our economic situation

SPX at 3230.91 as this post is written

Employment Cost Index (ECI) – Second Quarter 2020

While the concept of Americans’ incomes can be defined in a number of ways, many prominent measures continue to show disconcerting trends.

One prominent measure is the Employment Cost Index (ECI).

Here is a description from the BLS document titled “The Employment Cost Index:  what is it?“:

The Employment Cost Index (ECI) is a quarterly measure of the change in the price of labor, defined as compensation per employee hour worked. Closely watched by many economists, the ECI is an indicator of cost pressures within companies that could lead to price inflation for finished goods and services. The index measures changes in the cost of compensation not only for wages and salaries, but also for an extensive list of benefits. As a fixed-weight, or Laspeyres, index, the ECI controls for changes occurring over time in the industrial-occupational composition of employment.

On July 31, 2020, the ECI for the second quarter was released.  Here are two excerpts from the BLS release titled “Employment Cost Index – June 2020“:

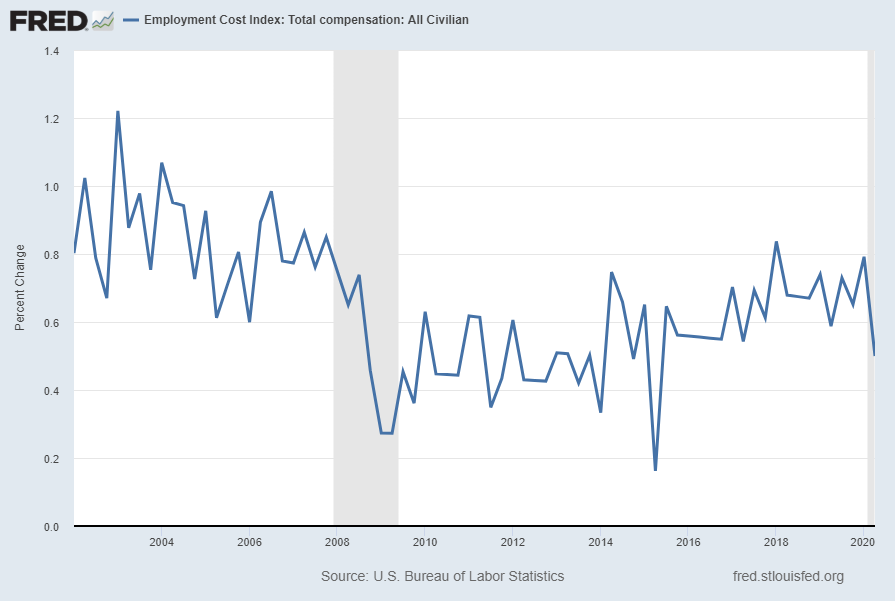
Compensation costs for civilian workers increased 0.5 percent, seasonally adjusted, for the 3-month period ending in June 2020, the U.S. Bureau of Labor Statistics reported today. Wages and salaries increased 0.4 percent and benefit costs increased 0.8 percent from March 2020. (See tables A, 1, 2, and 3.)

also:

Compensation costs for civilian workers increased 2.7 percent for the 12-month period ending in June 2020 and also increased 2.7 percent in June 2019. Wages and salaries increased 2.9 percent over the year and also increased 2.9 percent for the 12-month period ending in June 2019. Benefit costs increased 2.2 percent for the 12-month period ending in June 2020. In June 2019, the increase was 2.3 percent. (See tables A, 4, 8, and 12.)

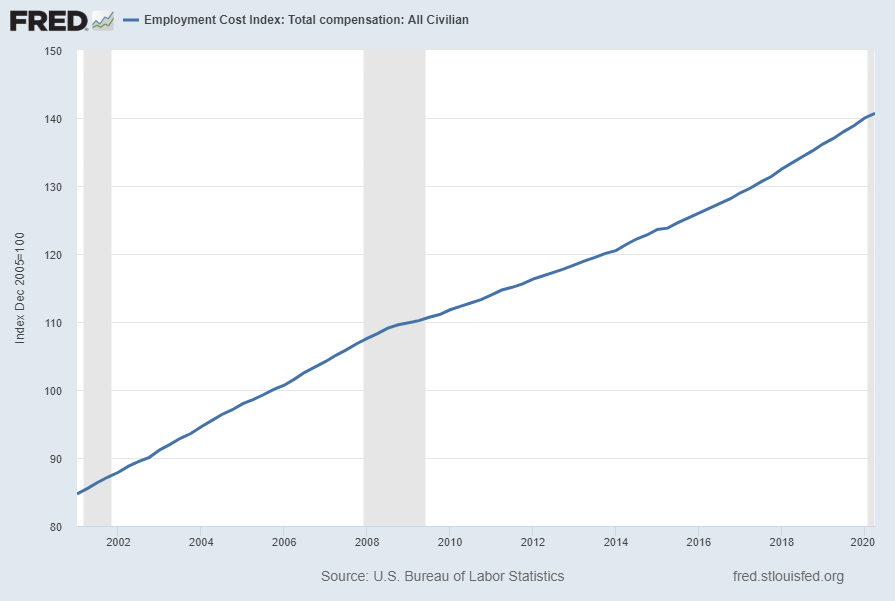
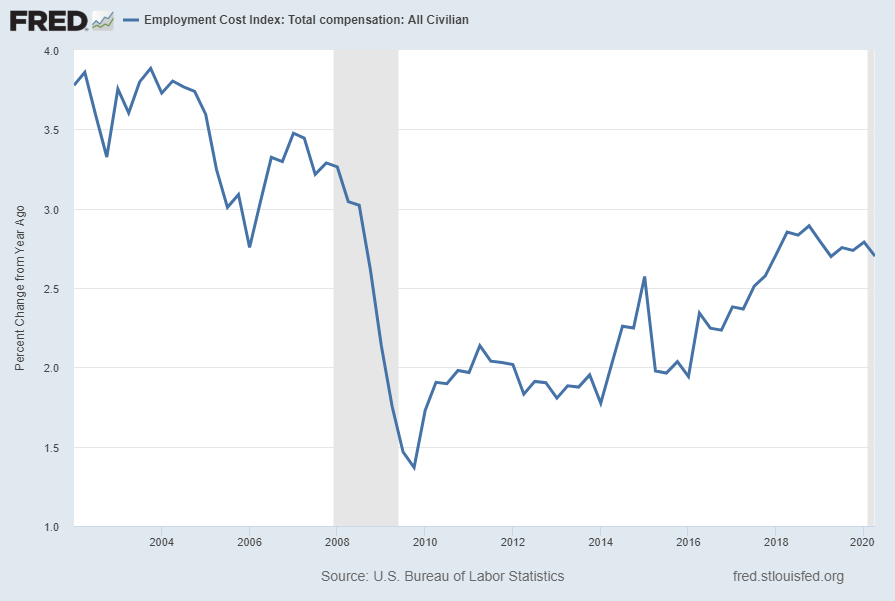
Below are three charts, updated on July 31, 2020 that depict various aspects of the ECI, which is seasonally adjusted (SA):

The first depicts the ECI, with a value of 140.7:

ECIALLCIV

source: US. Bureau of Labor Statistics, Employment Cost Index: Total compensation: All Civilian [ECIALLCIV], retrieved from FRED, Federal Reserve Bank of St. Louis, accessed July 31, 2020: 
https://research.stlouisfed.org/fred2/series/ECIALLCIV/

The second chart depicts the ECI on a “Percent Change from Year Ago” basis, with a value of 2.7%:

ECIALLCIV Percent Change From Year Ago

The third chart depicts the ECI on a “Percent Change” (from last quarter) basis, with a value of .5%:

ECIALLCIV Percent Change

_________

I post various indicators and indices because I believe they should be carefully monitored.  However, as those familiar with this site are aware, I do not necessarily agree with what they depict or imply.

_____

The Special Note summarizes my overall thoughts about our economic situation

SPX at 3238.26 as this post is written

Velocity Of Money – Charts Updated Through July 30, 2020

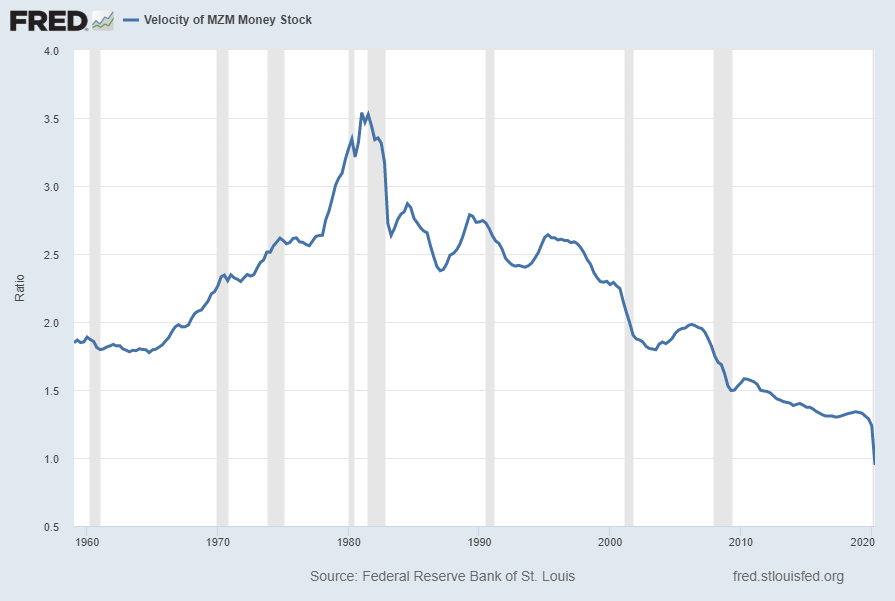
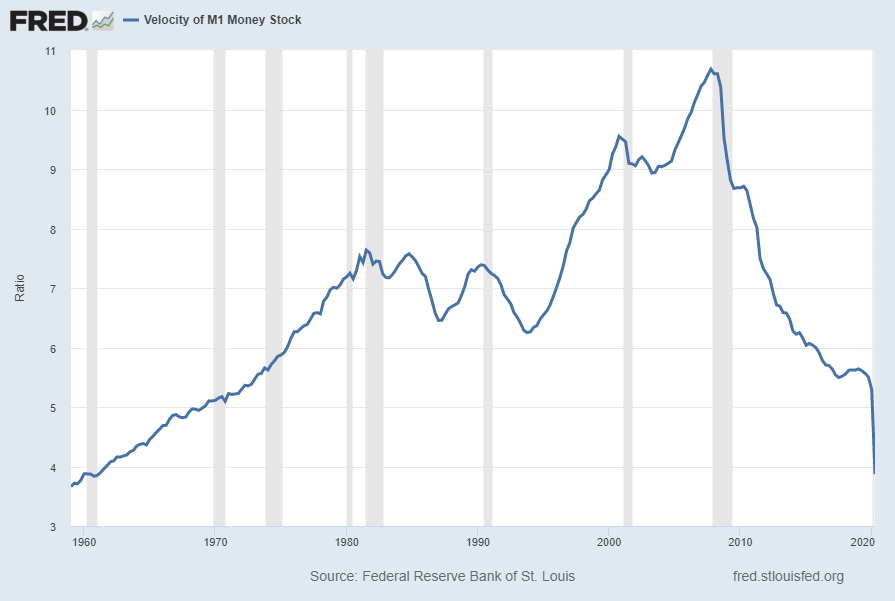
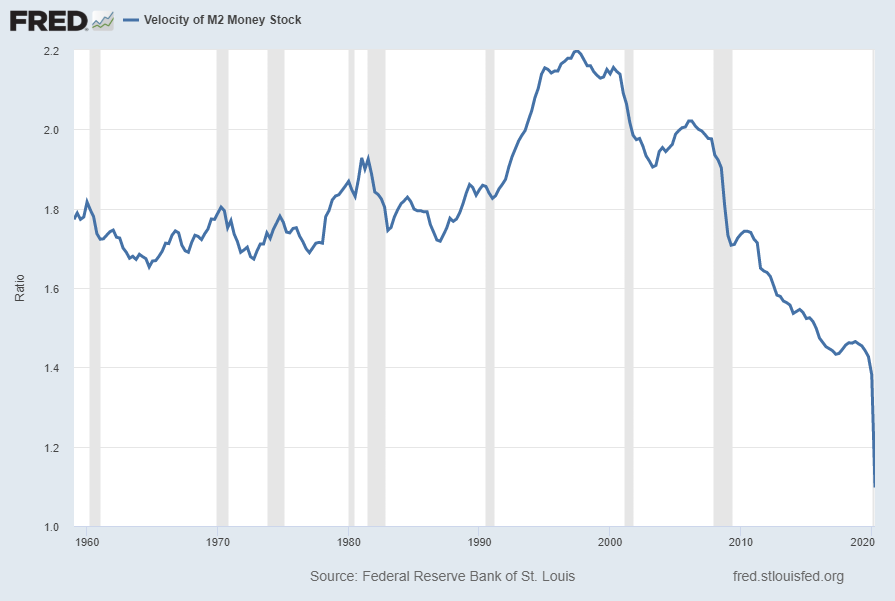
Here are three charts from the St. Louis Fed depicting the velocity of money in terms of the MZM, M1 and M2 money supply measures.

All charts reflect quarterly data through the 2nd quarter of 2020, and were last updated as of July 30, 2020.

Velocity of MZM Money Stock, current value = .949:

MZMV

Data Source: FRED, Federal Reserve Economic Data, Federal Reserve Bank of St. Louis; accessed July 31, 2020: 
http://research.stlouisfed.org/fred2/series/MZMV

Velocity of M1 Money Stock, current value = 3.872:

M1V

Data Source: FRED, Federal Reserve Economic Data, Federal Reserve Bank of St. Louis; accessed July 31, 2020: 
http://research.stlouisfed.org/fred2/series/M1V

Velocity of M2 Money Stock, current value = 1.097:

M2V

Data Source: FRED, Federal Reserve Economic Data, Federal Reserve Bank of St. Louis; accessed July 31, 2020: 
http://research.stlouisfed.org/fred2/series/M2V

_________

I post various indicators and indices because I believe they should be carefully monitored.  However, as those familiar with this site are aware, I do not necessarily agree with what they depict or imply.

_____

The Special Note summarizes my overall thoughts about our economic situation

SPX at 3246.22 as this post is written

Another Recession Probability Indicator – Updated Through Q1 2020

Each month I have been highlighting various estimates of U.S. recession probabilities.  The latest update was that of July 8, 2020, titled “Recession Probability Models – July 2020.”

While I don’t agree with the methodologies employed or the probabilities of impending economic weakness as depicted by these and other estimates, I do believe that the results of these models and estimates should be monitored.

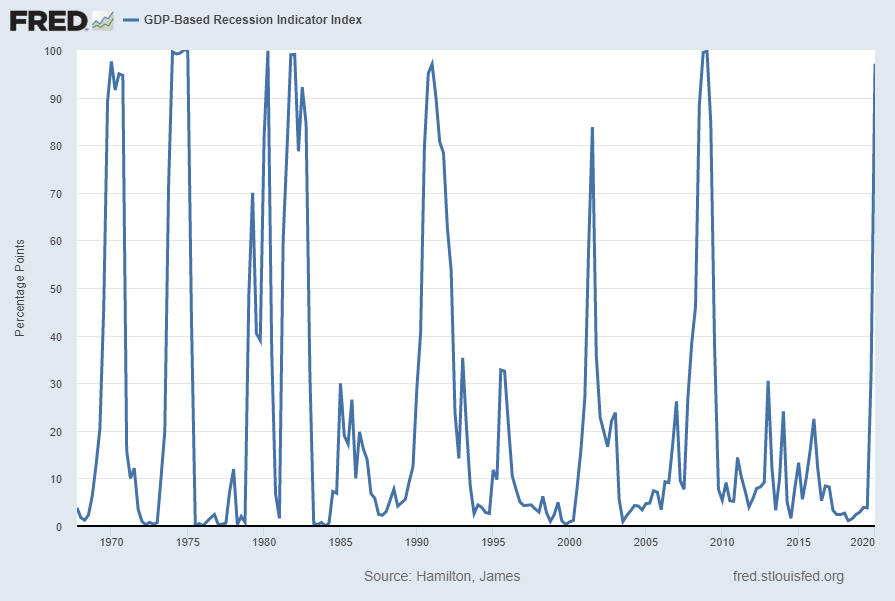
Another probability of recession is provided by James Hamilton, and it is titled “GDP-Based Recession Indicator Index.”  A description of this index, as seen in FRED:

This index measures the probability that the U.S. economy was in a recession during the indicated quarter. It is based on a mathematical description of the way that recessions differ from expansions. The index corresponds to the probability (measured in percent) that the underlying true economic regime is one of recession based on the available data. Whereas the NBER business cycle dates are based on a subjective assessment of a variety of indicators that may not be released until several years after the event , this index is entirely mechanical, is based solely on currently available GDP data and is reported every quarter. Due to the possibility of data revisions and the challenges in accurately identifying the business cycle phase, the index is calculated for the quarter just preceding the most recently available GDP numbers. Once the index is calculated for that quarter, it is never subsequently revised. The value at every date was inferred using only data that were available one quarter after that date and as those data were reported at the time.

If the value of the index rises above 67% that is a historically reliable indicator that the economy has entered a recession. Once this threshold has been passed, if it falls below 33% that is a reliable indicator that the recession is over.

Additional reference sources for this index and its construction can be seen in the Econbrowser post of February 14, 2016 titled “Recession probabilities” as well as on the “The Econbrowser Recession Indicator Index” page.

Below is a chart depicting the most recent value of 97.10%, for the first quarter of 2020, last updated on July 30, 2020 (after the July 30, 2020 Gross Domestic Product, Second Quarter 2020 (Advance Estimate) and Annual Update):

GDP-Based Recession Indicator Index

source:  Hamilton, James, GDP-Based Recession Indicator Index [JHGDPBRINDX], retrieved from FRED, Federal Reserve Bank of St. Louis on July 30, 2020: 
https://research.stlouisfed.org/fred2/series/JHGDPBRINDX

_________

I post various indicators and indices because I believe they should be carefully monitored.  However, as those familiar with this site are aware, I do not necessarily agree with what they depict or imply.

_____

The Special Note summarizes my overall thoughts about our economic situation

SPX at 3246.22 as this post is written

Thursday, July 30, 2020

Jerome Powell’s July 29, 2020 Press Conference – Notable Aspects

On Wednesday, July 29, 2020 FOMC Chairman Jerome Powell gave his scheduled July 2020 FOMC Press Conference. (link of video and related materials)

Below are Jerome Powell’s comments I found most notable – although I don’t necessarily agree with them – in the order they appear in the transcript.  These comments are excerpted from the “Transcript of Chairman Powell’s Press Conference“ (preliminary)(pdf) of July 29, 2020, with the accompanying “FOMC Statement.”

From Chairman Powell’s opening comments:

In recent months, economic activity picked up as the economy began to reopen.  Many businesses opened their doors, factories restarted production, and more people left their homes to engage in various activities.  As a result, household spending looks to have recovered about half of its earlier decline, although spending for services such as air travel and hotels has shown much less of a pick-up.  The recovery in household spending also likely owes to federal stimulus payments and expanded unemployment benefits, which provided substantial and timely support to household incomes.  In contrast, indicators of business fixed investment have yet to show a recovery.  Even with the improved economic news in May and June, overall activity remains well below its level before the pandemic, and the contraction in real GDP in the second quarter will likely be the largest on record.

Jerome Powell’s responses as indicated to the various questions:

JAMES POLITI. Hi there, James Politi with the Financial Times. Chair Powell, the Fed today decided to extend dollar liquidity swap lines with a number of central banks around the world. Why was that important for the Fed? And how concerned are you about dollar shortages persisting for a time through the pandemic? 

CHAIR POWELL. So our dollar swap lines, we introduced those back at the beginning of this episode after the pandemic made itself present. And dollar funding markets were in very difficult shape at the time. And the introduction of the swap lines has really restored dollar funding markets around the world to fairly normal levels of activity. And so they kind of served their purpose. But we extended them I guess yesterday morning, really to facilitate planning by other central banks, and just so people will know that those facilities are still there. We want them to remain in place and be available as long as they are needed. And since, you know, the crisis and the economic fallout from the pandemic are far from over, we’re going to leave those in place for the time being. And we’ll leave them in place until we’re confident that they’re no longer needed. There’s nothing that’s going on in the market right now that raises any concerns. It’s just we want them to be there as a backstop for markets.

also:

NICK TIMIRAOS. Yeah. Chair Powell, you have described your asset purchase objective as stabilizing markets. And with markets having stabilized, aren’t the asset purchases now doing more than addressing market function by supporting your macroeconomic objectives? The other question I have is, what is your strategy going to be with respect to using asset purchases to support your macroeconomic objectives going forward? Thanks. 

CHAIR POWELL. So you’re right, the asset purchases in their current size really sprang from severe dysfunction in the Treasury and MBS markets at the beginning of the market reaction to the pandemic. And thanks to those purchases, we have substantially restored, not fully but substantially restored functioning markets. This is absolutely critical. That market is really part of the absolute bedrock of the global financial markets, and it’s essential that it work well, and it is doing so now. And we’ve always said though that we understand, accept and are fine with the fact that those purchases are also fostering a more accommodative stance of monetary policy which would tend to support macroeconomic outcomes. So it’s doing both, and you know, we’ve understood that for some time. It’s not — the programs are not structured exactly like the QE programs were in the last financial — in the aftermath of the last financial crisis. Those were more focused on buying longer-run securities. The current purchases are all across the maturity spectrum. Nonetheless, they are supporting accommodative financial conditions. I think it’s clear that that’s the case. In terms of our strategy, you know, that just remains to be seen. As you know, we spent a lot of time in meetings this year looking at the tools that we have to adjust our current stance of policy. We do feel that our current monetary policy stance is the appropriate one. You know, we cut rates close to zero right at the beginning, we ramped up asset purchases and those have really helped. And we gave forward guidance on both of those things which the markets appear to understand, and market pricing is consistent with those. So we think that our policy stance is a good one. We’re of course prepared to adjust that stance as appropriate, and when we deem it as appropriate to better foster achievement of our goals of course. 

also:

MICHAEL MCKEE. Mr. Chairman, I’m wondering what it is — you’ve talked a lot about using all of your tools and Governor Brainard talked about moving from support to accommodation. What it is you can actually do — you’ve lowered rates to zero. You’ve set up the lending programs. There hasn’t been much take up. And the tools you talk about are generally in service of keeping interest rates low where they already are. So unless you were to go to negative interest rates, I’m wondering what additional accommodation the Fed can bring. Or is it really up to the fiscal authorities at this point to rescue the economy, to add additional help for it? 

CHAIR POWELL. Right, so you’re right. We are committed to using our full range of tools to support the U.S. economy at this difficult time. And we will always remain committed in that sense. We feel like we have ways to further support the economy, certainly through our credit and liquidity facilities which are effectively unlimited. We can adjust those programs. We also can adjust our forward guidance. We can adjust our asset purchases. So there are things that we can do. We feel like we have the ability to do more. But I would not disagree with the importance of fiscal policy — with your statement about the importance of fiscal policy. Fiscal policy can address things that we can’t address if there are particular groups that need help that need direct monetary help, not a loan but an actual grant. As the PPP program showed, you can save a lot of businesses and a lot of jobs with those in a case where lending a company money might not be the right answer. The company might not want to take a loan out in order to pay workers who can’t work because there’s no business. So lending is a particular tool and we’re using it very aggressively. But fiscal policy is essential here, and I would say again, Congress’s action early in the pandemic, historically large by any standard around the world and certainly by U.S. standards. It’s really helping now. It’s really helping. It’s going to stand up very well to scrutiny down the years. This Congress’s very fast and very open-handed response, I think has really helped. And I think — I know that, as I’ve said, very likely more will be needed from all of us, and I see Congress negotiating now over a new package. And I think that’s a good thing.

also:

VICTORIA GUIDA. Hi, Victoria Guida with Politico. Thanks for taking my question. I wanted to ask about the 13(3) facilities. You all have used your emergency authority to buy assets that you can’t directly buy, like corporate bonds, ETFs. So I was just wondering, what is the scope of your authority under 13(3)? What type of assets are you allowed to buy? Could you buy equities through an SPV for example? 

CHAIR POWELL. You know, we haven’t looked at that and we have no intention. We haven’t done any work or thought about buying equities. But you know, we’re bound by the provisions of 13(3) which requires that we make, you know, facilities, programs and facilities have broad applicability. Meaning we have to have — it can’t just be focused on one entity. You know, it has to be a broad group of entities. There’s a lot in 13(3) about the solvency of the borrowers. You know, remember, it was rewritten or amended after the financial crisis, and it was written in a way that was meant to make it challenging to bail out large financial institutions. There was a lot in there to make sure that, you know, that they were going to be solvent, things like that. So we have to meet those requirements. You know, we haven’t looked and tried to say what can we buy, and you know, let’s make a complete list. You know, we felt that using these facilities that we could buy corporate bonds and municipal bonds too. 

VICTORIA GUIDA. So I just — sorry, just to follow up really quickly. So is it generally supposed to be primarily directed at debt instruments since you talked about borrowers?

CHAIR POWELL. The statute doesn’t say that, but yeah, you could read the statute that way if you want. Honestly, we haven’t tried to push it to, you know, what’s the theoretical limit of it. I mean, I think clearly it’s supposed to replace lending, you know. That’s really what you’re doing. You’re stepping to provide credit at times when the market has stopped functioning. That’s fundamentally what you’re doing with 13(3). And so I think you’ve got to sort of work within that framework.

_____

_____

The Special Note summarizes my overall thoughts about our economic situation

SPX at 3245.59 as this post is written 
Real GDP Chart Since 1947 With Trendline – 2nd Quarter 2020

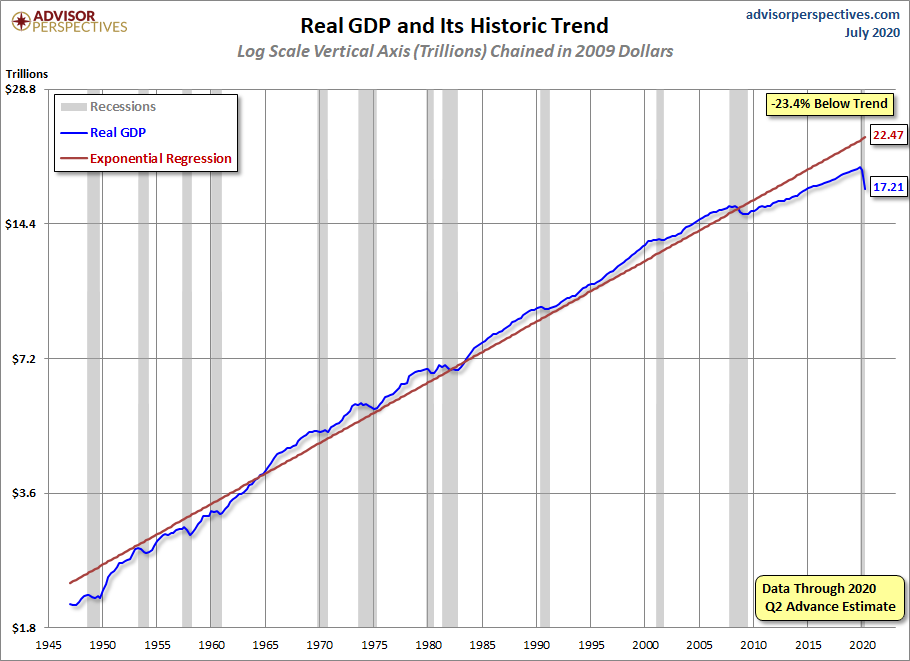
For reference purposes, below is a chart from the Advisor Perspectives’ post of July 30, 2020 titled “Q2 GDP Advance Estimate: Real GDP at -32.9%” reflecting Real GDP, with a trendline, as depicted.  This chart incorporates the Gross Domestic Product, Second Quarter 2020 (Advance Estimate) and Annual Update of July 30, 2020:

Real GDP

_________

I post various indicators and indices because I believe they should be carefully monitored.  However, as those familiar with this site are aware, I do not necessarily agree with what they depict or imply.

_____

The Special Note summarizes my overall thoughts about our economic situation

SPX at 3244.19 as this post is written
Wednesday, July 29, 2020

Chicago Fed National Financial Conditions Index (NFCI)

The St. Louis Fed’s Financial Stress Index (STLFSI2) is one index that is supposed to measure stress in the financial system.  Its reading as of the July 23, 2020 update (reflecting data through July 17, 2020) is -.1726.

Of course, there are a variety of other measures and indices that are supposed to measure financial stress and other related issues, both from the Federal Reserve as well as from private sources.

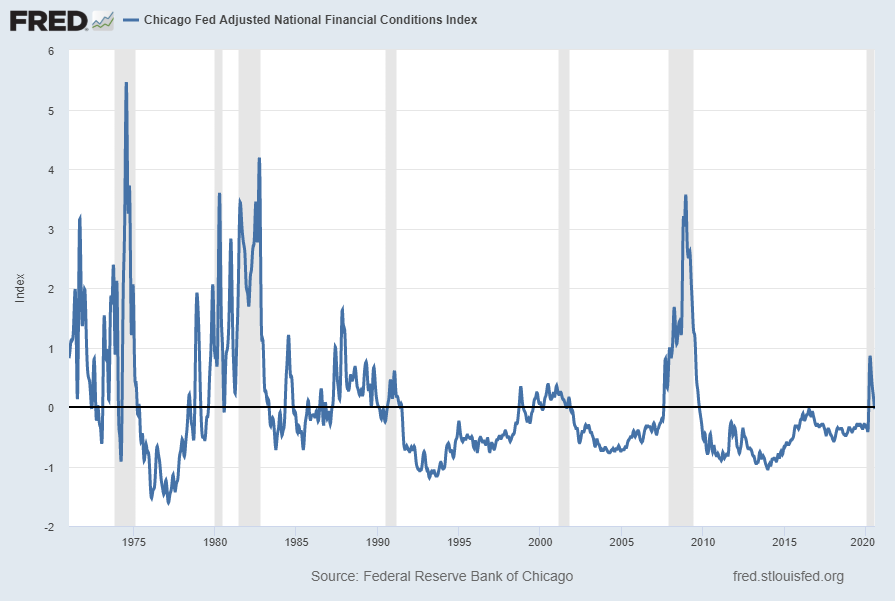
Two other indices that I regularly monitor include the Chicago Fed National Financial Conditions Index (NFCI) as well as the Chicago Fed Adjusted National Financial Conditions Index (ANFCI).

Here are summary descriptions of each, as seen in FRED:

The National Financial Conditions Index (NFCI) measures risk, liquidity and leverage in money markets and debt and equity markets as well as in the traditional and “shadow” banking systems. Positive values of the NFCI indicate financial conditions that are tighter than average, while negative values indicate financial conditions that are looser than average.

The adjusted NFCI (ANFCI). This index isolates a component of financial conditions uncorrelated with economic conditions to provide an update on how financial conditions compare with current economic conditions.

For further information, please visit the Federal Reserve Bank of Chicago’s web site:

http://www.chicagofed.org/webpages/publications/nfci/index.cfm

Below are the most recently updated charts of the NFCI and ANFCI, respectively.

The NFCI chart below was last updated on July 29, 2020 incorporating data from January 8, 1971 through July 24, 2020, on a weekly basis.  The July 24 value is -.50:

NFCI

Data Source: FRED, Federal Reserve Economic Data, Federal Reserve Bank of St. Louis; accessed July 29, 2020:  
http://research.stlouisfed.org/fred2/series/NFCI

The ANFCI chart below was last updated on July 29, 2020 incorporating data from January 8, 1971 through July 24, 2020, on a weekly basis.  The July 24 value is -.03:

ANFCI

Data Source: FRED, Federal Reserve Economic Data, Federal Reserve Bank of St. Louis; accessed July 29, 2020:  
http://research.stlouisfed.org/fred2/series/ANFCI

_________

I post various indicators and indices because I believe they should be carefully monitored.  However, as those familiar with this site are aware, I do not necessarily agree with what they depict or imply.

_____

The Special Note summarizes my overall thoughts about our economic situation

SPX at 3240.40 as this post is written
Monday, July 27, 2020

Durable Goods New Orders – Long-Term Charts Through June 2020

Many people place emphasis on Durable Goods New Orders as a prominent economic indicator and/or leading economic indicator.

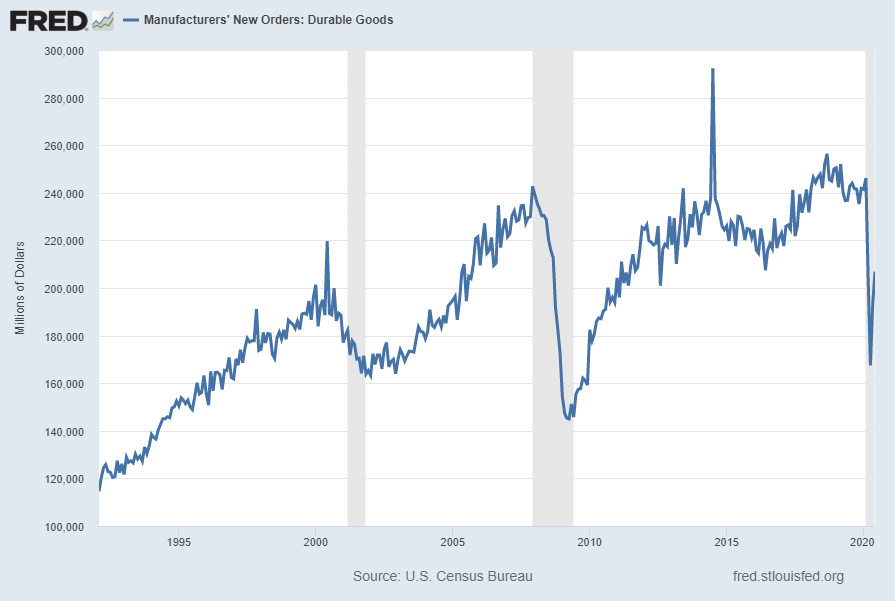
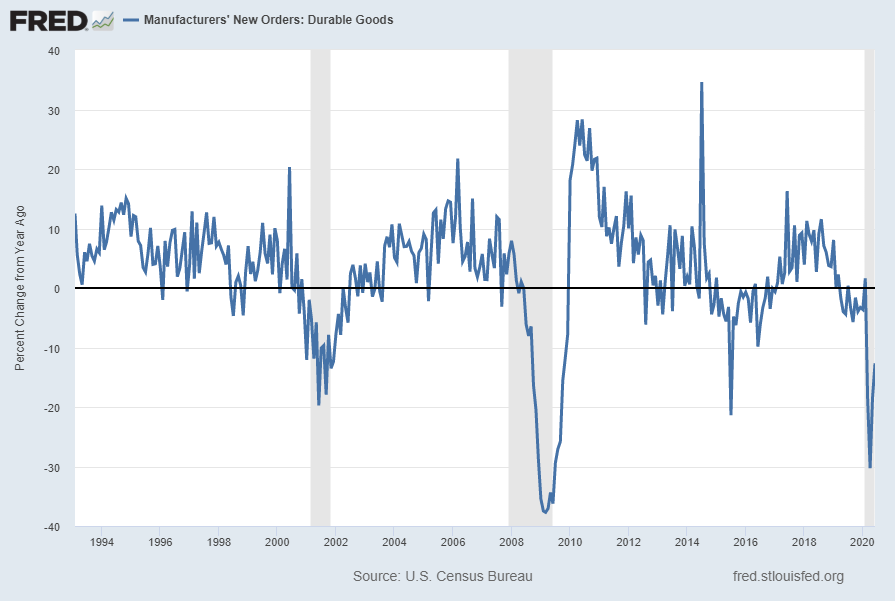
For reference, below are two charts depicting this measure.

First, from the St. Louis Fed site (FRED), a chart through June 2020, updated on July 27, 2020. This value is $206,873 ($ Millions):

(click on charts to enlarge images)

Durable Goods New Orders

Second, here is the chart depicting this measure on a “Percentage Change from a Year Ago” basis, with a last value of -12.7%:

Durable Goods New Orders Percent Change From Year Ago

Data Source: FRED, Federal Reserve Economic Data, Federal Reserve Bank of St. Louis: Manufacturers’ New Orders:  Durable Goods [DGORDER]; U.S. Department of Commerce: Census Bureau; accessed July 27, 2020; 
http://research.stlouisfed.org/fred2/series/DGORDER

_________

I post various indicators and indices because I believe they should be carefully monitored.  However, as those familiar with this site are aware, I do not necessarily agree with what they depict or imply.

_____

The Special Note summarizes my overall thoughts about our economic situation

SPX at 3233.47 as this post is written