Pages

Friday, July 29, 2022

U.S. Deflation Probability Chart Through July 2022

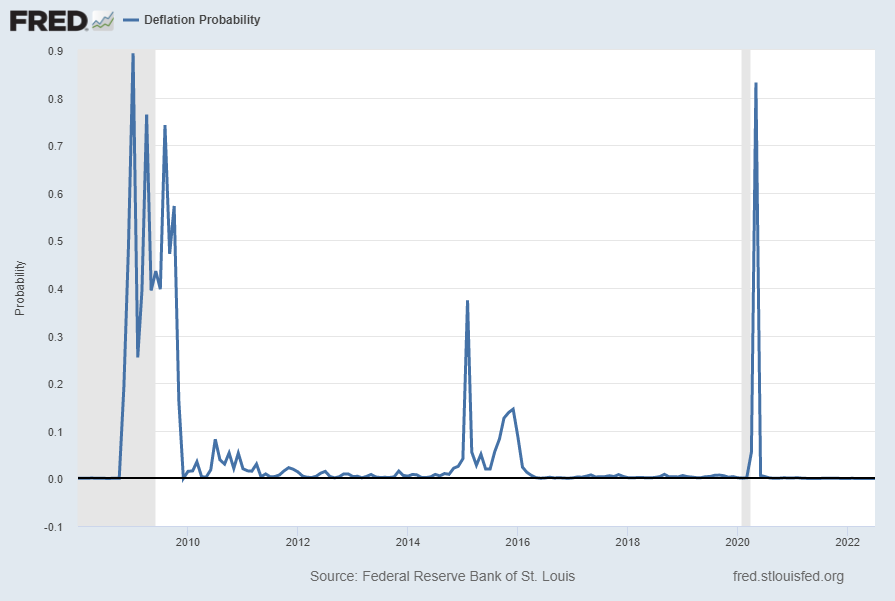
For reference, below is a chart of the St. Louis Fed Price Pressures Measures – Deflation Probability [FRED STLPPMDEF] through July 2022.

While I do not necessarily agree with the current readings of the measure, I view this as a proxy of U.S. deflation probability.

A description of this measure, as seen in FRED:

This series measures the probability that the personal consumption expenditures price index (PCEPI) inflation rate (12-month changes) over the next 12 months will fall below zero.

The chart, on a monthly basis from January 1990 – July 2022, with a last reading of .00001, last updated on July 29, 2022:

Deflation Probability

Here is this same U.S. deflation probability measure since 2008:

Deflation Probability since 2008

source:  Federal Reserve Bank of St. Louis, Deflation Probability [STLPPMDEF], retrieved from FRED, Federal Reserve Bank of St. Louis; accessed July 29, 2022: https://fred.stlouisfed.org/series/STLPPMDEF

_________

I post various economic indicators and indices because I believe they should be carefully monitored.  However, as those familiar with this site are aware, I do not necessarily agree with what they depict or imply.

_____

The Special Note summarizes my overall thoughts about our economic situation

SPX at 4138.79 as this post is written

Consumer Confidence Surveys – As Of July 29, 2022

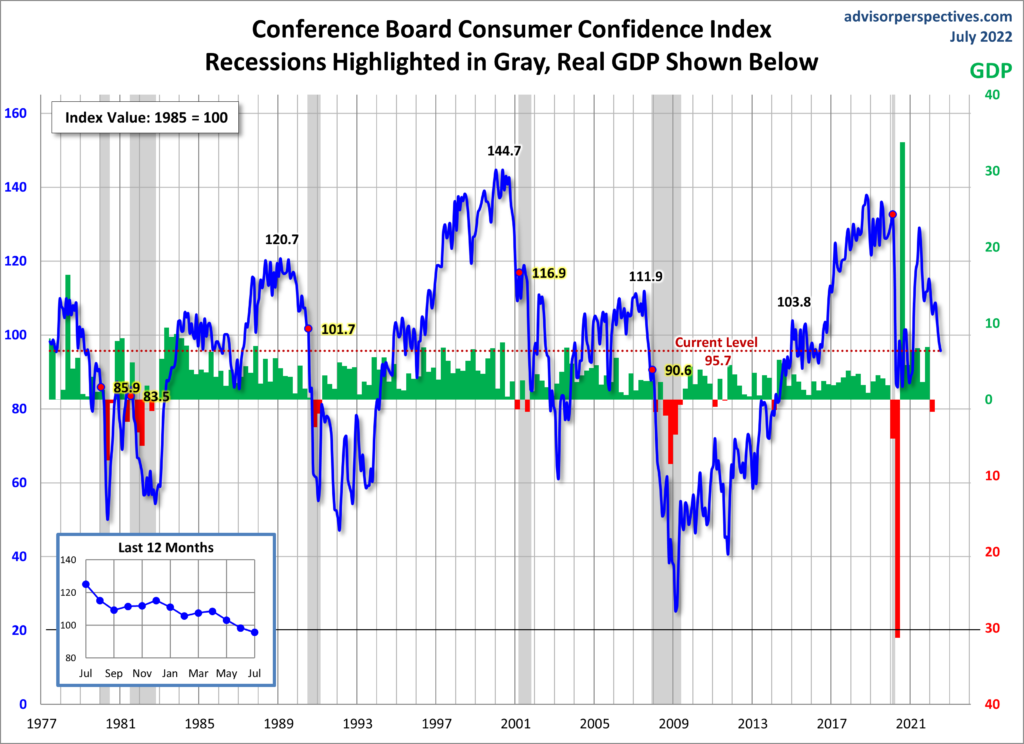
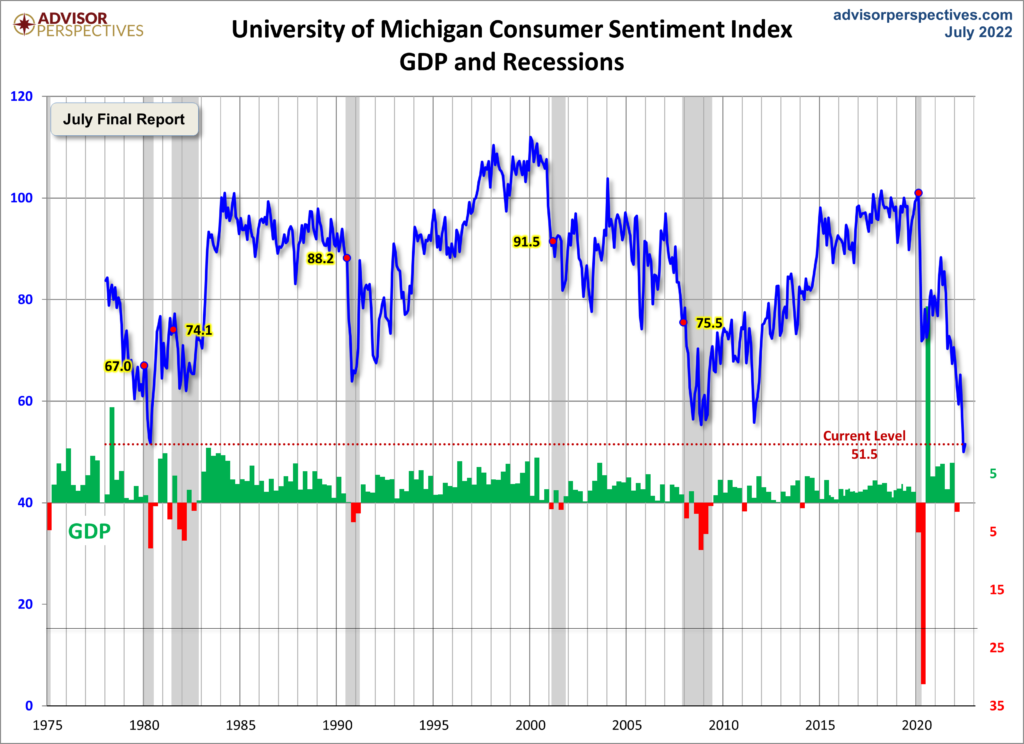
Advisor Perspectives had a post of July 29, 2022 (“Michigan Consumer Sentiment: Mostly Unchanged for July Final“) that displays the latest Conference Board Consumer Confidence and University of Michigan Consumer Sentiment Index charts.  They are presented below:

(click on charts to enlarge images)

Conference Board Consumer Confidence 95.7

University of Michigan Consumer Sentiment Index 51.5

While I don’t believe that confidence surveys should be overemphasized, I find these readings and trends to be notable, especially in light of a variety of other highly disconcerting measures highlighted throughout this site.

_____

The Special Note summarizes my overall thoughts about our economic situation

SPX at 4120.87 as this post is written

Employment Cost Index (ECI) – June 2022

While the concept of Americans’ incomes can be defined in a number of ways, many prominent measures continue to show disconcerting trends.

One prominent measure is the Employment Cost Index (ECI).

Here is a description from the BLS document titled “The Employment Cost Index:  what is it?“:

The Employment Cost Index (ECI) is a quarterly measure of the change in the price of labor, defined as compensation per employee hour worked. Closely watched by many economists, the ECI is an indicator of cost pressures within companies that could lead to price inflation for finished goods and services. The index measures changes in the cost of compensation not only for wages and salaries, but also for an extensive list of benefits. As a fixed-weight, or Laspeyres, index, the ECI controls for changes occurring over time in the industrial-occupational composition of employment.

On July 29, 2022, the latest ECI report was released.  Here are two excerpts from the BLS release titled “Employment Cost Index – June 2022“:

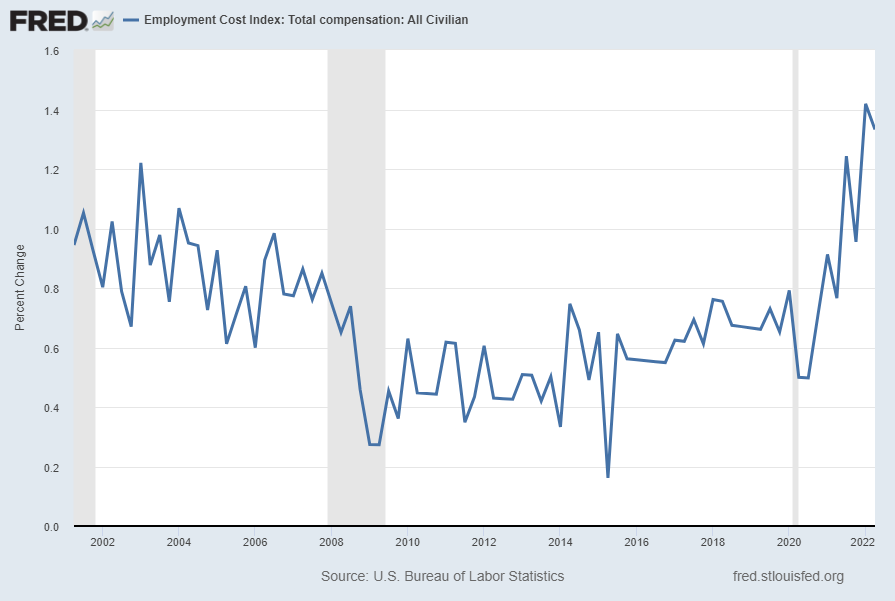
Compensation costs for civilian workers increased 1.3 percent, seasonally adjusted, for the 3-month period ending in June 2022, the U.S. Bureau of Labor Statistics reported today. Wages and salaries increased 1.4 percent and benefit costs increased 1.2 percent from March 2022. (See tables A, 1,2, and 3.)

also:

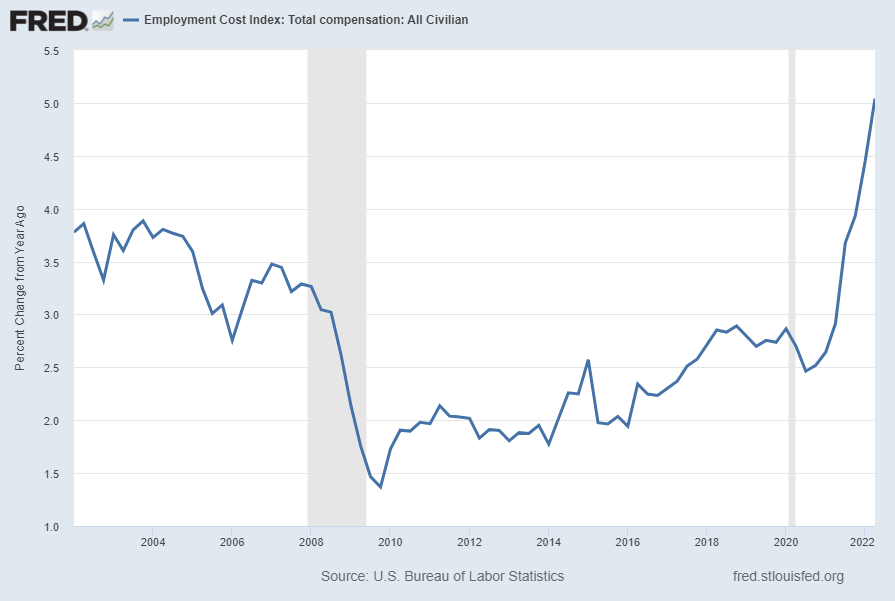
Compensation costs for civilian workers increased 5.1 percent for the 12-month period ending in June 2022 and increased 2.9 percent in June 2021. Wages and salaries increased 5.3 percent for the 12-month period ending in June 2022 and increased 3.2 percent for the 12-month period ending in June 2021. Benefit costs increased 4.8 percent over the year and increased 2.2 percent for the 12-month period ending in June 2021. (See tables A, 4, 8, and 12.)

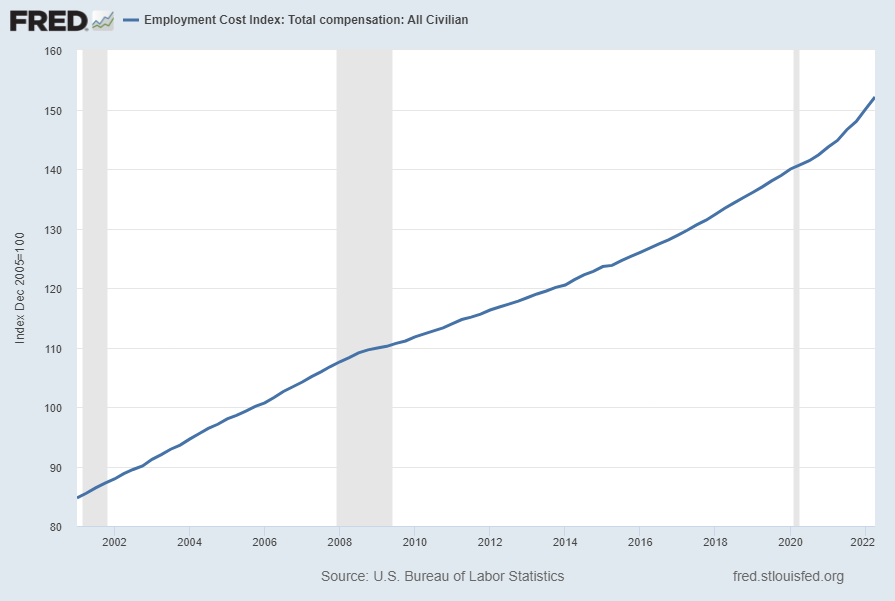
Below are three charts, updated on July 29, 2022 that depict various aspects of the ECI, which is seasonally adjusted (SA):

The first depicts the ECI, with a value of 152.1:

Employment Cost Index (ECI)

source: US. Bureau of Labor Statistics, Employment Cost Index: Total compensation: All Civilian [ECIALLCIV], retrieved from FRED, Federal Reserve Bank of St. Louis, accessed July 29, 2022: 
https://research.stlouisfed.org/fred2/series/ECIALLCIV/

The second chart depicts the ECI on a “Percent Change from Year Ago” basis, with a value of 5.0%:

Employment Cost Index Percent Change From Year Ago

The third chart depicts the ECI on a “Percent Change” (from last quarter) basis, with a value of 1.3%:

Employment Cost Index (ECI) Percent Change

_________

I post various indicators and indices because I believe they should be carefully monitored.  However, as those familiar with this site are aware, I do not necessarily agree with what they depict or imply.

_____

The Special Note summarizes my overall thoughts about our economic situation

SPX at 4113.85 as this post is written

Another Recession Probability Indicator – Through Q1 2022

Each month I have been highlighting various estimates of U.S. recession probabilities.  The latest update was that of July 13, 2022, titled “Recession Probability Models – July 2022.”

While I don’t agree with the methodologies employed or the probabilities of impending economic weakness as depicted by these and other estimates, I do believe that the results of these models and estimates should be monitored.

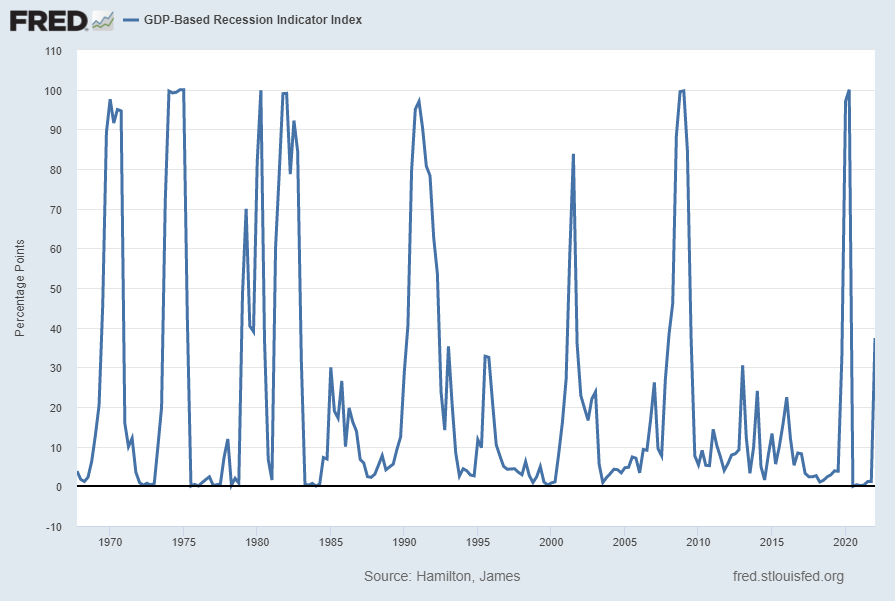
Another probability of recession is provided by James Hamilton, and it is titled “GDP-Based Recession Indicator Index.”  A description of this index, as seen in FRED:

This index measures the probability that the U.S. economy was in a recession during the indicated quarter. It is based on a mathematical description of the way that recessions differ from expansions. The index corresponds to the probability (measured in percent) that the underlying true economic regime is one of recession based on the available data. Whereas the NBER business cycle dates are based on a subjective assessment of a variety of indicators that may not be released until several years after the event , this index is entirely mechanical, is based solely on currently available GDP data and is reported every quarter. Due to the possibility of data revisions and the challenges in accurately identifying the business cycle phase, the index is calculated for the quarter just preceding the most recently available GDP numbers. Once the index is calculated for that quarter, it is never subsequently revised. The value at every date was inferred using only data that were available one quarter after that date and as those data were reported at the time.

If the value of the index rises above 67% that is a historically reliable indicator that the economy has entered a recession. Once this threshold has been passed, if it falls below 33% that is a reliable indicator that the recession is over.

Additional reference sources for this index and its construction can be seen in the Econbrowser post of February 14, 2016 titled “Recession probabilities” as well as on the “The Econbrowser Recession Indicator Index” page.

Below is a chart depicting the most recent value of 37.40000% for the first quarter of 2022, last updated on July 28, 2022 (after the July 28, 2022 Gross Domestic Product, Second Quarter 2022 (Advance Estimate):

GDP-Based Recession Indicator Index

source:  Hamilton, James, GDP-Based Recession Indicator Index [JHGDPBRINDX], retrieved from FRED, Federal Reserve Bank of St. Louis; accessed July 29, 2022: 
https://research.stlouisfed.org/fred2/series/JHGDPBRINDX

_________

I post various indicators and indices because I believe they should be carefully monitored.  However, as those familiar with this site are aware, I do not necessarily agree with what they depict or imply.

_____

The Special Note summarizes my overall thoughts about our economic situation

SPX at 4104.82 as this post is written

Thursday, July 28, 2022

Jerome Powell’s July 27, 2022 Press Conference – Notable Aspects

On Wednesday, July 27, 2022 FOMC Chair Jerome Powell gave his scheduled July 2022 FOMC Press Conference. (link of video and related materials)

Below are Jerome Powell’s comments I found most notable – although I don’t necessarily agree with them – in the order they appear in the transcript.  These comments are excerpted from the “Transcript of Chairman Powell’s Press Conference“ (preliminary)(pdf) of July 27, 2022, with the accompanying “FOMC Statement.”

Excerpts from Chairman Powell’s opening comments:

Good afternoon.  My colleagues and I are strongly committed to bringing inflation back down, and we are moving expeditiously to do so.  We have both the tools we need and the resolve it will take to restore price stability on behalf of American families and businesses.  The economy and the country have been through a lot over the past two-and-a-half years and have proved resilient.  It is essential that we bring inflation down to our 2 percent goal if we are to have a sustained period of strong labor market conditions that benefit all.  

From the standpoint of our Congressional mandate to promote maximum employment and price stability, the current picture is plain to see: The labor market is extremely tight, and inflation is much too high.  Against this backdrop, today the FOMC raised its policy interest rate by 3/4 percentage point and anticipates that ongoing increases in the target range for the federal funds rate will be appropriate.  In addition, we are continuing the process of significantly reducing the size of our balance sheet, and I will have more to say about today’s monetary policy actions after briefly reviewing economic developments.  

Recent indicators of spending and production have softened.  Growth in consumer spending has slowed significantly, in part reflecting lower real disposable income and tighter financial conditions.  Activity in the housing sector has weakened, in part reflecting higher mortgage rates.  And after a strong increase in the first quarter, business fixed investment also looks to have declined in the second quarter.    

Excerpts of Jerome Powell’s responses as indicated to various questions:

COLBY SMITH. Thank you so much for taking our questions. Colby Smith with The Financial Times. As the Committee considers the policy path forward, how will it weigh the expected decline and headline inflation which might come as a result of the drop in commodity prices against the fact that we are likely to see some persistence in core readings in particular? And given that potential tension and signs of any kind of activity weakening here, how has the Committee’s thinking changed on how far into restrictive territory rates may need to go? 

CHAIR POWELL. So, I guess I’d start by saying we’ve been saying we would move expeditiously to get to the range of neutral. And I think we’ve done that now. We’re at 2.25 to 2.5 and that’s right in the range of what we think is neutral. So, the question is how are we thinking about the path forward. So, one thing that hasn’t changed– won’t change is that our focus is going to continue to be using our tools to bring demand back into better balance with supply in order to bring inflation back down. That will continue to be our overarching focus. We also said that we expect ongoing rate hikes will be appropriate. And that we’ll make decisions meeting by meeting. So, what are we going to be looking at? We’ll be looking at the incoming data as I mentioned, and that’ll start with economic activity. Are we seeing the slowdown that we– the slowdown in economic activity that we think we need? And there’s some evidence that we are at this time. Of course, we’ll be looking at labor market conditions. And we’ll be asking whether we see the alignment between supply and demand getting better, getting closer. Of course, we’ll be looking closely at inflation. You mentioned headline and core. Our mandate is for headline, of course, it’s not for core. But we look at core because core is actually a better indicator of headline. And of all inflation going forward. So, we’ll be looking at both. And we’ll be looking at those both really for what they’re saying for the outlook rather than just simply for what they say. But we’ll be asking. Do we see inflationary pressures declining? Do we see actual readings of inflation coming down? So in light of all that data, the question we’ll be asking is whether the stance of policy we have is sufficiently restrictive to bring inflation back down to our 2 percent target? And it’s also worth noting that these rate hikes have been large and they’ve come quickly. And it’s likely that their full effect has not been felt by the economy. So, there’s probably some additional tightening, significant additional tightening in the pipeline. So where are we going with this? I think the best– I think the Committee broadly feels that we need to get policy to at least to a moderately restrictive level. And maybe the best datapoint for that would be what we wrote down in our SEP at the June meeting, so I think the median for the end of this year, the median would have been between 3 and a quarter and 3 and a half. And then people wrote down 50 basis points higher than that for 2023. So that’s– even though that’s now six weeks old, I guess, that’s the most recent reading. Of course, we’ll update that reading at the September meeting in eight weeks. So that’s how we’re thinking about it. As I mentioned, as it relates to September, I said that another unusually large increase could be appropriate, but that’s not a decision we’re making now. It’s one that we’ll make based on the data we see. And we’re going to be making decisions meeting by meeting. We think it’s time to just go to a meeting by meeting basis and not provide the kind of clear guidance that we had provided on the weighted neutral.

also:

STEVE LIESMAN. Steve Liesman, CNBC. Thanks for taking my question, Mr. Chairman. Earlier this week, the president said we are not going to be in a recession. So I have two questions off of that. Do you share the President’s confidence in not being in a recession, and second, how would or would not a recession change policy? Is it a bright line, sir, where contraction of the economy would be a turning point in policy? Was there some amount of contraction of the economy the Committee would be willing to abide in its effort to reduce inflation? 

CHAIR POWELL. So, as I mentioned, we think it’s necessary to have growth slowdown. And growth is going to be slowing down this year for a couple of reasons. One of which is that you’re coming off of the very high growth of the reopening year of 2021. You’re also seeing tighter monetary policy. And you should see some slowing. We actually think we need a period of growth below potential, in order to create some slack so that the supply side can catch up. We also think that there will be, in all likelihood, some softening in labor market conditions. And those are things that we expect, and we think that they’re probably necessary if we were to have– to get inflation. If we were to be able to get inflation back down on the path to 2 percent and ultimately get there.

STEVE LIESMAN [INAUDIBLE] the question was whether you see a recession coming and how you might or might not change policy.

CHAIR POWELL. So, we’re going to be– again, we’re going to be focused on getting inflation back down. And we– as I’ve said on other occasions, price stability is really the bedrock of the economy. And nothing works in the economy without price stability. We can’t have a strong labor market without price stability for an extended period of time. We all want to get back to the kind of labor market we had before the pandemic where differences between racial and gender differences and that kind of thing were at historic minimums, where participation was high, where inflation was low. We want to get back to that. But that’s not happening. That’s not going to happen without restoring price stability. So, that’s something we see as something that we simply must do. And we think that we don’t see it as a trade off with the employment mandate. We see it as a way to facilitate the sustained achievement of the employment mandate in the longer term. 

also:

NEIL IRWIN. Thanks, Chair Powell. Neil Irwin from Axios. To build a little on what Steve was asking, do you believe the United States is currently in a recession? Will the GDP reading tomorrow affect that judgment one way or the other? And has your assessment of the risk of recession changed any in recent weeks? 

CHAIR POWELL. So, I do not think the U.S. is currently in a recession. And the reason is there are just too many areas of the economy that are performing too well. And of course, I would point to the labor market, in particular. As I mentioned, it’s true that growth is slowing. For reasons that we understand. Really the growth was extraordinarily high last year, 5 and a half percent. We would have expected growth to slow. There’s also more slowing going on now. But if you look at the labor market, you’ve got growth, I think payroll jobs averaging 450,000 per month? That’s a remarkably strong level for this state of affairs. The unemployment rate at near 50-year low at 3.6 percent. All of the wage measures that we track are running very strong. So this is a very strong labor market, and it’s just not consistent with– 2.7 million people hired in the first half of the year? It doesn’t make sense that the economy would be in recession with this kind of thing happening. So, I don’t think the U.S. economy’s in recession right now. 

also:

JEAN YUNG. Thank you, Mr. Chairman. Jean Yung with Market News. I wanted to ask about the balance sheet reduction program. It’s been working for a couple months now and in a different environment than the last time the Fed did it. What are you learning about how it’s working and how markets are reacting? And is reaching the minimum level of reserves needed in the system still several years away at the current pace? 

CHAIR POWELL. So we think it’s working fine. As you know, we tapered up into it. And in September, we’ll go to full strength. And the markets seem to have accepted it. By all assessments, the markets should be able to absorb this. And we expect that will be the case. So, I would say the plan is broadly on track. It’s a little bit slow to get going because some of these trades don’t settle for a bit of time. But it will be picking up steam. So I guess your second question was getting– the process of getting back down to the new equilibrium will take a while. And that time, it’s hard to be precise, but the model would suggest that it could be between two, two and a half years, that kind of thing. And this is a much faster pace than the last time. Balance sheet’s much bigger than it was. But we look at this carefully and we thought that this was the sensible pace. And we have no reason to think that it’s not. 

_____

_____

The Special Note summarizes my overall thoughts about our economic situation

SPX at 4051.08 as this post is written 

Chicago Fed National Financial Conditions Index (NFCI)

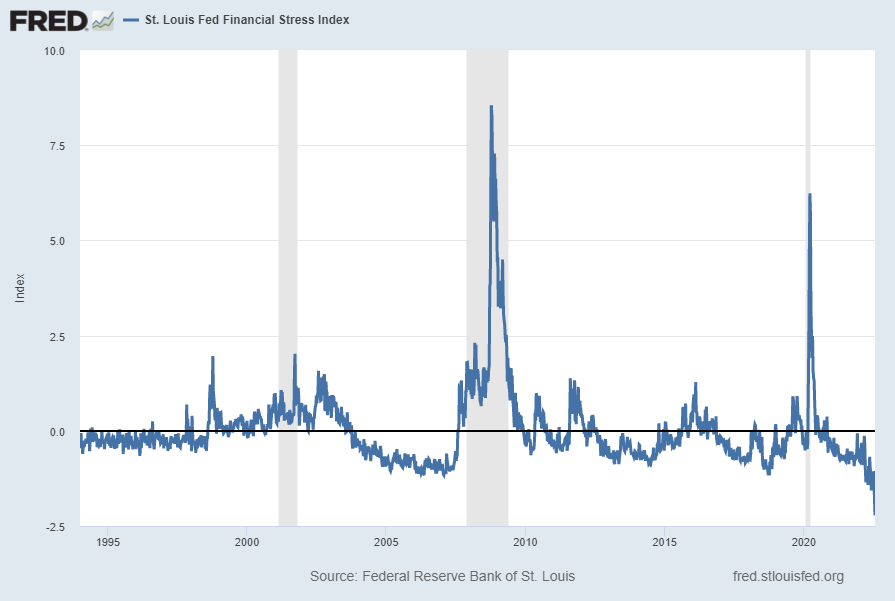
The St. Louis Fed’s Financial Stress Index (STLFSI3) is one index that is supposed to measure stress in the financial system. Its reading as of the July 28, 2022 update (reflecting data through July 22, 2022) is -2.2238:

STLFSI3

source: Federal Reserve Bank of St. Louis, St. Louis Fed Financial Stress Index [STLFSI3], retrieved from FRED, Federal Reserve Bank of St. Louis; accessed July 28, 2022: https://fred.stlouisfed.org/series/STLFSI3

Of course, there are a variety of other measures and indices that are supposed to measure financial stress and other related issues, both from the Federal Reserve as well as from private sources.

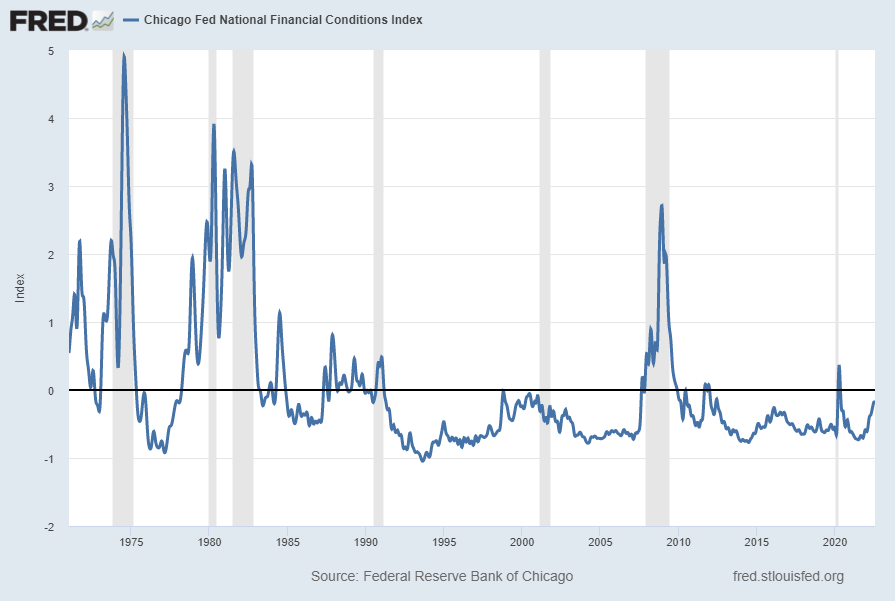
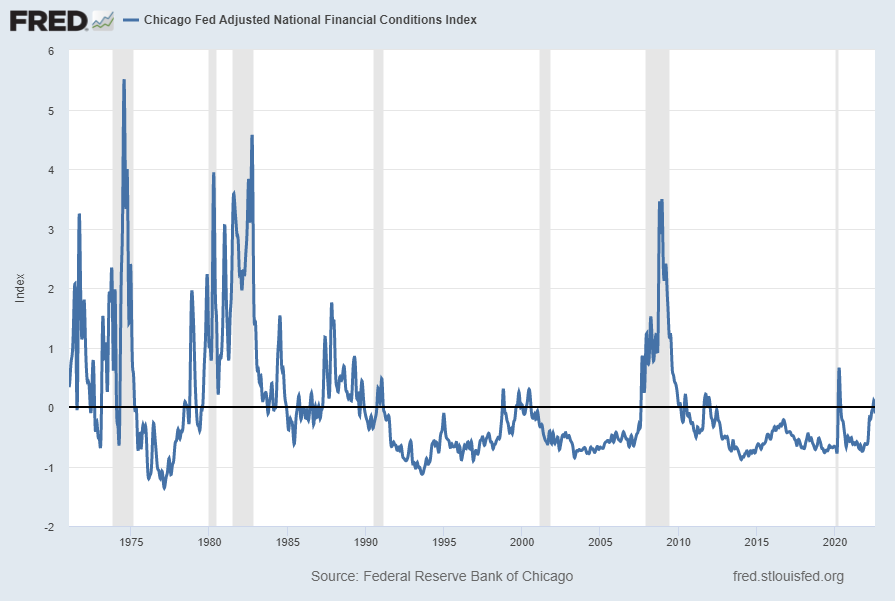
Two other indices that I regularly monitor include the Chicago Fed National Financial Conditions Index (NFCI) as well as the Chicago Fed Adjusted National Financial Conditions Index (ANFCI).

Here are summary descriptions of each, as seen in FRED:

The National Financial Conditions Index (NFCI) measures risk, liquidity and leverage in money markets and debt and equity markets as well as in the traditional and “shadow” banking systems. Positive values of the NFCI indicate financial conditions that are tighter than average, while negative values indicate financial conditions that are looser than average.

The adjusted NFCI (ANFCI). This index isolates a component of financial conditions uncorrelated with economic conditions to provide an update on how financial conditions compare with current economic conditions.

For further information, please visit the Federal Reserve Bank of Chicago’s web site:

http://www.chicagofed.org/webpages/publications/nfci/index.cfm

Below are the most recently updated charts of the NFCI and ANFCI, respectively.

The NFCI chart below was last updated on July 27, 2022 incorporating data from January 8, 1971 through July 22, 2022 on a weekly basis.  The July 22 value is -.20144:

NFCI -.20144

Data Source: FRED, Federal Reserve Economic Data, Federal Reserve Bank of St. Louis; accessed July 27, 2022:  
http://research.stlouisfed.org/fred2/series/NFCI

The ANFCI chart below was last updated on July 27, 2022 incorporating data from January 8, 1971 through July 22, 2022, on a weekly basis.  The July 22, 2022 value is -.10941:

ANFCI -.10941

Data Source: FRED, Federal Reserve Economic Data, Federal Reserve Bank of St. Louis; accessed July 27, 2022:  
http://research.stlouisfed.org/fred2/series/ANFCI

_________

I post various indicators and indices because I believe they should be carefully monitored.  However, as those familiar with this site are aware, I do not necessarily agree with what they depict or imply.

_____

The Special Note summarizes my overall thoughts about our economic situation

SPX at 3999.65 as this post is written
Velocity Of Money – Charts Updated Through July 28, 2022

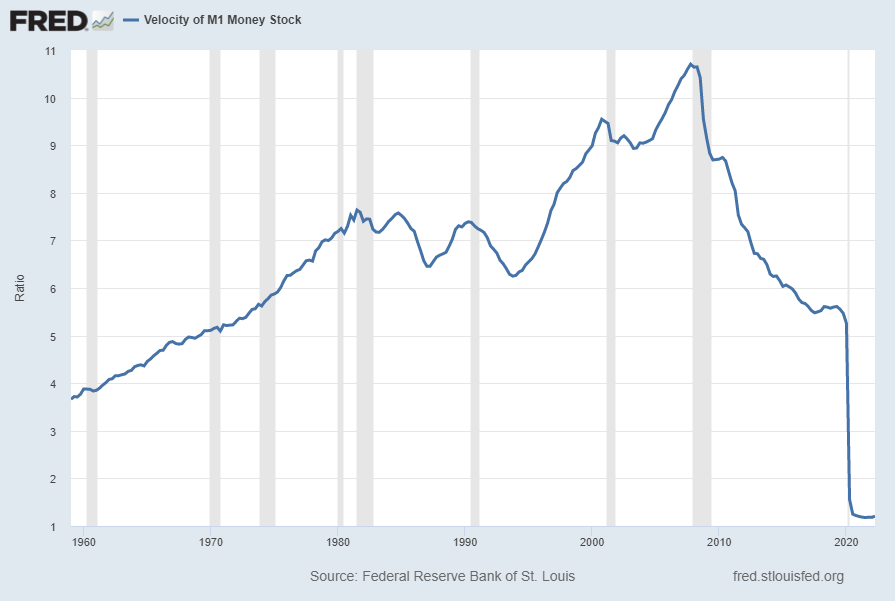
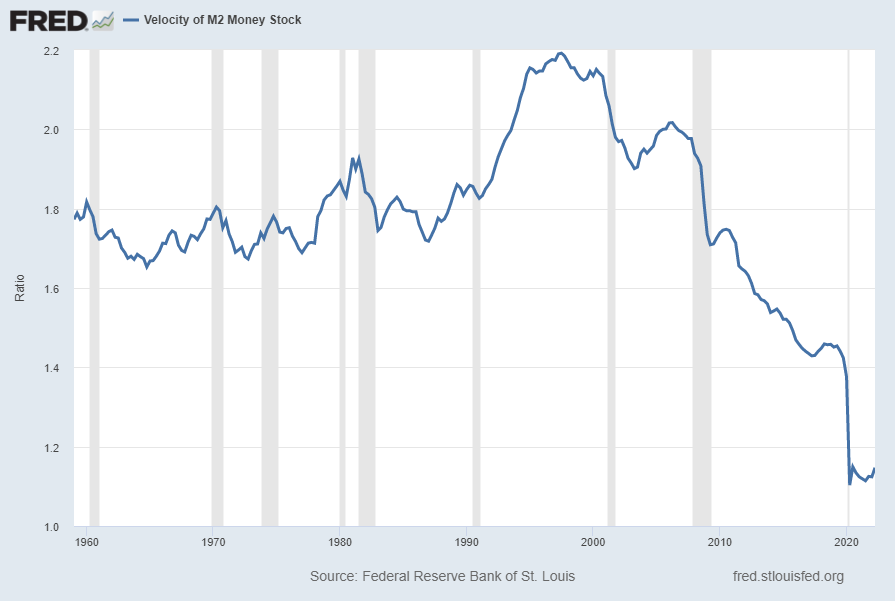
Here are two charts from the St. Louis Fed depicting the velocity of money in terms of the M1 and M2 money supply measures.

All charts reflect quarterly data through the 2nd quarter of 2022, and were last updated as of July 28, 2022.

Velocity of M1 Money Stock, current value = 1.207:

M1V 1.207

Data Source: FRED, Federal Reserve Economic Data, Federal Reserve Bank of St. Louis; accessed July 28, 2022: 
http://research.stlouisfed.org/fred2/series/M1V

Velocity of M2 Money Stock, current value = 1.147:

M2V 1.147

Data Source: FRED, Federal Reserve Economic Data, Federal Reserve Bank of St. Louis; accessed July 28, 2022: 
http://research.stlouisfed.org/fred2/series/M2V

_________

I post various indicators and indices because I believe they should be carefully monitored.  However, as those familiar with this site are aware, I do not necessarily agree with what they depict or imply.

_____

The Special Note summarizes my overall thoughts about our economic situation

SPX at 4030.05 as this post is written

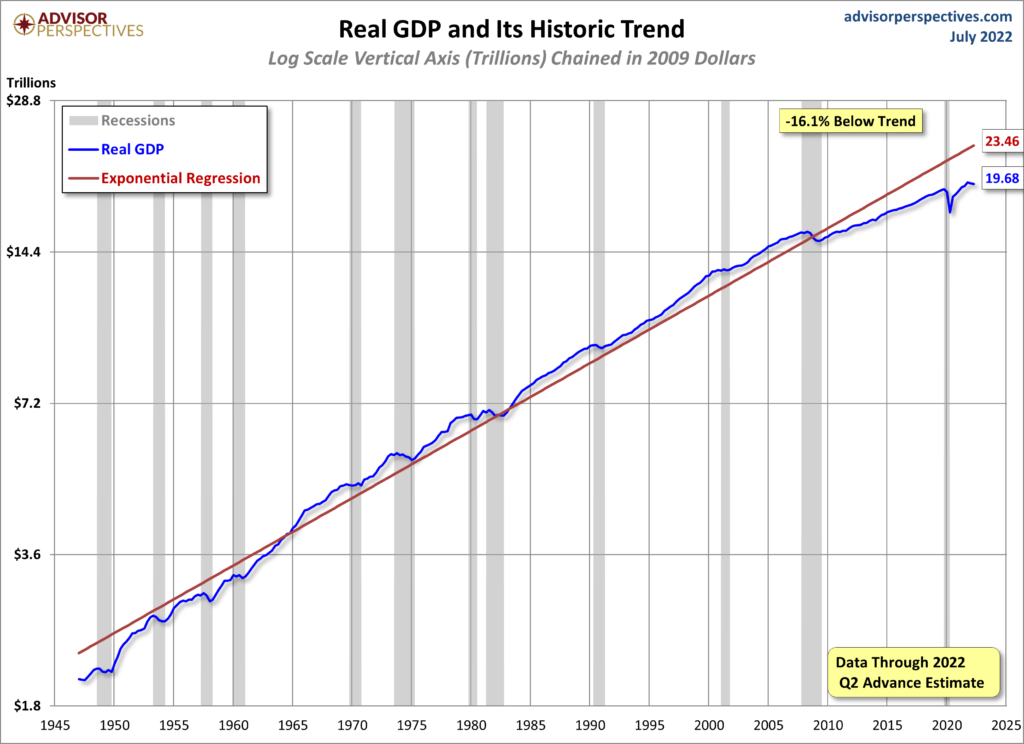
Real GDP Chart Since 1947 With Trendline – 2nd Quarter 2022

For reference purposes, below is a chart from the Advisor Perspectives’ post of July 28, 2022 titled “Q2 GDP Advance Estimate: Real GDP at -.9%, Worse Than Forecast” reflecting Real GDP, with a trendline, as depicted.  This chart incorporates the Gross Domestic Product, Second Quarter 2022 (Advance Estimate) of July 28, 2022:

U.S. Real GDP chart

_________

I post various indicators and indices because I believe they should be carefully monitored.  However, as those familiar with this site are aware, I do not necessarily agree with what they depict or imply.

_____

The Special Note summarizes my overall thoughts about our economic situation

SPX at 4023.61 as this post is written

Wednesday, July 27, 2022

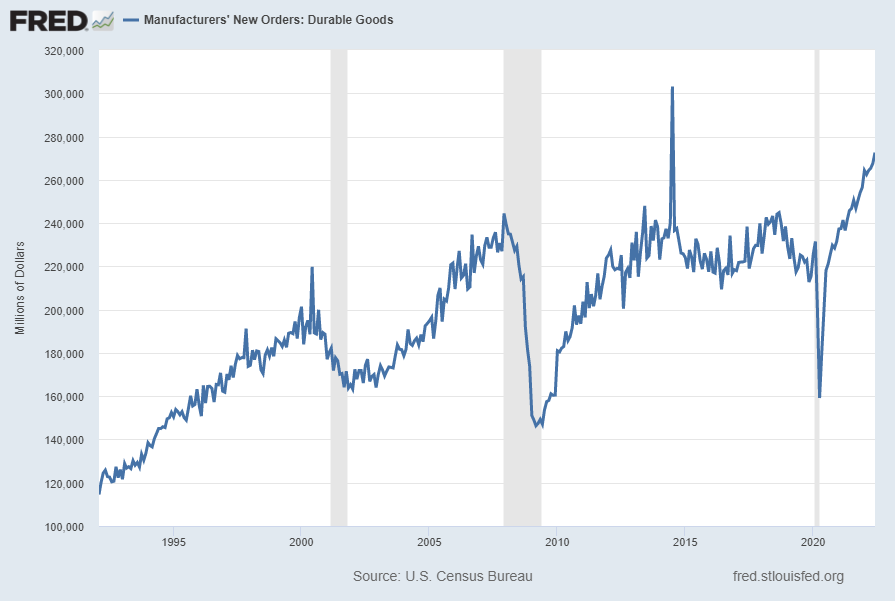
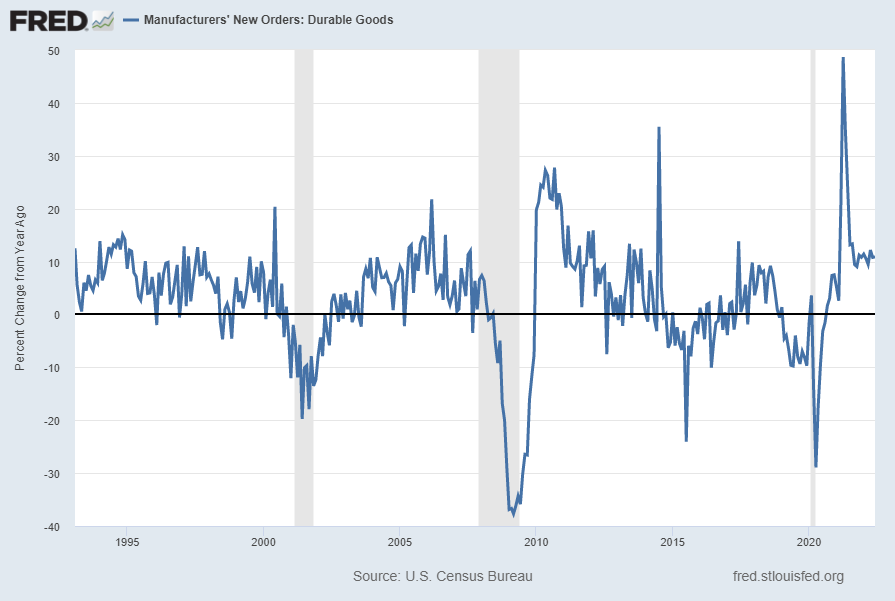
Durable Goods New Orders – Long-Term Charts Through June 2022

Many people place emphasis on Durable Goods New Orders as a prominent economic indicator and/or leading economic indicator.

For reference, below are two charts depicting this measure.

First, from the St. Louis Fed site (FRED), a chart through June 2022, updated on July 27, 2022. This value is $272,596 ($ Millions):

(click on charts to enlarge images)

Durable Goods New Orders

Second, here is the chart depicting this measure on a “Percent Change from a Year Ago” basis, with a last value of 10.9%:

Durable Goods New Orders Percent Change From Year Ago

Data Source: FRED, Federal Reserve Economic Data, Federal Reserve Bank of St. Louis: Manufacturers’ New Orders:  Durable Goods [DGORDER]; U.S. Department of Commerce: Census Bureau; accessed July 27, 2022; 
http://research.stlouisfed.org/fred2/series/DGORDER

_________

I post various indicators and indices because I believe they should be carefully monitored.  However, as those familiar with this site are aware, I do not necessarily agree with what they depict or imply.

_____

The Special Note summarizes my overall thoughts about our economic situation

SPX at 3969.41 as this post is written