Pages

Monday, November 30, 2009

The National Debt - A Few Comments

In August, I wrote an article titled "America's Trojan Horse" (which can also be found listed along the right-side of the homepage.)

This article had to do with various facets of our national debt, many unexplored. Here is an excerpt that I would like to further comment upon:

"The first of these concepts is that the financial markets have allowed us to grow and perpetuate our debt loads, absorbing this debt issuance at reasonable, if not low, interest rates. While this continual absorption of ever-increasing debt at lower rates is counterintuitive, it has nonetheless occurred. Why this counterintuitive event has occurred is largely unknown. Although it appears to be a long-term market anomaly (a propitious one at that) it might also be a concatenation of short-term market anomalies. The latter supposition is certainly a troubling facet to ponder, as it would likely make our ability to sustain such debt levels more tenuous."

Here is a long-term monthly chart of the 10-year Treasury yield. As one can see, the trend in yields has been down:


Chart courtesy of Stockcharts.com

Various economists have recently stated the national debt is at roughly $6 Trillion, or roughly 40% of GDP. They view the "danger point" as the national debt to GDP ratio of 100%, meaning that we can incur an additional $8 Trillion in national debt (to roughly $14 Trillion) before reaching the 100% level. Given that $8 Trillion in additional national indebtedness would likely take a few years to incur, it would appear based off of this reasoning that we have some time before the 100% "danger point" is reached. I don't agree with these figures (IMHO the actual level of debt is far higher) as well as the line of reasoning. No one really knows at what time or level the national debt hits a critical level.

It currently appears that the amount of the national debt is "tolerable" and is not causing undue concern in the markets. Metrics that cause me to draw this conclusion include the subdued level of interest rates on government debt (as seen by the above chart), seemingly low price levels of the sovereign credit default swaps of the United States, and a general lack of concern shown by the public and Congress, despite ever-increasing deficits that appear to be heading for at least $1 Trillion annually for the foreseeable future. It wasn't too long ago that a $500 Billion annual deficit was considered exceedingly high.

However, is this national debt level really as "acceptable" as it appears? Do we have a number of years at current deficit levels before we hit the "danger point?" When we do approach the "danger point," how long will we have before there are repercussions, and how serious will these repercussions be?

These questions are difficult to answer, as they appear contingent upon a number of complex, interrelated factors. I have some theories as to how and when the "danger point" will be reached, as well as the repercussions. However, these theories are still in the "formative" stages and thus I do not wish to explicitly specify a number or timeframe.

However, I will say that I am led to believe that the level of national debt, as well as our present propensity to accrue it, is not as "tolerable" as it may appear. In other words, I believe the "danger point" and subsequent repercussions may be reached sooner than the consensus believes.

If this "danger point" does present itself relatively quickly, of course it would have ramifications in many areas. Stimulus-based deficit spending, as well as other deficit spending, could likely become prohibitive. As well, other tangential effects could include higher interest rates. Furthermore, there may be a sudden need to actually reduce significant portions of the national debt.


SPX at 1087.27 as this post is written

Friday, November 27, 2009

Investment Frauds

In June I wrote a post about investment frauds. That post can be found here:

http://economicgreenfield.blogspot.com/2009/06/madoff-fraud-are-there-more.html

Since that June post, there have been a number of investment frauds uncovered. Of course, none have rivaled the size of Madoff's; however, they haven't been small either.

Perhaps the most disconcerting aspect of these frauds is that most appear to be unsophisticated. This could signal that there are many more that have yet to be uncovered, as the "bar" or "barriers to entry" for committing sizable investment frauds seems to have been set low.

I do believe there are many investment frauds, of different types, waiting to be uncovered. Sadly, the vast majority of these frauds should have never happened if proper due diligence was performed by investors. For whatever reason, a sense of wariness towards many of these investments seems to have been nonexistent for whatever reason.

While a discussion of due diligence is beyond the scope of this blog post, many of these frauds possessed similarities which should have instantly raised suspicions.


SPX at 1097.96 as this post is written

Wednesday, November 25, 2009

"Underwater Mortgages" Statistics

Yesterday The Wall Street Journal published an article titled "One in Four Borrowers Is Underwater."

The story contains a variety of statistics with regard to homeowner equity and home ownership issues. It gives a good overview of the situation, and this facet of the residential real estate situation is not pretty. As the headline states, 23% of all mortgage holders are "underwater," i.e. they owe more on their mortgages than the underlying house is worth.

There are several reasons that this situation is important. A couple include:

-These statistics are being generated despite the fact that there has been massive intervention and stimulus programs directed toward residential real estate. The majority of intervention and stimulus programs in some way, either directly or indirectly, are aimed toward supporting housing. It is highly disconcerting that we have such a dire situation despite such outsized intervention efforts. We, as a nation, have committed, both directly and indirectly (via various "guarantees") an epic amount of money toward this problem.

-As I have stated before, I do not believe that we have even come near the bottom of residential real estate prices. To the extent that residential real estate prices fall from here, this "underwater mortgage" situation will be exacerbated. A resumption of falling house prices would fuel many other problems, including the temptation of homeowners to commit "strategic defaults."

As I have written previously (my other Real Estate posts are under the "Real Estate" Category listed on the right-hand side of the home page) the real estate issues facing this country are severe, very complex, and not well understood.


SPX at 1107.71 as this post is written

Ron Paul On The U.S. Dollar

One of the facts that Ron Paul frequently quotes is that since the Federal Reserve's inception (it was created in 1913) the U.S. Dollar has lost more than 95% of its purchasing power.

I wonder how many people are actually concerned by this occurrence? I hardly ever hear this discussed among people or by the media.

They should be very concerned, however...


SPX at 1105.61 as this post is written

Tuesday, November 24, 2009

Another Thought On Gold

A November 20 Wall Street Journal article stated that Gold's January 1980 record high would have an inflation-adjusted equivalent of $2,290/oz.

I find it amazing that even after the long parabolic rise we have seen in Gold since 2001, we are still far short of that inflation-adjusted price. On an "all things considered" basis one would have thought that Gold would have performed stronger over the last 30 or so years. The Gold price really went into submission from 1980-2000.

I think it underscores the fact that at least from a historical perspective of the last few decades, it has been very important as to when Gold is purchased.

I mention this as Gold appears overdue for at least some type of correction. The recent price action, resulting with Gold now at $1169 (December futures) has been strongly parabolic.

I think that many factors are now in play that will generate considerable volatility in Gold's price going forward.

Gold's price should be very interesting to watch, and I think it carries great significance on a number of fronts.


SPX at 1106.24 as this post is written

Monday, November 23, 2009

Two Notable Developments

I would like to highlight two notable developments that have lately arisen.

Both have to do with interest rates on short-term US Government securities - the 3-month bill and 2-year note.

First, a chart of each of these securities' yields. Shown is a daily chart from January 2008 to the present, in LOG scale to show detail:


Charts Courtesy of StockCharts.com

As one can see, yields on each have fallen dramatically lately and now are near or at levels last seen during the height of the Financial Crisis during Q4 2008. During that time, investors aggressively moved into these securities as they were perceived to be a "safe haven."

The most common reason given for the recent yield movements on these securities is that there is high demand driven by needs for year-end portfolio adjustments and similar motives - i.e. the movements are "benign" in nature.

I do not necessarily concur with these "common" rationales, especially in a market environment where there have been myriad danger signals exhibited, of which I have previously written. While I am not certain this drop in yields is due entirely to a "flight to safety" (i.e. as purported "safe haven" securities) as in 4Q 2008, I suspect it is a least a major driver.

If indeed some or most of this yield movement is being caused by investors' fears, it would be most odd in that these securities are reflecting heightened fears while a broad array of securities don't appear to be reflecting such fears as measured by their price movements.

To illustrate, here is a simple comparison between the three month Treasury Yield and VIX (seen below in red) since 2008. I will use VIX as a general "fear" proxy. Note the inverse correlation during 4Q 2008 and the lack thereof now:


Chart Courtesy of StockCharts.com

Another aspect of this dropoff in yields bears comment. Why would a rather large class of investors settle for minuscule yields, at a time when major asset classes have done very well over the last few months?

"The markets" don't always make sense - and this appears to be an outsized example...


SPX at 1091.38 as this post is written

Friday, November 20, 2009

Is Gold Experiencing A Bubble?

One of the questions that frequently arises with Gold's recent strong performance is "Is Gold in a bubble?"

Before I make some comments concerning this question, here is a long-term monthly chart of Gold for reference:


Chart Courtesy of StockCharts.com

Anytime a security acts as strongly as Gold has, it is natural to suspect a bubble. This is especially true with Gold's price currently, as many people don't understand the complexity of the factors that can drive Gold's price.

As I have previously noted in various blog posts (which can be found under the "Investor" Category on the right-hand side of the home page) Gold's price can be very hard to predict. To a greater extent than other securities, there are many different, hard-to-quantify factors that can drive the Gold price.

Furthermore, the market for Gold is relatively small in relation to other asset markets, so investment flows both in and out of Gold can be magnified.

Is Gold in a bubble? Given the aforementioned, I would hesitate to make an affirmative declaration. This is not to say that it is not overvalued or "ahead of itself." As I wrote in a September 25 post, "I like Gold's properties. However, I don't believe that the economic factors now in existence support a strong Gold price, from an 'all things considered' basis."

Perhaps the greater question should be whether various asset classes are currently experiencing bubbles, and whether Gold is just one of a few (or many) classes in such a condition. In effect, is Gold's price strongly (positively) correlated to that of other asset classes, and if so, why?


SPX at 1091.01 as this post is written

Thursday, November 19, 2009

Interesting Comments From Liu Mingkang

Here is a link to a November 16 Wall Street Journal article titled "China's Blunt Talk for Obama":

http://online.wsj.com/article/SB125826103009548975.html

I found this to be particularly interesting:

"Liu Mingkang, chairman of the China Banking Regulatory Commission, said that a weak U.S. dollar and low U.S. interest rates had led to "massive speculation" that was inflating asset bubbles around the world. It has created "unavoidable risks for the recovery of the global economy, especially emerging economies," Mr. Liu said. The situation is "seriously impacting global asset prices and encouraging speculation in stock and property markets."


SPX at 1109.80 as this post is written

Wednesday, November 18, 2009

Ben Bernanke On Unemployment

Ben Bernanke gave a speech on Monday at the Economic Club of New York. Here is the link:

http://www.federalreserve.gov/newsevents/speech/bernanke20091116a.htm

I found his comments on unemployment to be noteworthy:

Here are some excerpts:

"In addition to constrained bank lending, a second area of great concern is the job market. Since December 2007, the U.S. economy has lost, on net, about 8 million private-sector jobs, and the unemployment rate has risen from less than 5 percent to more than 10 percent.6 Both the decline in jobs and the increase in the unemployment rate have been more severe than in any other recession since World War II.7

Besides cutting jobs, many employers have reduced hours for the workers they have retained. For example, the number of part-time workers who report that they want a full-time job but cannot find one has more than doubled since the recession began, a much larger increase than in previous deep recessions. In addition, the average workweek for production and nonsupervisory workers has fallen to 33 hours, the lowest level in the postwar period. These data suggest that the excess supply of labor is even greater than indicated by the unemployment rate alone."

also:

"The best thing we can say about the labor market right now is that it may be getting worse more slowly."

also:

"As the recovery becomes established, however, payrolls should begin to grow again, at a pace that increases over time. Nevertheless, as net gains of roughly 100,000 jobs per month are needed just to absorb new entrants to the labor force, the unemployment rate likely will decline only slowly if economic growth remains moderate, as I expect."


SPX at 1110.32 as this post is written

Tuesday, November 17, 2009

Gold And XLF

One of the charts that I follow is the ratio of Gold to XLF. As XLF is a prominent ETF of the financial stocks, it can serve as a proxy to "paper assets."

While I think it is difficult to make concrete conclusions based upon the Gold:XLF chart, I think it does provide a "feel" for some aspects of Gold's performance.

Here is the daily chart from 2007:


Chart Courtesy of StockCharts.com

In the above chart, Gold:XLF is plotted highest, with Gold and XLF plotted separately below. I find it interesting that while Gold's price has been performing strongly recently, the peak in the Gold:XLF ratio actually came in March. This seems to cast doubt upon the idea that Gold's recent strong performance is being driven by its "safe haven" qualities. As I commented in my November 10 post on Gold:

"In effect, could the current strong performance of Gold somehow be a precursor of (more) economic problems? The answer ... can certainly be “yes.” However, if so, it would be odd to have Gold rising strongly at the same time low quality paper assets have been rising strongly as well. From a long-term historical perspective, usually Gold’s “safe haven” qualities are most highly valued when “paper” assets are suffering."

Many people have traditionally viewed Gold as an "alternative" asset - one that should hold its value if other asset values fell. Given Gold's performance over the last few years, a Gold investor should assess if such an inverse relationship still exists, or if Gold has somehow transmogrified into just another asset that is (highly) correlated with all other assets.


SPX at 1107.02 as this post is written

Monday, November 16, 2009

The Latest Wall Street Journal Economic Forecast Survey

Here is a link to the latest (November) WSJ Economic Forecast Survey:

http://online.wsj.com/article/SB125797275784744057.html

There doesn't appear to be any major changes in expectations among the surveyed economists. As the survey states, "The economists expect gross domestic product to expand around 3% at a seasonally adjusted annual rate through 2010, slightly slower than the 3.5% recorded in the third quarter."

Also:

"More than half of the respondents see a U-shaped recovery with some slowness followed by solid growth, and 31% forecast a stronger, V-shaped recovery. Just 11% of economists expect an L-shaped rebound where economic activity stabilizes at a low level, and only 7% see a double-dip recession—another drop in gross domestic product after a short rebound—as the most likely scenario."

I find the 7% figure that see a double-dip scenario as being somewhat surprising. However, what I really found amazing was found in the detail section of the survey. The question was presented:

"What is the most likely potential asset bubble?"

Commodities 41%
Emerging-market equities 27%
Emerging-market real estate 22%
Treasurys 6%
High-yield bonds 4%
U.S. equities 0%

I found the responses to the last five categories (Emerging Market Equities to U.S. Equities) to be very low, and the 0% response to U.S. equities is amazing.

One other miscellaneous comment attached to the above "asset bubble" question was notable as well: "Rebounds in markets after widespread depression worries is not the making of a bubble."

_____

Regular readers of this blog know that I am not in agreement with the consensus displayed by economists with regard to the present and future economic condition...

As an FYI, I put together a recap of various economic forecasts and predictions made from mid-2007 through March 2009. They can be found on this page under "Predictions", the second article listed:

http://economicgreenfield.blogspot.com/p/directory-of-articles.html

Economic forecasts since mid-March 2009 can be found under the "Economic Forecasts" Category.


SPX at 1111.05 as this post is written

Singapore's Healthcare System

I ran across this piece, titled "What Singapore Can Teach the White House," in the Wall Street Journal from October 20. I found it very interesting, as it discussed the healthcare system for Singapore.

SPX at 1110.73 as this post is written

Friday, November 13, 2009

A Note On Healthcare Legislation

There is so much that can be said about our healthcare system and the reform efforts underway. My previous post on the topic is from August 19.

There is one special aspect of the current legislation that I would like to comment upon. This aspect is that no member of Congress or the President would participate in the proposed healthcare program.

I find this highly notable, and I am very disappointed by it.

It is a responsibility and obligation of leadership for them to be included in such a proposal. As well, their enrollment in the plan would signal confidence in the quality and benefits of the legislation.

If they have acted in a forthright and dignified fashion, and have fulfilled their fiduciary responsibilities as well as moral obligations in creating this legislation, they would ostensibly have no objection in including themselves in such a plan.


SPX at 1087.24 as this post is written

Thursday, November 12, 2009

Ron Paul - "Be Prepared for the Worst"

I would like to comment on a commentary by Ron Paul in the November 16 edition of Forbes. It is titled "Be Prepared for the Worst" and subtitled "The large-scale government intervention in the economy is going to end badly."

The commentary can be found at this link:

http://www.forbes.com/forbes/2009/1116/opinions-great-depression-economy-on-my-mind_print.html

While I don't agree with everything that Ron Paul says, I did find this commentary to be very interesting and well worth reading. Here are some excerpts that I found particularly noteworthy:

"A false recovery is under way."

also:

"This is nothing less than the creation of another bubble. By attempting to cushion the economy from the worst shocks of the housing bubble's collapse, the Federal Reserve has ensured that the ultimate correction of its flawed economic policies will be more severe than it otherwise would have been."

also:

"What is more likely happening is a repeat of the Great Depression. We might have up to a year or so of an economy growing just slightly above stagnation, followed by a drop in growth worse than anything we have seen in the past two years."


SPX at 1095.85 as this post is written

Wednesday, November 11, 2009

Food Bank Article

On October 30 The Chicago Tribune had an article titled "Trying to keep up with hunger." The article was about food assistance provided by the Northern Illinois Food Bank, of which Dennis Smith is executive director and CEO.

There are some interesting (and disturbing) passages in the article. Here are a few:

"'The number of people visiting the 525 food pantries, soup kitchens and youth locations across the region has gone up 35 percent from a year ago,' Smith said."

"'Hunger is exploding in northern Illinois and the small agencies are being hit harder than ever before,' Smith said."

"'A lot of the people we're seeing today have never been to a food pantry before,' he [Smith] said during the Oct. 22 tour."

_____

The last quote shown above further reinforces a trend that I commented upon in a July 15 post.  I called this trend the "first time of adversity" effect, a very important concept.


SPX at 1104.90 as this post is written

Tuesday, November 10, 2009

A Few Comments About Gold

Gold's recent price performance has been very strong.

There are, however, quite a few indicators that, from a historical perspective, seem to disconfirm Gold's current price, which as I write this is $1101 for the December futures contract.

One of the factors that seems to be speaking against Gold is the lagging performance of the HUI Index. As I wrote in the June 16 blog post:

"One measure that I follow is the ratio of HUI (an index of gold stocks) to that of the physical metal itself. One theory, perhaps the predominant one, is that the gold stocks should move, or at least verify, the price movements of the physical gold itself. Looking at the weekly chart (seen below) over the last 10 years seems to indicate that although gold has been relatively buoyant over the last year, the gold stocks, as seen by the HUI Index, have lagged since early 2008. One interpretation of this is that the gold stocks are not confirming the move in gold, meaning that gold may soon head down..."

Although Gold has continued to head up, as one can see in the chart below, the HUI:Gold ratio continues to lag and is at subdued (relative to the last ten years') levels:


Chart Courtesy of StockCharts.com

I find the lagging performance of the Gold stocks, as seen by the HUI Index, to be very conspicuous. This is especially so given the current investment environment where investors have shown they are even willing to aggressively bid up prices for securities that possess the most dubious of fundamental value.

In my opinion, predicting Gold's price has always been difficult. There are a variety of reasons for this, including the fact that the markets for both physical Gold and Gold stocks are relatively small. It doesn't take large investment inflows, or outflows, to move the price significantly.

Of course, Gold can be viewed as the ultimate "safe haven" security. Placing a value on this "safe haven" aspect is very difficult. Could Gold's current price be reflecting a significant "safe haven" premium? In effect, could the current strong performance of Gold somehow be a precursor of (more) economic problems? The answer to both of these questions can certainly be "yes." However, if so, it would be odd to have Gold rising strongly at the same time low quality paper assets have been rising strongly as well. From a long-term historical perspective, usually Gold's "safe haven" qualities are most highly valued when "paper" assets are suffering.

Gold's price action should be interesting going forward...


SPX at 1093.69 as this post is written

Monday, November 9, 2009

Two Unemployment Charts

The following chart is from the CalculatedRISK blog of November 8 http://www.calculatedriskblog.com/2009/11/summary-and-look-ahead.html

I like this chart as it presents a relative depiction of Post WWII recession job losses. As one can see, our current period of economic weakness's job losses are outsized both in duration and severity:

(click on images to enlarge charts)


Here is a long-term view of the official stated Unemployment Rate. This chart is from the St. Louis Federal Reserve site. I find this chart interesting for many reasons. As one can see, our current official Unemployment Rate (U3) is second only to that of the early 80's. Also, one can see that although large spikes up in the Unemployment Rate are relatively common, in prior periods the spikes up were (relatively) quickly followed by a quick retreat:


I have written frequently about the Unemployment situation. These blog posts can be found under the "Unemployment" Category. For those interested, here are a couple of the latest posts:

http://economicgreenfield.blogspot.com/2009/10/another-note-on-unemployment-statistics.html

http://economicgreenfield.blogspot.com/2009/10/note-about-unemployment-statistics.html

Furthermore, I wrote a blog series titled "Why Aren't Companies Hiring?"


SPX at 1079.79 as this post is written

Friday, November 6, 2009

Danger In The Markets? Part V

This is the last blog post (Part V of V) in this "Danger In The Markets?" blog series.

I would like to end this blog series with another look at the daily 1-year S&P500 chart. This chart depicts a Rising Wedge from the March lows. As well, I have indicated a potential H&S (Head and Shoulders) pattern in red. For those unaware, both of these patterns are bearish. I believe more in the Rising Wedge than the H&S, as it is more established. Additionally, the VIX can be found along the bottom of the chart:


Chart Courtesy of StockCharts.com

One will note that in yesterday's post (Part IV) there was a daily S&P500 chart that showed a Rising Wedge pattern as well. The difference in appearance between that chart and the one above is that the bottom trendline is drawn differently - the chart above incorporates the early October low. Regardless, should this Rising Wedge pattern be validated through future price action, conventional Technical Analysis methods would "measure" a resulting price far below the March low of 666.

As I have mentioned repeatedly on the blog (and these commentaries can be found under the "Stock Market" and "Investor" categories) I strongly believe the rally from the March low of 666 is a Bear Market Rally. The implications of this belief, should it prove accurate, are profound both from a financial markets perspective as well as an economic one.

As I have stated previously, I do hope that my analysis and conclusions as to where the markets and economy are heading are incorrect, and that we are on the path to true Sustainable Prosperity. However, I am firmly convinced from both an economic and markets perspective that we face an array of difficult problems in our economic future and resolving them will likely prove most vexing.

It should be noted that, as mentioned repeatedly on this blog, my views are very contrarian in nature. As such, they are quite at odds with those held by the vast majority of economic and financial professionals who are firmly convinced that we are currently experiencing a recovery with little or no risk of further economic damage...


SPX at 1066.63 as this post is written

Thursday, November 5, 2009

Danger In The Markets? Part IV

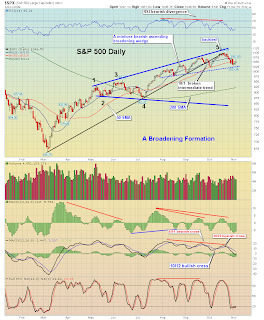
The charts seen in this post are from Maurice Walker, http://thechartpatterntrader.com. First, a daily 1-year chart of the S&P500. The large broadening pattern (in blue) is notable, as is the smaller one, as seen by the dotted line.


chart provided by http://thechartpatterntrader.com

Chart Courtesy of StockCharts.com

Here is a weekly chart of the S&P500. Notable here is the downtrend line (in black) from the October 2007 highs that seems to be serving as resistance. Also, the MACD and Full Stochastics seem to be reflecting weakness.


chart provided by http://thechartpatterntrader.com

Chart Courtesy of StockCharts.com

Next is a weekly chart of the QQQQ. Again, as with the S&P500 chart above, the downtrend line (in black) from the October 2007 highs that seems to be serving as resistance. Also, the MACD and Full Stochastics seem to be reflecting weakness. As well, the RSI is declining:


chart provided by http://thechartpatterntrader.com

Chart Courtesy of StockCharts.com


Now onto Part V...


SPX at 1046.50 as this post is written

Wednesday, November 4, 2009

Danger In The Markets? Part III

Moving on to the stock market. First, a 1-year daily chart of the S&P500. Although at first glance, the advance from the March lows doesn't appear too suspect, two aspects are notable. One can see that currently the price has dipped below the 50 day moving average (line seen in blue -the red line is the 200 day moving average) for only the second time since the rally began in March; and second, the MACD indicator along the bottom seems at best lethargic; at worst, it is a significant divergence from the advancing price:


Chart Courtesy of StockCharts.com

Next, here is a daily chart from ~ mid '07 of the NYSE Summation Index. I have put in the S&P500 as an overlay in green, with the NYSE Summation Index's MACD at the bottom of the chart. What I continue to find interesting here is the negative MACD divergence as indicated on the chart, as seen by the blue trendlines:


Chart Courtesy of StockCharts.com

Next is a 10-year daily chart of the VIX. The level of 20 (as seen by the blue horizontal line) on the VIX seems to be a good demarcation of stress. I originally made this observation on September 16, and note how the 20 level seems to have subsequently acted as support.

The VIX has been above this 20 level continuously since early September of 2008:


Chart Courtesy of StockCharts.com


Now on to Part IV...


SPX at 1045.41 as this post is written

Tuesday, November 3, 2009

Danger In The Markets? Part II

Before displaying some charts of the stock market, I would like to post a couple of the Japanese Yen. My comment of September 14 is relevant today:

"Additionally, is it not odd, on an “all things considered” basis, that the Japanese Yen is rising at what appears to be an increasing rate? This rise commenced in mid-2007, as seen below:"

Here is the 5-year daily chart of the Japanese Yen:


Chart Courtesy of StockCharts.com

Here is the 1-year daily chart. As one can see, there may be a Cup and Handle chart pattern forming from early 2009:


Chart Courtesy of Stockcharts.com

Now onto Part III...


SPX at 1040.14 as this post is written

Monday, November 2, 2009

Danger In The Markets? Part I

This series of blog posts represents a periodic Technical Analysis of the markets. My last series of posts (5 parts) of this nature was titled "Peril In The Markets?" and started September 13. At the conclusion of that series of posts, I wrote this September 17 blog post summarizing my thoughts.

Although a stock market crash did not occur in September or October, as I thought likely given the overall situation, my overall assessment of the markets (and the economic situation) is that the level of risk has increased. There continues to be an extreme degree of peril embedded in the financial markets - as well as the economy in general. In my opinion, from these price levels this peril can only be resolved via a crash of possibly extreme magnitude.

Before displaying some charts, I would like to make a couple of disclaimers. First, an extensive overview of all of my Technical Analysis observations would be very lengthy, and it would also infringe upon some facets I consider to be proprietary. As such, I will limit my observations, but I think most people will still get a clear overview of my thoughts. Second, I am aware that many people don’t believe in Technical Analysis. Even though I use Technical Analysis extensively, I will readily admit it is not infallible. As readers of this blog are aware, the majority of my focus is on fundamental aspects of the markets and the economic situation.

Now, on to Part II and some charts...


SPX at 1036.19 as this post is written

Sunday, November 1, 2009

"Cash For Clunkers" : Incremental Sales Analysis

My last post about "Cash For Clunkers" was on October 8.

On Thursday, there was an interesting story on CNNMoney.com concerning a sales analysis of the Cash For Clunkers program. It can be found at this link:

http://money.cnn.com/2009/10/28/autos/clunkers_analysis/?postversion=2009102910

Here are some excerpts that are particularly notable:

"A total of 690,000 new vehicles were sold under the Cash for Clunkers program last summer, but only 125,000 of those were vehicles that would not have been sold anyway, according to an analysis released Wednesday by the automotive Web site Edmunds.com."

and later in the article:

"The average rebate was $4,000. But the overwhelming majority of sales would have taken place anyway at some time in the last half of 2009, according to Edmunds.com. That means the government ended up spending about $24,000 each for those 125,000 additional vehicle sales."

and later in the article:

"In order to determine whether these sales would have happened anyway, Edmunds.com analysts looked at sales of luxury cars and other vehicles not included under the Clunkers program.

Using traditional relationships between sales volumes of those vehicles and the types of vehicles sold under Cash for Clunkers, Edmunds.com projected what sales would normally have been during the Cash for Clunkers period and in the weeks after.

Edmunds.com's estimate of the ultimate sales increase generally matches what industry experts had thought, said George Pipas, a sales analyst with Ford Motor Co (F, Fortune 500)."


SPX at 1036.19 as this post is written