Here is an update on various indicators that are supposed to predict and/or depict economic activity. These indicators have been discussed in previous blog posts:
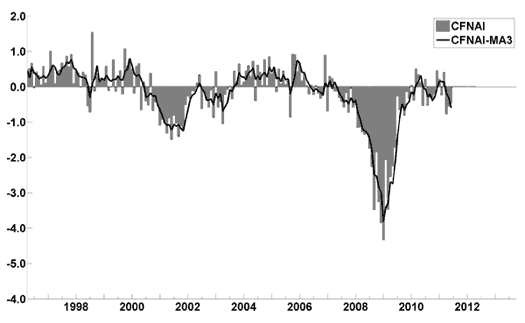
The August Chicago Fed National Activity Index (CFNAI)(pdf) updated as of August 22, 2011:

-
The Consumer Metrics Institute Contraction Watch:

-
The USA TODAY/IHS Global Insight Economic Outlook Index:
An excerpt from the August 1 Press Release, titled “Index sees stronger growth in second half of 2011” :
-The July update of the USA TODAY/IHS Global Insight Economic Outlook Index shows real GDP growth, at a six-month annualized growth rate, slowly gaining strength in the second half of the year. Lower oil prices, improved auto production and sales, increased business equipment spending, strong exports and recovery in the multi-family residential sector are expected to push growth above 3% in November and December. High unemployment and continued weakness in the single-family housing sector remain drags on growth.
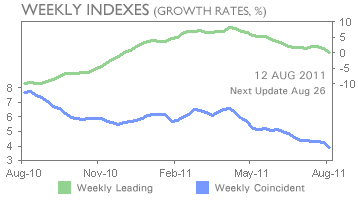
The ECRI WLI (Weekly Leading Index):
As of 8/12/11 the WLI was at 123.9 and the WLI, Gr. was at -.1%. A chart of the growth rates of the Weekly Leading and Weekly Coincident Indexes:

-
The Dow Jones ESI (Economic Sentiment Indicator):
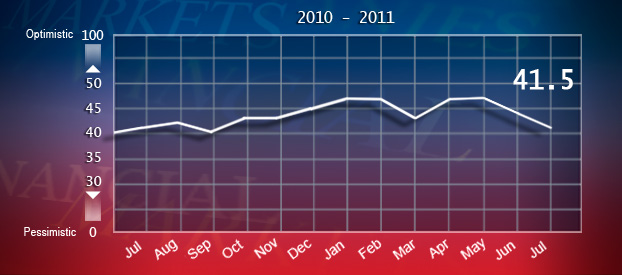
The Indicator as of August 1 was at 41.5, as seen below:

An excerpt from the August 1 Press Release, titled "Return to Recession is a Real Risk According to Dow Jones Economic Sentiment Indicator" :
As Washington focuses on the debt ceiling, there are signs that the rest of the U.S. economy is running into trouble, according the Dow Jones Economic Sentiment Indicator. In July, the ESI dropped to 41.5 from a reading of 44 in June. The indicator has now fallen for two consecutive months for a cumulative decline of 5.1, the worst two-month drop since the fall of 2008.
-“It would be easy to blame the dip in the ESI on the U.S. debt crisis, but much of the gloom stems from Main Street rather than Washington,” says Dow Jones Newswires “Money Talks” columnist Alen Mattich. “The readings this summer have fallen enough that it seems to suggest a slide back into recession is a real risk.”
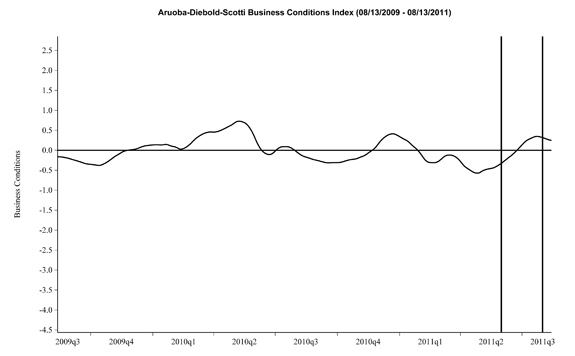
The Aruoba-Diebold-Scotti Business Conditions (ADS) Index:
Here is the latest chart, depicting 8-13-09 to 8-13-11:

-
The Conference Board Leading (LEI) and Coincident (CEI) Economic Indexes:
As per the August 18 release, the LEI was at 115.8 and the CEI was at 103.3 in July.
An excerpt from the August 18 Press Release:
_________Says Ataman Ozyildirim, economist at The Conference Board: "The U.S. LEI continued to increase in July. However, with the exception of the money supply and interest rate components, other leading indicators show greater weakness – consistent with increasing concerns about the health of the economic expansion. Despite rising volatility, the leading indicators still suggest economic activity should be slowly expanding through the end of the year.”
I post various indicators and indices because I believe they should be carefully monitored. However, as those familiar with this blog are aware, I do not necessarily agree with what they depict or imply.
_____
The Special Note summarizes my overall thoughts about our economic situation
SPX at 1123.82 as this post is written
No comments:
Post a Comment