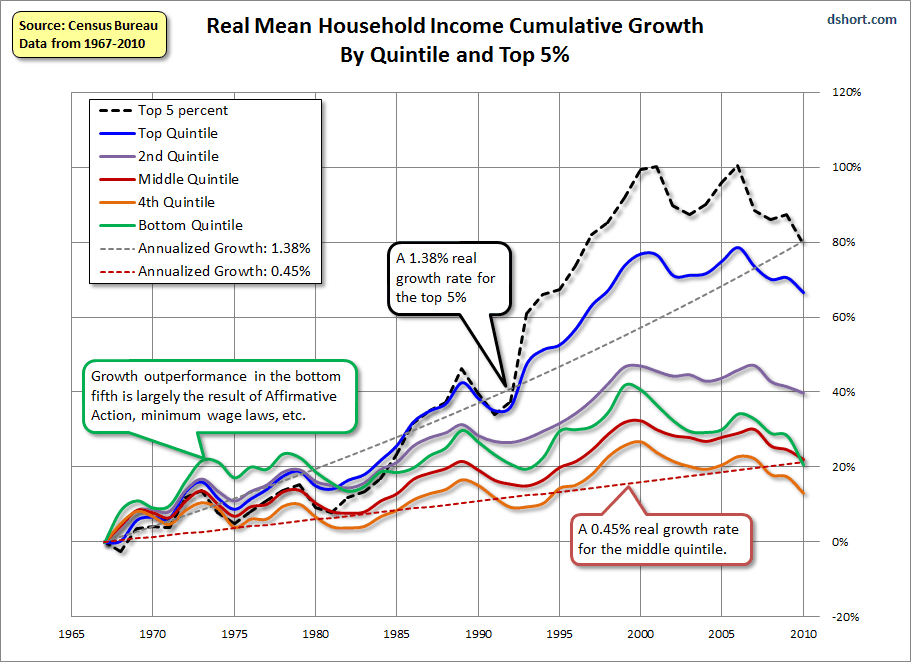
In the September 20, 2010 post ("Real Median Household Income & Poverty Measures") I highlighted the lack of significant long-term growth in Real Median Household Income.
As I stated in that post:
Doug Short, in his September 13 blog post titled “U.S. Household Incomes: A 43-Year Perspective,” has a variety of charts and commentary on various facets of Household Income distributions and growth.…Real Median Household Income has experienced anemic growth for decades.
One chart, seen below, seems particularly interesting. It is a depiction of Real Mean Household Income Cumulative Growth By Quintile and Top 5%, from 1967 to 2010:
(click on chart to enlarge image)

_____
The Special Note summarizes my overall thoughts about our economic situation
SPX at 1181.05 as this post is written
No comments:
Post a Comment