In this post I would like to highlight various areas which I believe indicate excessively positive sentiment and related measures indicating "froth" in the stock market.
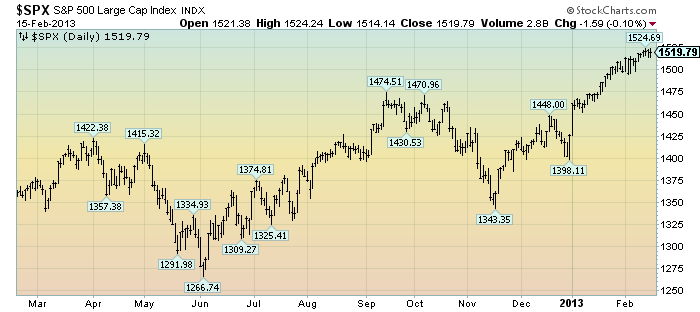
The stock market has had a remarkable "run" since roughly mid-November. This is illustrated in a 1-year daily chart of the stock market (S&P500) :
(click on chart to enlarge image)(chart courtesy of StockCharts.com; chart creation and annotation by the author)
-
From a general standpoint, there doesn't appear to be much - if any - of a "wall of worry." Any type of significant apprehension on the part of stock market investors appears lacking. Additionally, there seems to be an attitude that additional QE measures preclude any substantial, lasting economic and/or financial market adversity.
From a specific standpoint, there is an extensive list of indicators showing a high level of “frothiness” and other excesses in the stock market. Many of these indicators are at either all-time record levels, or are at levels which occur only a few times over a decade (or decades.)
While the full list of these indicators is exceedingly lengthy, a sampling of such indicators includes the following:
- Strong "price action" as seen in the price chart of the S&P500 – as well as many individual stocks. Many stocks and indices show an increasingly “parabolic” trajectory.
- Recent record-high stock market fund inflows.
- Buoyant stock-market breadth; an excerpt from the February 13th SentimenTrader.com commentary: "For 8 consecutive days in late January, more than 90% of stocks had closed above their 50-days. Going back to 1996, the only time we saw a longer streak was June 10, 2003 as stocks emerged from the bear market."
- Broad-based bullishness among newsletter writers. An excerpt from the February 11 SentimenTrader.com newsletter: "According to Hulbert Financial Digest, newsletters have increased their recommended Nasdaq exposure to nearly 94%, meaning that the average newsletter is recommending a nearly fully invested position. Since the year 2000, there has been only 1 week that exceeded this reading, which was March 31, 2000."
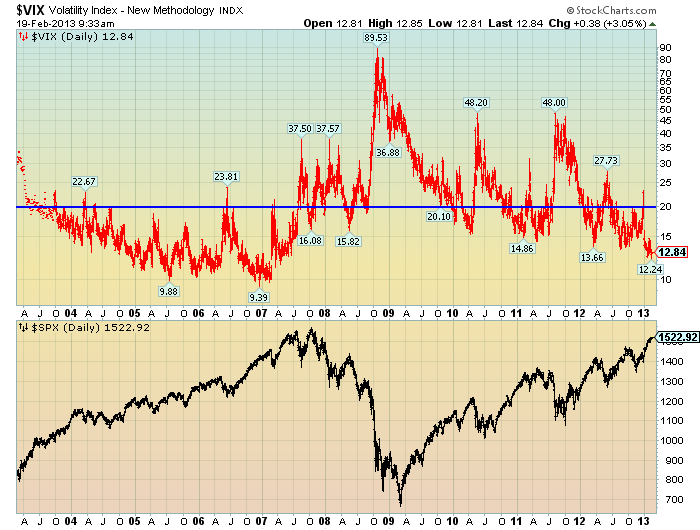
- A highly subdued VIX, sustaining a level below 20. I have written of the VIX level of 20 and its significance on a few occasions, including the February 7, 2012 post ("The VIX Level Of 20 And Its Continual Significance.") As seen on the chart below, from a 10-year daily perspective the VIX (shown on a "LOG" basis in red, with the S&P500 shown below it) has been sustaining a remarkably low level, now at 12.84. When one looks at the chart, one can seen that current levels are (at least) somewhat reminiscent of the "golden era" of roughly 2004-2007:
(click on chart to enlarge image)(chart courtesy of StockCharts.com; chart creation and annotation by the author)
-
While excessive sentiment and signs of stock market "froth" are not necessarily "proof" of a coming near-term correction or impending calamity, history indicates that such market excess in itself constitutes a dangerous condition. This is especially notable when combined with an array of other economic and financial perils, as featured throughout this blog.
Cumulatively, my overall analysis continues to indicate a building level of financial danger, highly outsized by historical standards.
_____
The Special Note summarizes my overall thoughts about our economic situation
SPX at 1526.31 as this post is written


As seen on the chart below, from a 10-year daily perspective the VIX (shown on a "LOG" basis in red, with the S&P500 shown below it) has been sustaining a remarkably low level, now at 12.84. ...http://www.frugalrules.com/steps-investing-stock-market
ReplyDelete