Here is an update on various indicators that are supposed to predict and/or depict economic activity. These indicators have been discussed in previous blog posts:
The April Chicago Fed National Activity Index (CFNAI)(pdf) updated as of April 22, 2013:
-
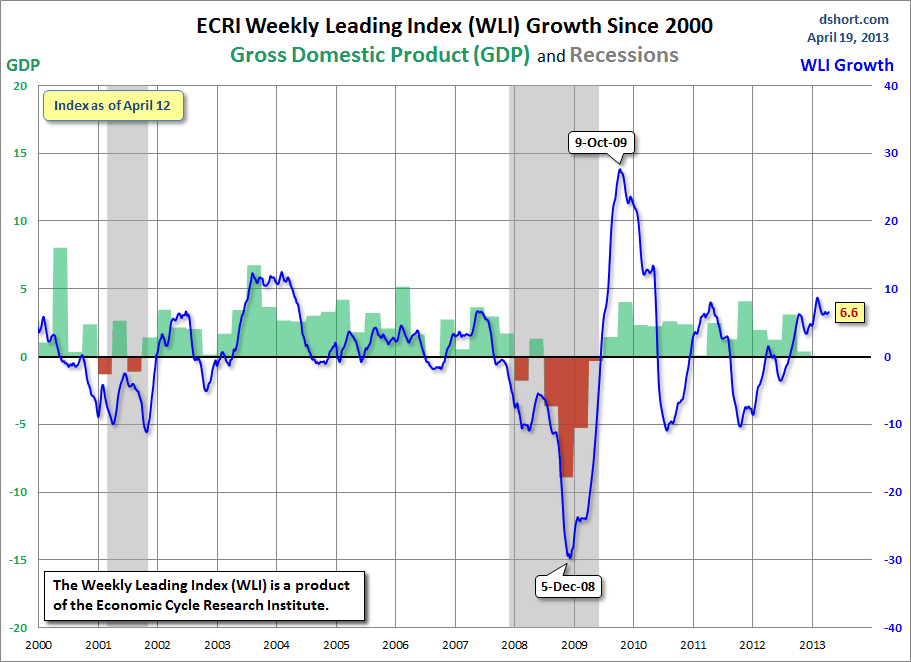
As of 4/19/13 (incorporating data through 4/12/13) the WLI was at 130.6 and the WLI, Gr. was at 6.6%.
A chart of the WLI, Gr. since 2000, from Doug Short’s blog of April 19 titled “Recession Watch: ECRI's Weekly Leading Index Rises” :
-
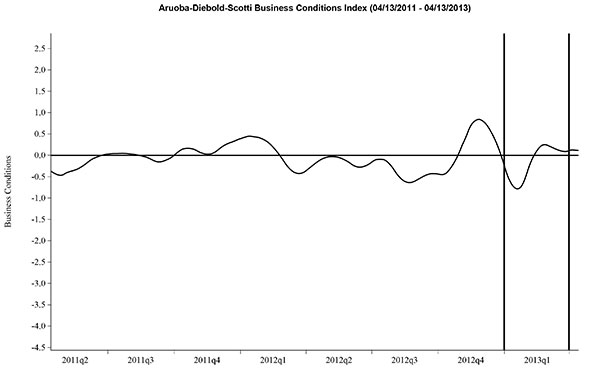
Here is the latest chart, depicting 4-13-11 to 4-13-13:
-
As per the April 18 press release, the LEI was at 94.7 and the CEI was at 105.2 in March.
An excerpt from the April 18 release:
Says Ataman Ozyildirim, economist at The Conference Board: “After three consecutive gains, the U.S. LEI dipped slightly in March, with equally balanced strengths and weaknesses among its components. The leading indicator still points to a continuing but slow growth environment. Weakness in consumer expectations and housing permits was offset by the positive interest rate spread and other financial components. Meanwhile, the coincident economic index, a measure of current conditions, is down since December due to a large decline in personal income.”
Here is a chart of the LEI from Doug Short’s blog post of April 18 titled “Conference Board Leading Economic Index: 'Declined Slightly in March'" :
_________
I post various indicators and indices because I believe they should be carefully monitored. However, as those familiar with this blog are aware, I do not necessarily agree with what they depict or imply.
_____
The Special Note summarizes my overall thoughts about our economic situation
SPX at 1552.69 as this post is written


No comments:
Post a Comment