This post is the latest I have written concerning the stock market.
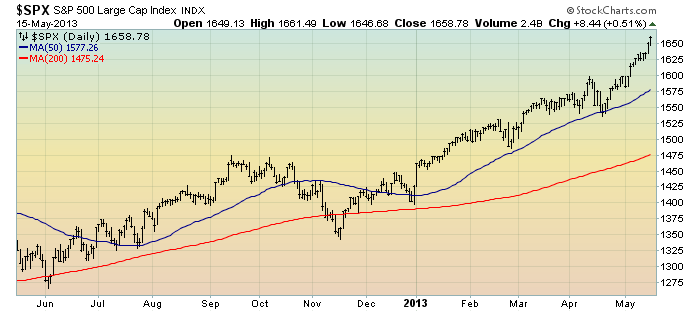
For reference, below is a one-year daily chart of the S&P500 through May 15 (with a closing price of 1658.78), indicating both the 50dma and 200dma:
(click on chart to enlarge image)(chart courtesy of StockCharts.com; chart creation and annotation by the author)
There are many aspects of the "price action" of the S&P500, as well as many individual stocks, that are notable. I commented upon this in a variety of past posts, including that of February 19 ("Excessive Positive Sentiment And Froth In The Stock Market.")
As I mentioned in that post:
Many stocks and indices show an increasingly “parabolic” trajectory.
Since that post, one can see from the above chart that the S&P500 has continued its rather remarkable upward trajectory, especially since mid-November. The "parabolic" price action has intensified. I believe this "parabolic" trajectory is highly notable when viewed from a long-term historical perspective.
While this strong rally is not in itself necessarily indicative of impending problems, there are a variety of measures that are cause for concern. Some of those measures were discussed in the aforementioned February 19 post. Many others also exist, including both those that are "technical" in nature as well as those that could be considered "fundamental" in nature.
Among commonly stated reasons (as seen in the popular media among others) for this strong stock market rally and resulting recent new record high levels in the S&P500 (as well as Dow Jones Industrials) include the oft-stated "accommodative" (or "easy money") monetary policies as well as the "strong earnings" that are projected to further increase in 2013 & 2014. The conclusion drawn by such reasoning is that unless there is a substantial change in either monetary policy, or a significant fundamentally-led change in earnings projections - neither of which is seen in prominent forecasts - the stock market's current levels are not only "justified" but the stock market is seen by many as being "attractively" valued on such measures as (forward) PE Ratios.
My analyses, however, continues to indicate a starkly different conclusion. I continue to view this stock market as not only an asset bubble, but also one that is exceedingly large. While I concede that this view is very unique and not necessarily an "obvious" conclusion, like many bubbles it will be evident in hindsight.
As well, my analyses indicate that the "popping" of this equity bubble will have a profound and lasting negative impact on the economy. While many people believe that bursting equity bubbles don't represent a substantial threat to the larger economy, I continue to believe that their analyses and conclusions are not pertinent to our present situation.
Cumulatively, this parabolic stock market and its various "mania" characteristics are yet another "danger signal" in the overall financial system. As I have written, my overall analysis continues to indicate a building level of financial danger, very large by historical standards. My analyses indicate that such danger and its resolution will have highly notable future consequences, including that of a stock market crash that is outsized by historical standards.
_____
The Special Note summarizes my overall thoughts about our economic situation
SPX at 1658.78 as this post is written

While this strong rally is not in itself necessarily indicative of impending problems, there are a variety of measures that are cause for concern. Some of those measures were discussed in the aforementioned February 19 post,.....http://www.frugalrules.com/steps-investing-stock-market
ReplyDelete