On January 9, 2017 I wrote a post (“Low Interest Rates And The Formation Of Asset Bubbles“) that mentioned the “Taylor Rule.” As discussed in that post – and for other reasons – the level of the Fed Funds rate – and whether its level is appropriate – has vast importance and far-reaching consequences with regard to many aspects of the economy and financial system.
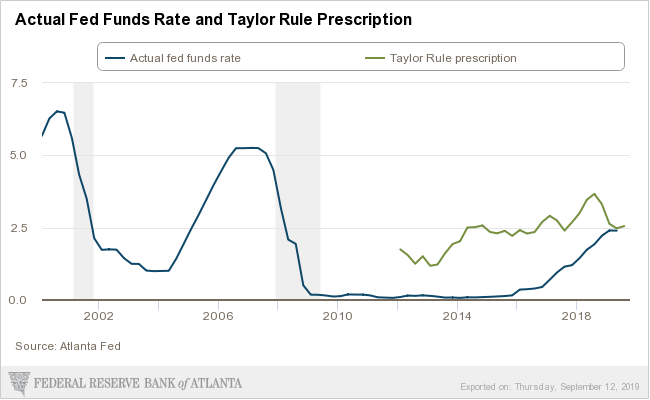
For reference, below is an updated chart depicting the “Taylor Rule” prescription and the actual Fed Funds rate, provided by the Federal Reserve Bank of Atlanta, updated as of September 12, 2019:

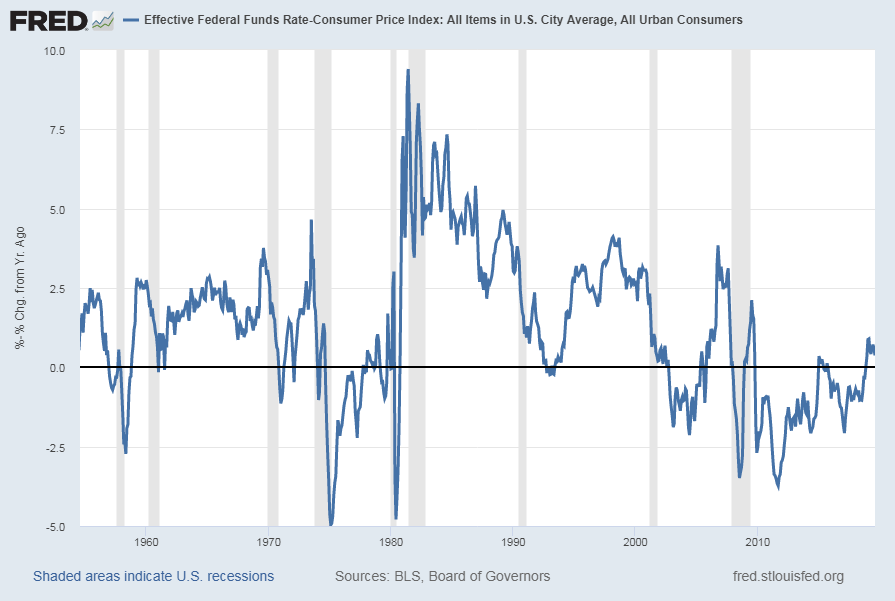
For additional reference, below is a long-term chart indicating the Real Fed Funds Rate [FRED FEDFUNDS – CPIAUCSL] , with a last value of .37479 through August. Of particular note is the post-2000 persistently negative Real Fed Funds rate:

source: Board of Governors of the Federal Reserve System (US), Effective Federal Funds Rate [FEDFUNDS], retrieved from FRED, Federal Reserve Bank of St. Louis; accessed September 12, 2019: https://fred.stlouisfed.org/series/FEDFUNDS
source: U.S. Bureau of Labor Statistics, Consumer Price Index: All Items in U.S. City Average, All Urban Consumers [CPIAUCSL], retrieved from FRED, Federal Reserve Bank of St. Louis; accessed September 12, 2019: https://fred.stlouisfed.org/series/CPIAUCSL
_____
The Special Note summarizes my overall thoughts about our economic situation
SPX at 3009.57 as this post is written
No comments:
Post a Comment