For reference, below are two charts depicting this measure.
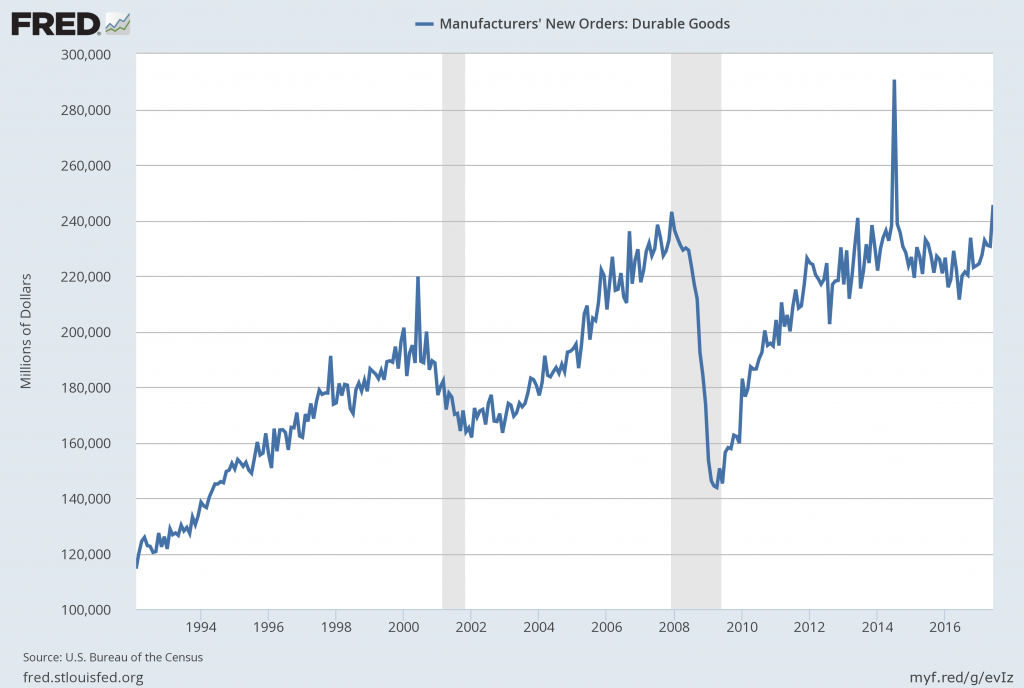
First, from the St. Louis Fed site (FRED), a chart through June 2017, updated on July 27, 2017. This value is $245,568 ($ Millions):
(click on charts to enlarge images)
–
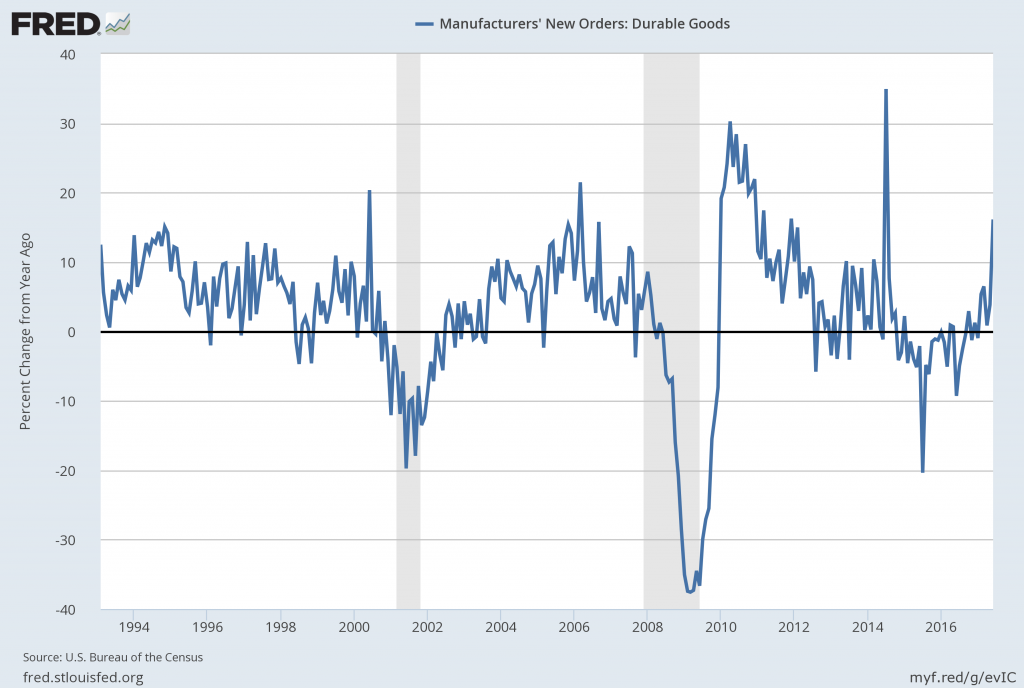
Second, here is the chart depicting this measure on a “Percentage Change from a Year Ago” basis:
Data Source: FRED, Federal Reserve Economic Data, Federal Reserve Bank of St. Louis: Manufacturers’ New Orders: Durable Goods [DGORDER]; U.S. Department of Commerce: Census Bureau; accessed July 27, 2017;
http://research.stlouisfed.org/fred2/series/DGORDER
_________
I post various indicators and indices because I believe they should be carefully monitored. However, as those familiar with this site are aware, I do not necessarily agree with what they depict or imply.
_____
The Special Note summarizes my overall thoughts about our economic situation
SPX at 2480.85 as this post is written
No comments:
Post a Comment