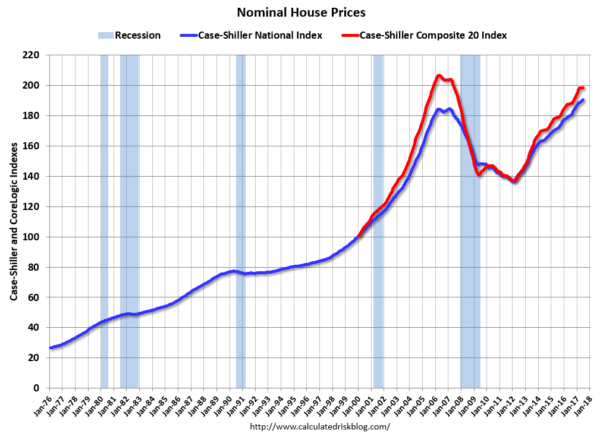
As a reference for long-term house price index trends, below is a chart, updated with the most current data (through June) from the CalculatedRisk blog post of August 29, 2017 titled “Real Prices and Price-to-Rent Ratio in June”:
(click on chart to enlarge image)
_________
I post various indicators and indices because I believe they should be carefully monitored. However, as those familiar with this site are aware, I do not necessarily agree with what they depict or imply.
_____
The Special Note summarizes my overall thoughts about our economic situation
SPX at 2443.46 as this post is written
No comments:
Post a Comment