Throughout this site there are many discussions of economic indicators. At this time, the readings of various indicators are especially notable.
While many U.S. economic indicators – including GDP – are indicating economic growth, others depict (or imply) various degrees of weak growth or economic contraction.
Below are a small sampling of charts that depict greater degrees of weakness and/or other worrisome trends, and a brief comment for each:
Overall Economic Activity
While the recently-released 2nd quarter GDP (Third Estimate)(pdf) was 3.1%, there are other broad-based economic indicators that seem to imply a weaker growth rate. As well, it should be remembered that GDP figures can be (substantially) revised.
Currently, the consensus opinion for near-term growth is that the recent hurricanes will serve to depress economic growth. As Janet Yellen stated at the September 20 FOMC Press Conference:
In the third quarter, however, economic growth will be held down by the severe disruptions caused by Hurricanes Harvey, Irma, and Maria. As activity resumes and rebuilding gets underway, growth likely will bounce back. Based on past experience, these effects are unlikely to materially alter the course of the national economy beyond the next couple of quarters.
There has been a (very) significant lowering of estimates for 3rd Quarter GDP growth. This can be seen in various estimates, including the Federal Reserve Bank of Atlanta’s GDP Now (September 29 estimate of 2.3%) as well as the Federal Reserve Bank of New York’s Nowcast (September 29 estimate of 1.5%.)
However, is the recent reduction in economic growth estimates indeed due to the hurricanes? There are many reasons to believe that overall weakening economic growth and/or contraction in some economic measures had been occurring previous to the hurricanes.
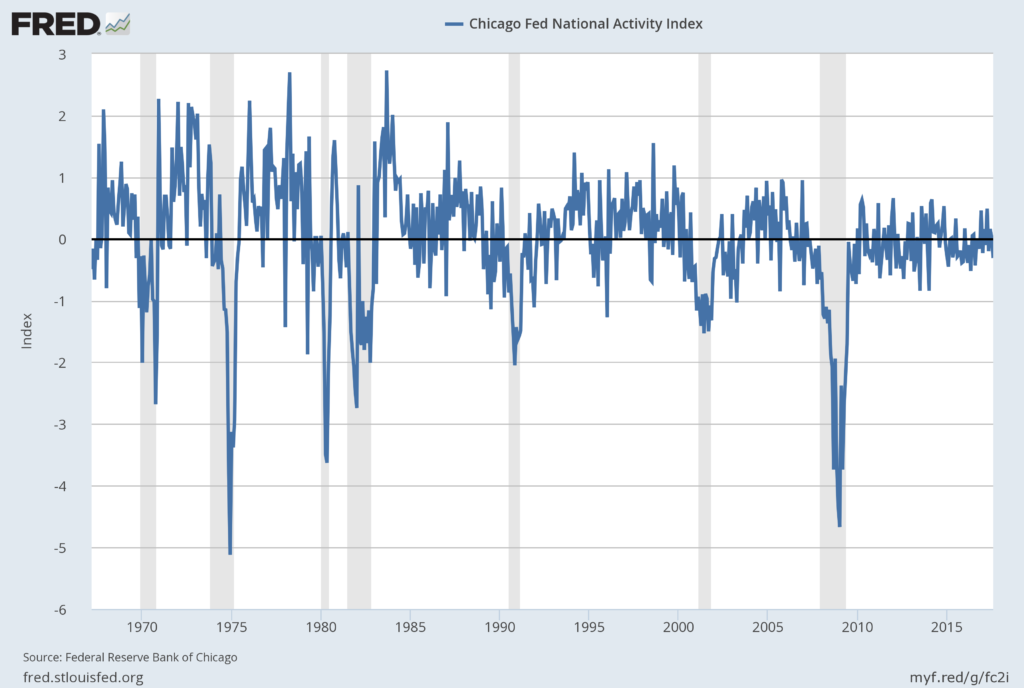
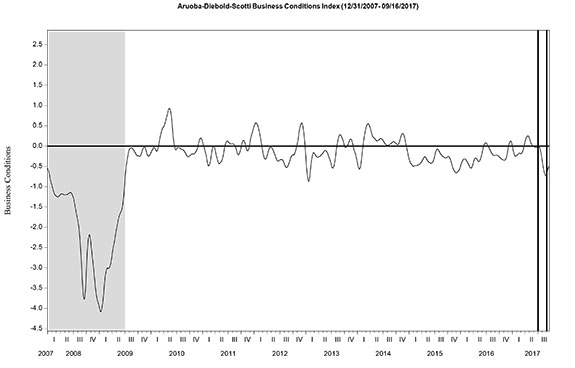
Among the broad-based economic indicators that have been implying weaker growth or mild contraction is the Chicago Fed National Activity Index (CFNAI) and the Aruoba-Diebold-Scotti Business Conditions Index (ADS Index).
As seen in the charts shown below, such trends have been in existence for a number of months:
The September 2017 Chicago Fed National Activity Index (CFNAI) updated as of September 25, 2017:
The CFNAI, with current reading of -.31:
source: Federal Reserve Bank of Chicago, Chicago Fed National Activity Index [CFNAI], retrieved from FRED, Federal Reserve Bank of St. Louis, September 25, 2017;
The ADS Index, from the year 2000 through September 16, 2017:
–
Inflation Trends
Current inflation levels and the possibility of deflation is a vastly complex topic, and as such isn’t suitably discussed in a brief manner. I have discussed the issue of deflation extensively as I continue to believe that prolonged and deep U.S. deflationary conditions are on the horizon, and that such deflationary conditions will cause, as well as accompany, inordinate economic hardship. [note: to clarify, for purposes of this discussion, when I mention “deflation” I am referring to the CPI going below zero. Also, I have been using the term “deflationary pressures” as a term to describe deflationary manifestations within an environment that is still overall inflationary but heading towards deflation.]
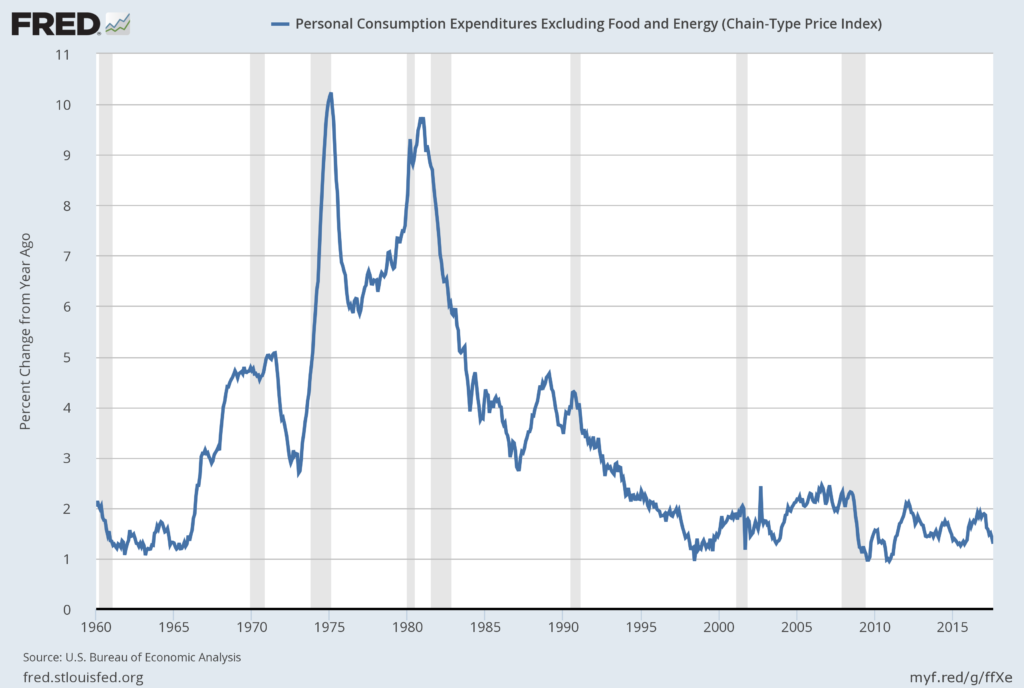
Of note, the shortfall between the Federal Reserve’s stated inflation target (2% on the (Core) PCE Price Index) and the actual inflation reading continues. For years there has been a continued inability for the 2% inflation target to be sustained.
Below is a chart of the “Core PCE” price measure as of the September 29, 2017 update, showing data through August, with a current reading of 1.3%:
source: U.S. Bureau of Economic Analysis, Personal Consumption Expenditures Excluding Food and Energy (Chain-Type Price Index) [PCEPILFE], retrieved from FRED, Federal Reserve Bank of St. Louis; accessed October 1, 2017:
While there appears (as seen in forecasts and surveys) to be little if any general concern about deflation, recent commentary, including that from Janet Yellen in the September 20 FOMC Press Conference and in the September 26 speech concerning inflation is notable. A couple of excerpts from the September 26 speech titled “Inflation, Uncertainty, And Monetary Policy” (pdf):
As I will discuss, this low inflation likely reflects factors whose influence should fade over time. But as I will also discuss, many uncertainties attend this assessment, and downward pressures on inflation could prove to be unexpectedly persistent. My colleagues and I may have misjudged the strength of the labor market, the degree to which longer-run inflation expectations are consistent with our inflation objective, or even the fundamental forces driving inflation.
also:
Based on analyses of this sort, my colleagues and I currently think that this year’s low inflation is probably temporary, so we continue to anticipate that inflation is likely to stabilize around 2 percent over the next few years. But our understanding of the forces driving inflation is imperfect, and we recognize that something more persistent may be responsible for the current undershooting of our longer-run objective. Accordingly, we will monitor incoming data closely and stand ready to modify our views based on what we learn.Although we judge that inflation will most likely stabilize around 2 percent over the next few years, the odds that it could turn out to be noticeably different are considerable.
–
Consumer Spending
In the March 23, 2017 post (“‘Hidden’ Weakness In Consumer Spending?“) I wrote of various indications that consumer spending may be (substantially) less than what is depicted by various mainstream indicators, including overall retail sales. This weakness (including the implications stemming from the substantial number of retail store closures) has widespread consequences for the U.S. economy as discussed in previous posts, including the June 13, 2011 post titled “The Changing Nature Of Retail – Economic Implications.”
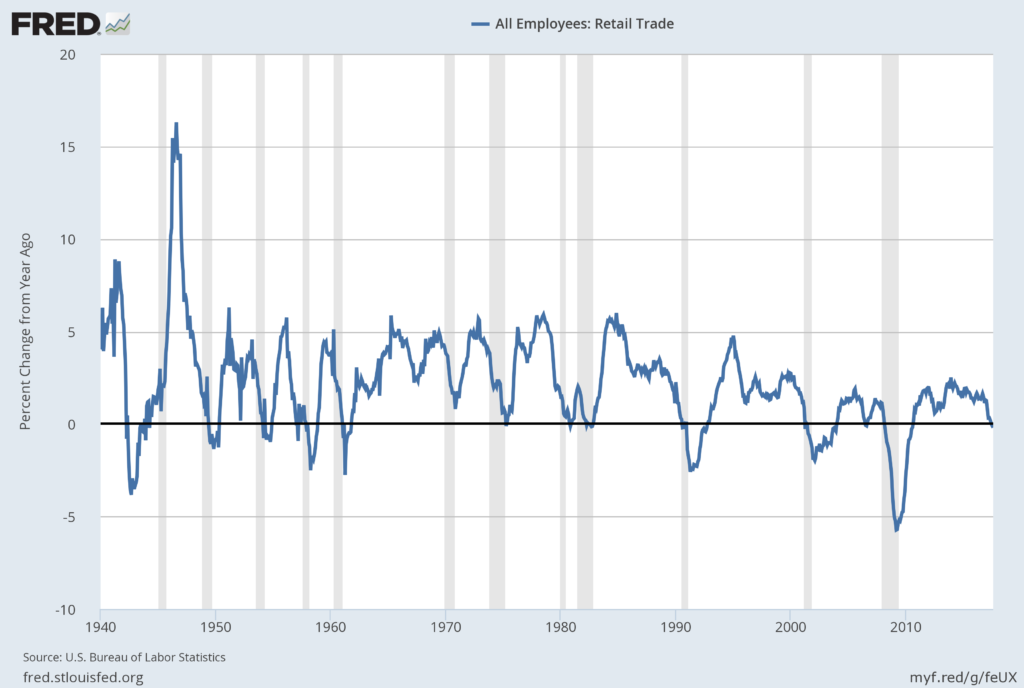
While I continue to believe that the various retail sales figures are overstated, one tangential long-term indicator that is notable in its current trend is that of “All Employees: Retail Trade” as depicted below on a “Percent Change From Year Ago” basis, through August with last value of -.2 Percent, last updated September 1, 2017:
source: U.S. Bureau of Labor Statistics, All Employees: Retail Trade [USTRADE], retrieved from FRED, Federal Reserve Bank of St. Louis; September 29, 2017:
Another worrisome aspect is the peaking in auto sales and the (current-era) dynamics and structure of the auto industry with the accompanying widespread economic implications.
–
Rail Freight Carloads
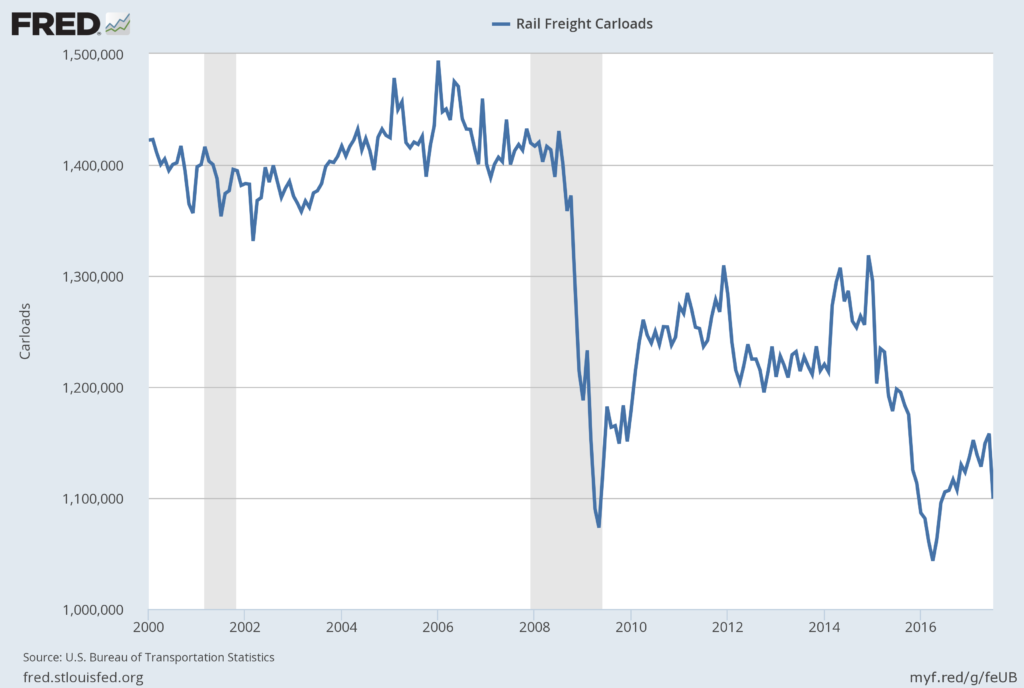
Another notable measure is that of “Rail Freight Carloads,” as depicted below, through July with last value of 1,099,399, last updated September 15, 2017:
source: U.S. Bureau of Transportation Statistics, Rail Freight Carloads [RAILFRTCARLOADSD11], retrieved from FRED, Federal Reserve Bank of St. Louis; September 29, 2017:
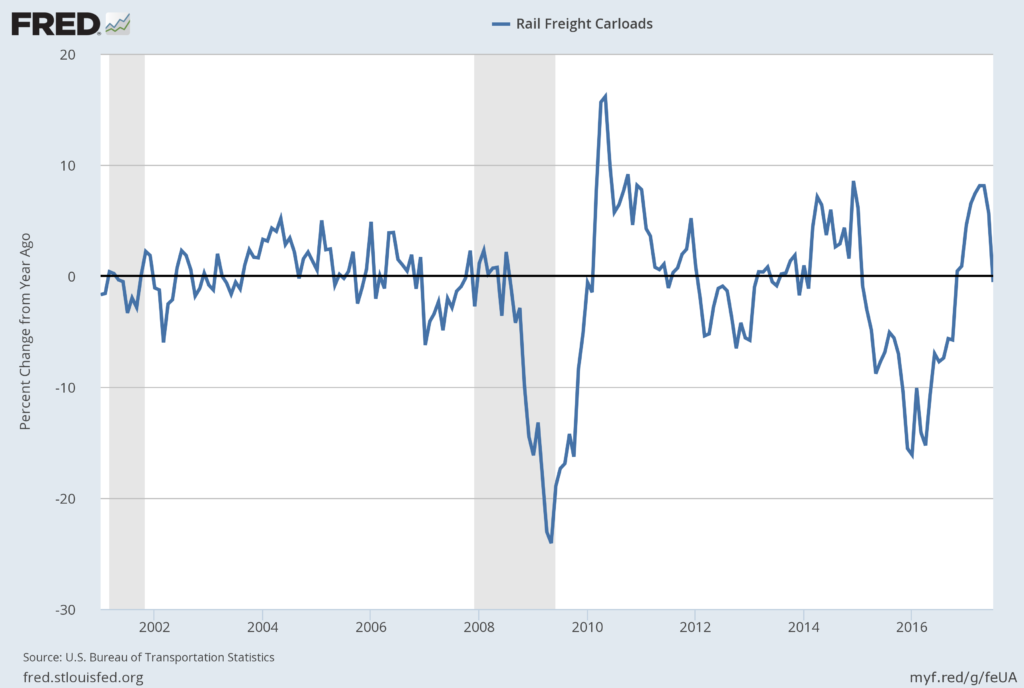
Here is the same measure on a “Percent Change From Year Ago” basis:
–
Other Indicators
As mentioned previously, many other indicators discussed on this site indicate economic weakness or economic contraction, if not outright (gravely) problematical economic conditions.
_____
The Special Note summarizes my overall thoughts about our economic situation
SPX at 2519.36 as this post is written
No comments:
Post a Comment