Throughout this site there are many charts of economic indicators. At this time, the readings of various indicators regarding consumer spending are especially notable. While many are still indicating significant growth, are these indicators accurately portraying the overall situation?
Below are a small sampling of consumer spending charts that depict significant or at least stable degrees of growth, and a brief comment for each:
Retail Sales
Retail sales levels appear to be growing. An overall long-term view is shown below, with current value (as of March 15, 2017) of $473,991 Million:
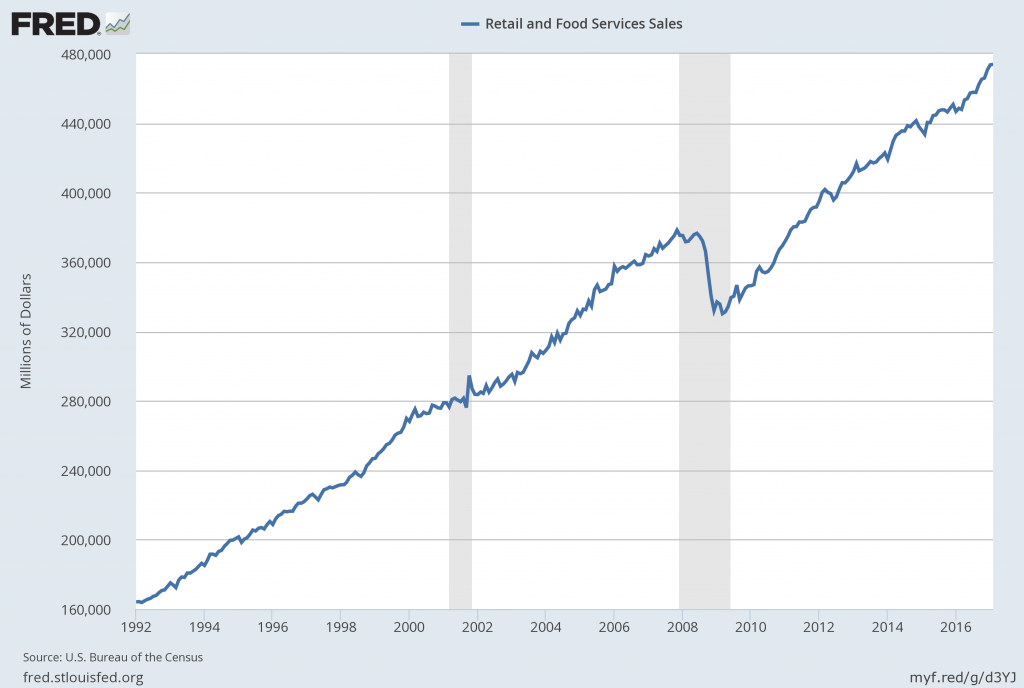
source: U.S. Bureau of the Census, Retail and Food Services Sales [RSAFS], retrieved from FRED, Federal Reserve Bank of St. Louis March 18, 2017;
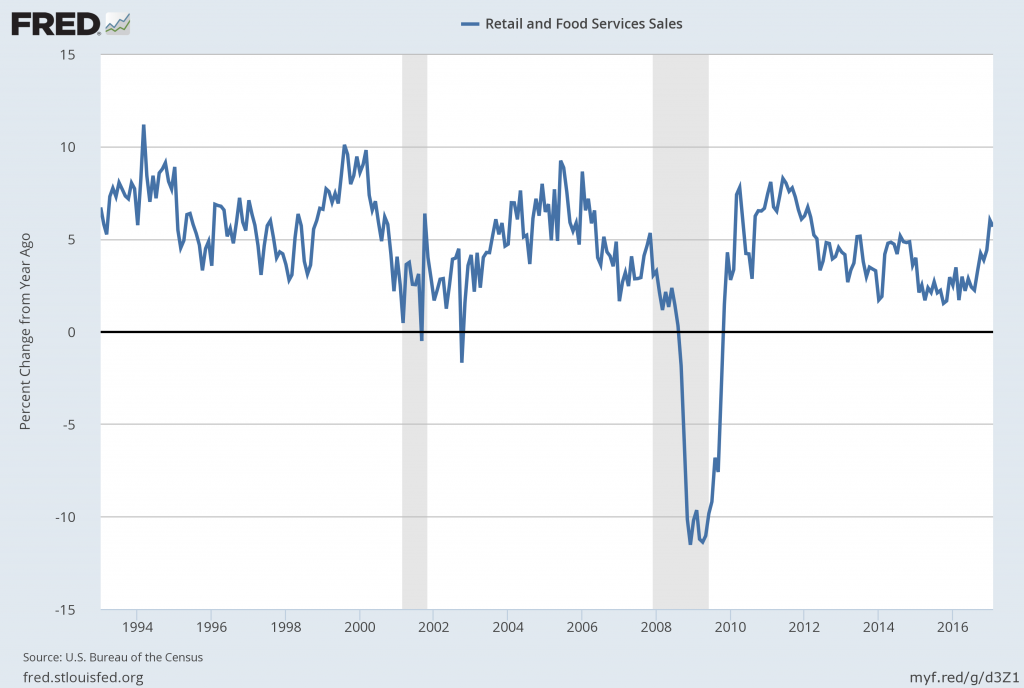
The same information provided on a "percent change from year ago" basis, with a current value of 5.7%:
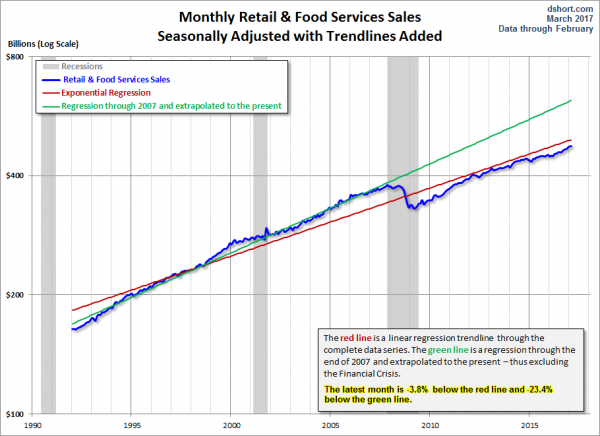
Lastly, a long-term chart with trendlines, as seen in the Doug Short post of March 15, 2017, titled "Retail Sales: February Growth Continues to Improve, As Expected":
comment:
As seen above, there doesn't appear to be recent discernible weakness in the retail spending trend as seen in this "Retail and Food Services Sales" [RSAFS] measure.
Consumer Spending
While there are many ways to judge consumer spending, the Gallup measure for consumer spending (on a "self-reported" basis) shows higher levels relative to the post-2008, as shown below:
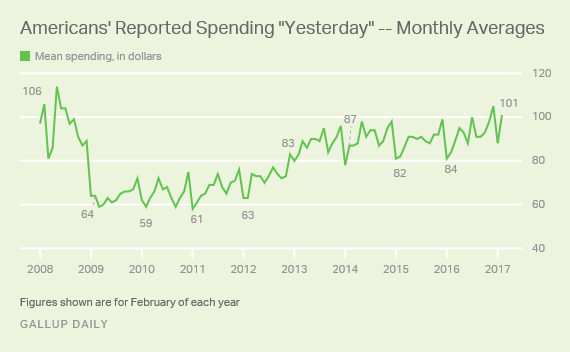
source: Gallup "US Consumers' February Spending Highest Since 2008" March 6, 2017
GDP Estimates
While, of course, GDP encompasses more than consumer spending alone, current estimates of 2017 GDP remain at levels that would appear to be roughly consistent with the stable, significant spending depicted above. For example, the Wall Street Journal Economic Forecast Survey of March 2017 (summarized in the March 16 post titled "The March 2017 Wall Street Journal Economic Forecast Survey") shows a 2017 GDP estimate of 2.4%. This is close to the Federal Reserve's current (March 2017 FOMC Economic Projections (pdf)) median estimate of 2.1%.
As additional reference, the New York Federal Reserve's GDP Nowcasting Report of March 17, 2017 shows a Q1 estimate of 2.8% for Q1 and 2.5% for Q2.
comment:
As seen above, U.S. GDP expectations don't appear to show discernible weakness in the trend.
Store Closings
Over the recent past there have been a substantial number of retail store closings. While reliable statistics on the closings and announcements of such don't appear to be readily available, the numbers - as well as the results posted by various retailers - appear to indicate a (highly) problematical trend. The incidence and timing of such closings - in the face of seemingly solid overall retail spending, as discussed above - seem to indicate that some significant factor(s) are contributing to a decline in "bricks and mortar" retail sales. As one might expect, the weakness appears to be largely effecting marginal stores at this point.
While many would attribute such weakness in "bricks and mortar" stores to online sales - and especially Amazon - is online sales the primary factor? While - because of many factors - it is difficult to say with certainty, online sales is undoubtedly a factor in the physical store closures. However, I believe that a greater factor is retail spending that is not as strong as the aggregate trends shown above.
The closure of retail stores is of great significance to the U.S. economy. Retail stores factor into many aspects of economic and financial activity, as discussed in previous posts, including the June 13, 2011 post titled "The Changing Nature Of Retail - Economic Implications." The continued accelerating nature of online sales has many implications for the economy and businesses.
Along these lines, an excerpt with regard to the effect store closings have on small towns, as seen in The Wall Street Journal article of January 20, 2017, titled "Mall's Woes Ripple Across Small Town":
Malls in smaller U.S. cities are often linchpins of local economies and their struggles can have a ripple effect, from jobs and tax revenues to the fortunes of logistics and transportation companies that provide trucking and inventory support for stores. Creditors who invest in mortgage securities tied to troubled malls face the risk of default.
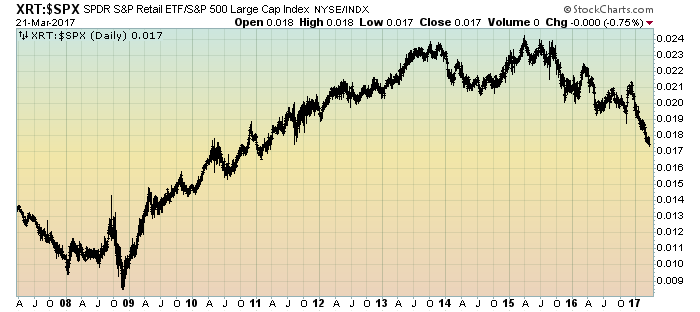
Lagging Retail Stocks
Another factor that seems to be indicating weakness in consumer spending is the ratio of retail stocks (XRT as a proxy) to the S&P500. As seen in the 10-year chart below, XRT as a ratio to the S&P500 has been declining since roughly mid-2015:
(click on chart to enlarge image)(chart courtesy of StockCharts.com; chart creation and annotation by the author)
GDP Estimates - GDP Now
The GDP estimate provided by the Federal Reserve Bank of Atlanta "GDP Now" is distinctly different than that mentioned above. As of the March 16, 2017 update, the estimate for the 1st Quarter of 2017 is .9%. While this estimate - which has been steadily declining - may or may not prove accurate, such a level would appear to be at least somewhat inconsistent with the stable, significant aggregate retail spending depicted in the "Retail And Food Services Sales" and other measures mentioned above.
As well, many other indicators - some mentioned on this site - indicate weakness in economic growth if not outright (substantially) problematical economic conditions.
_____
The Special Note summarizes my overall thoughts about our economic situation
SPX at 2348.45 as this post is written
No comments:
Post a Comment