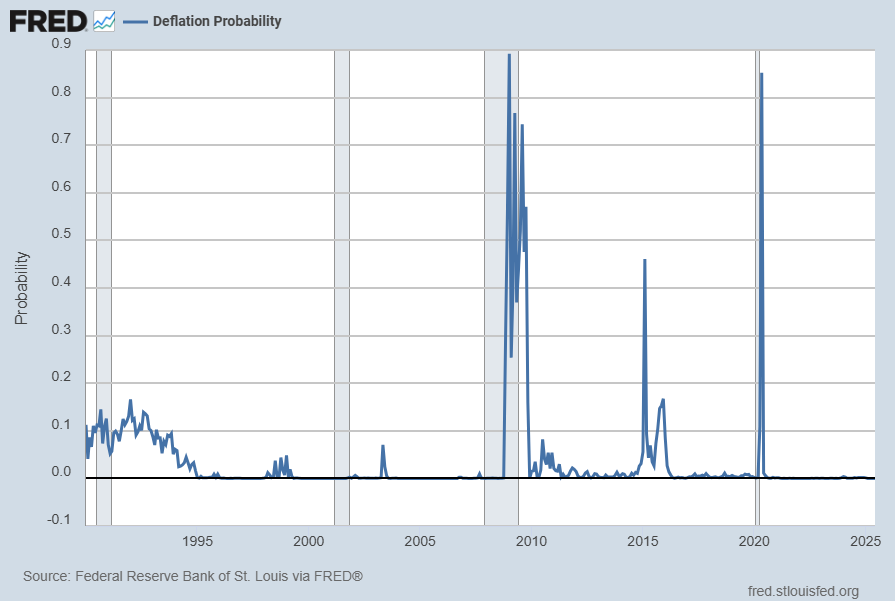
For reference, below is a chart of the St. Louis Fed Price Pressures Measures – Deflation Probability [FRED STLPPMDEF] through June 2025.
While I do not necessarily agree with the current readings of the measure, I view this as a proxy of U.S. deflation probability.
A description of this measure, as seen in FRED:
This series measures the probability that the personal consumption expenditures price index (PCEPI) inflation rate (12-month changes) over the next 12 months will fall below zero.
The chart, on a monthly basis from January 1990 – June 2025, with a last reading of .00000, last updated on June 27, 2025:
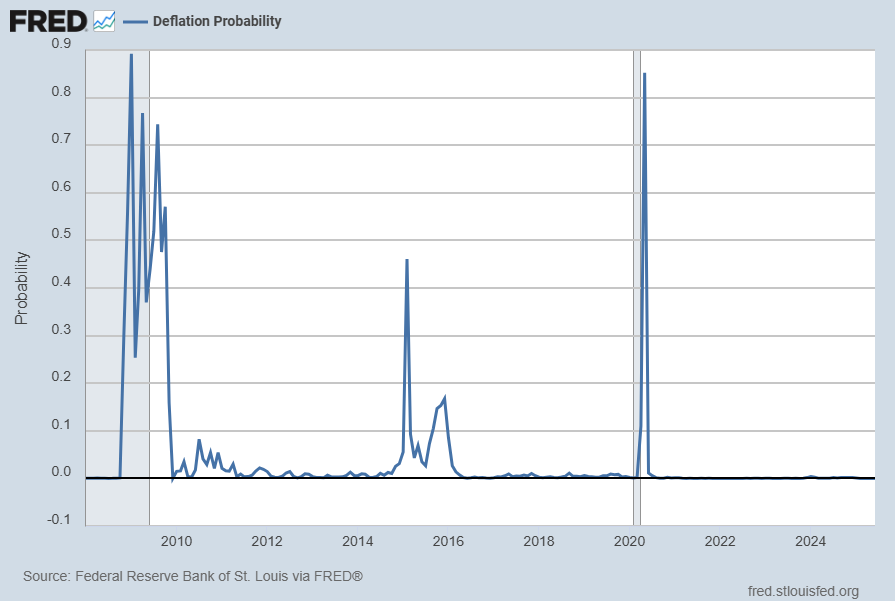
Here is this same U.S. deflation probability measure since 2008:
source: Federal Reserve Bank of St. Louis, Deflation Probability [STLPPMDEF], retrieved from FRED, Federal Reserve Bank of St. Louis; accessed June 27, 2025: https://fred.stlouisfed.org/series/STLPPMDEF
_________
I post various economic indicators and indices because I believe they should be carefully monitored. However, as those familiar with this site are aware, I do not necessarily agree with what they depict or imply.
_____
The Special Note summarizes my overall thoughts about our economic situation
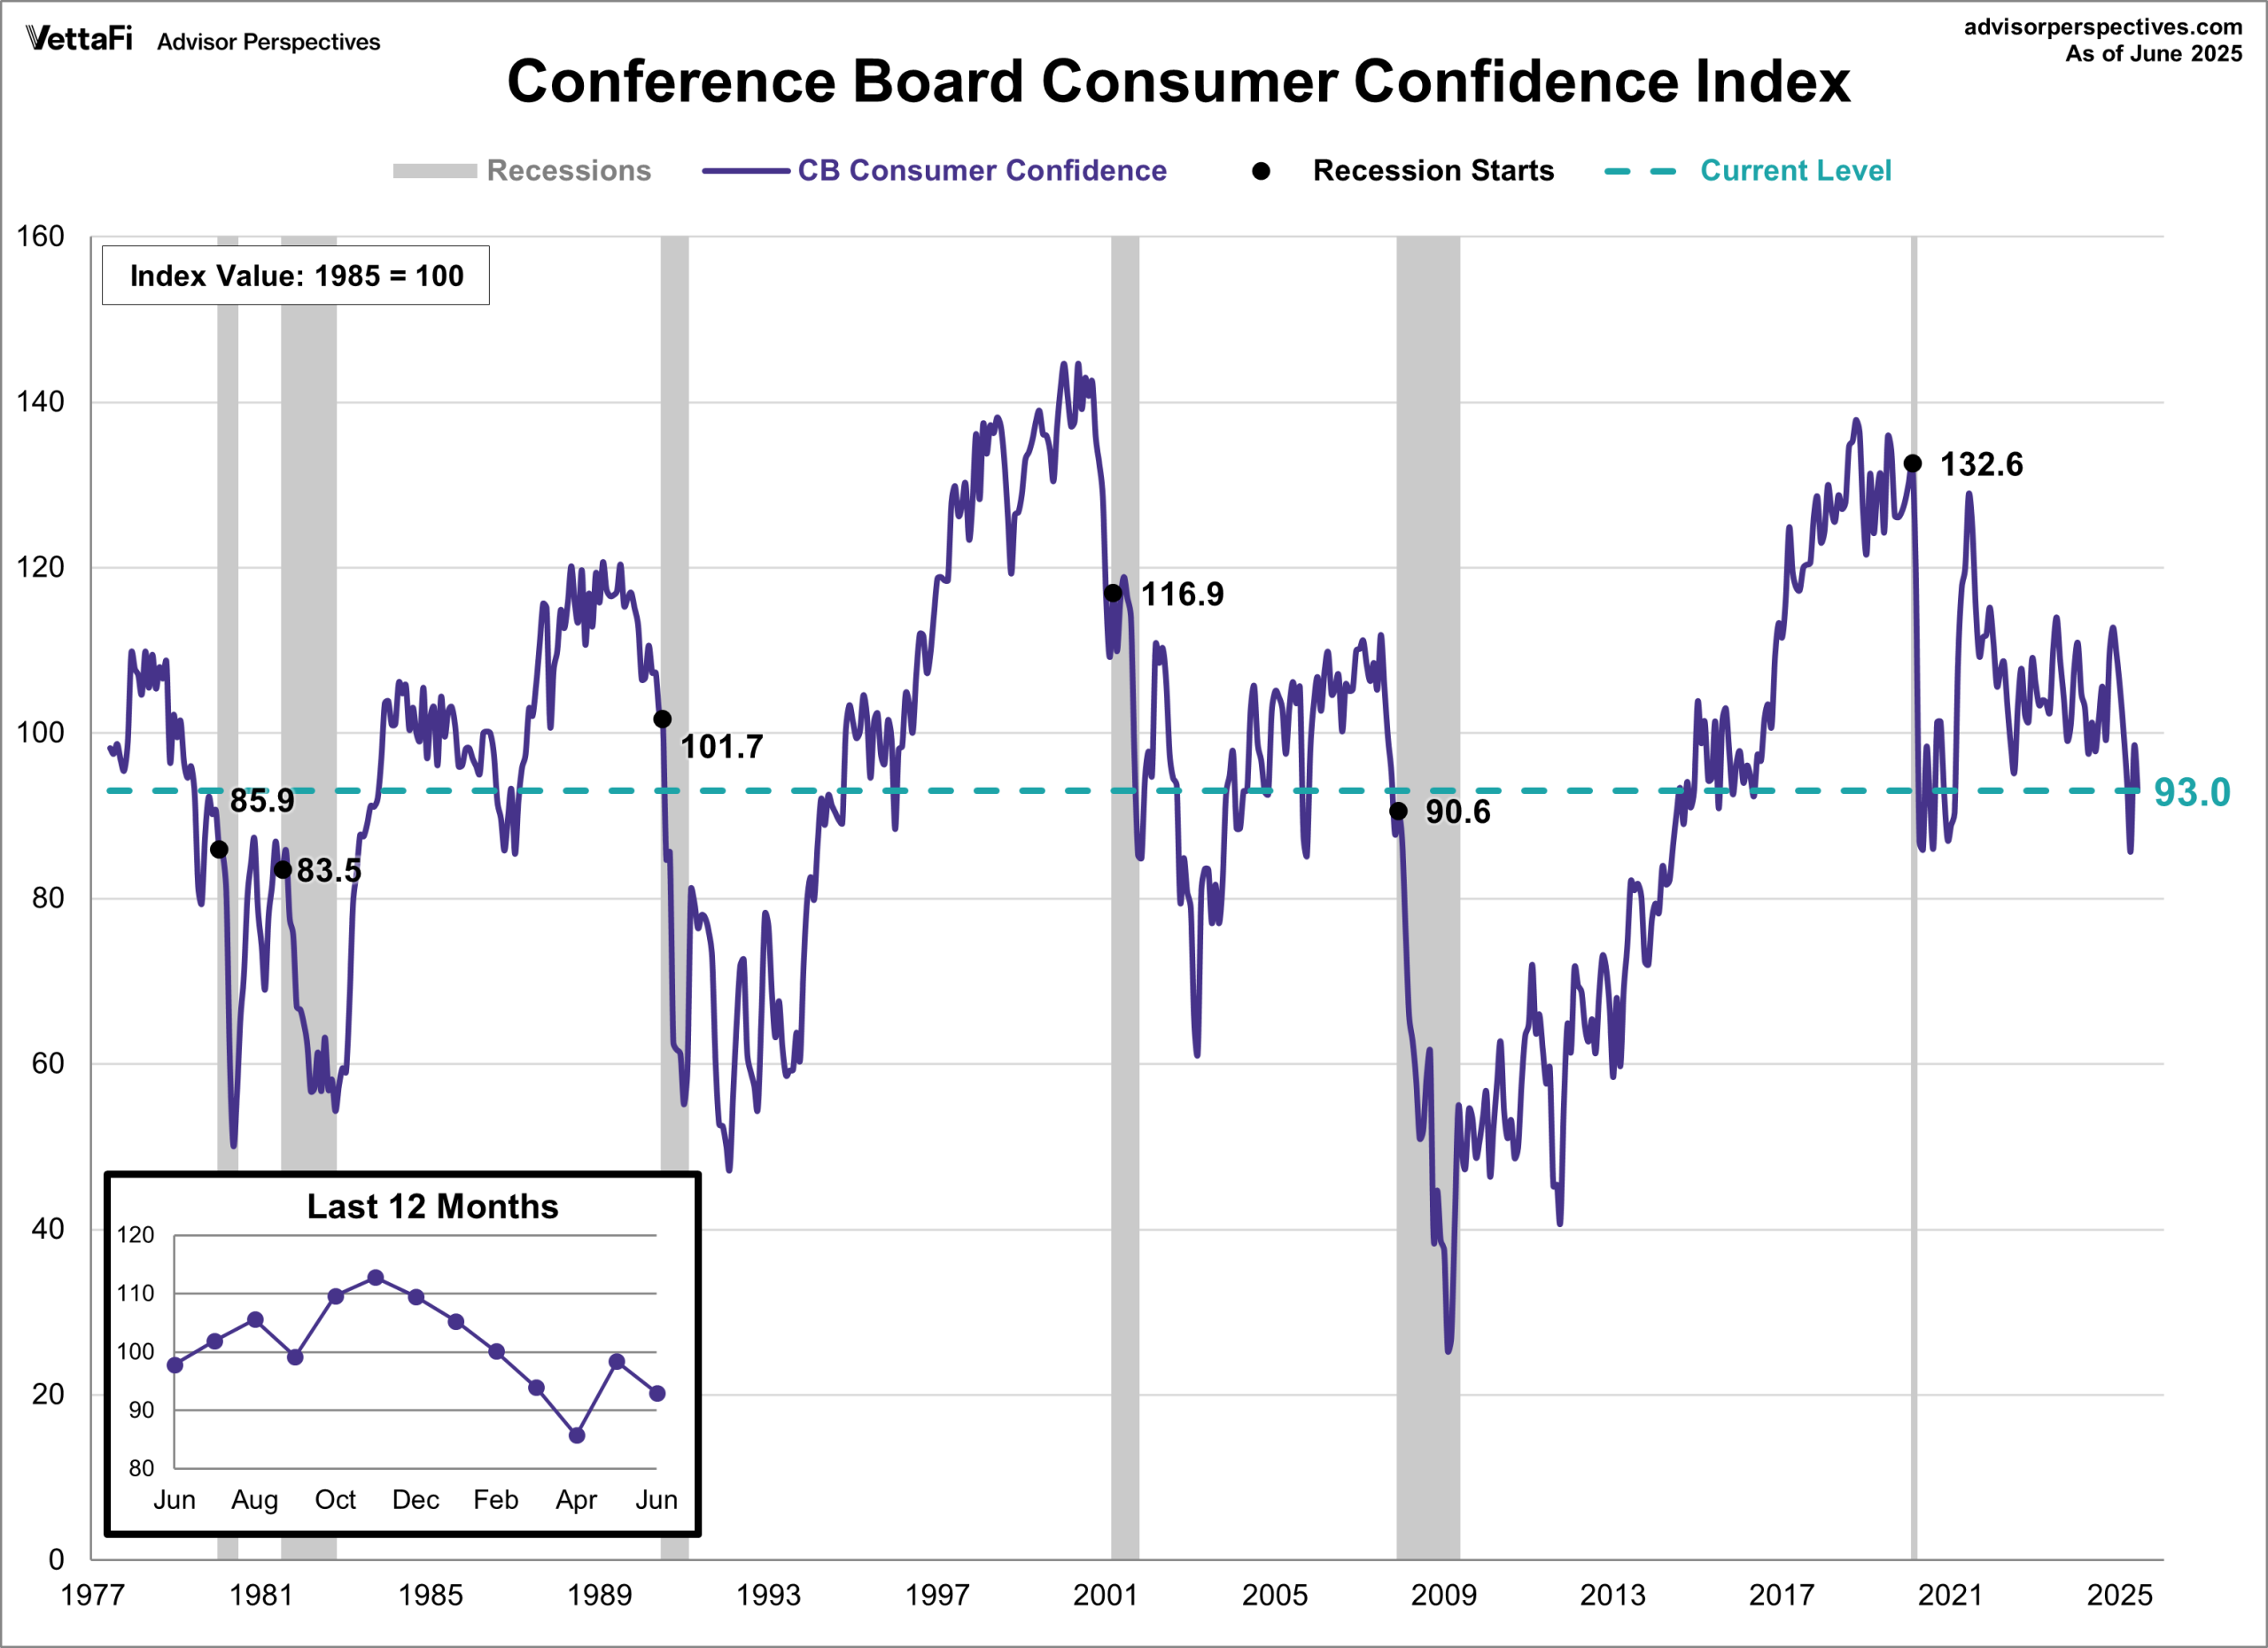
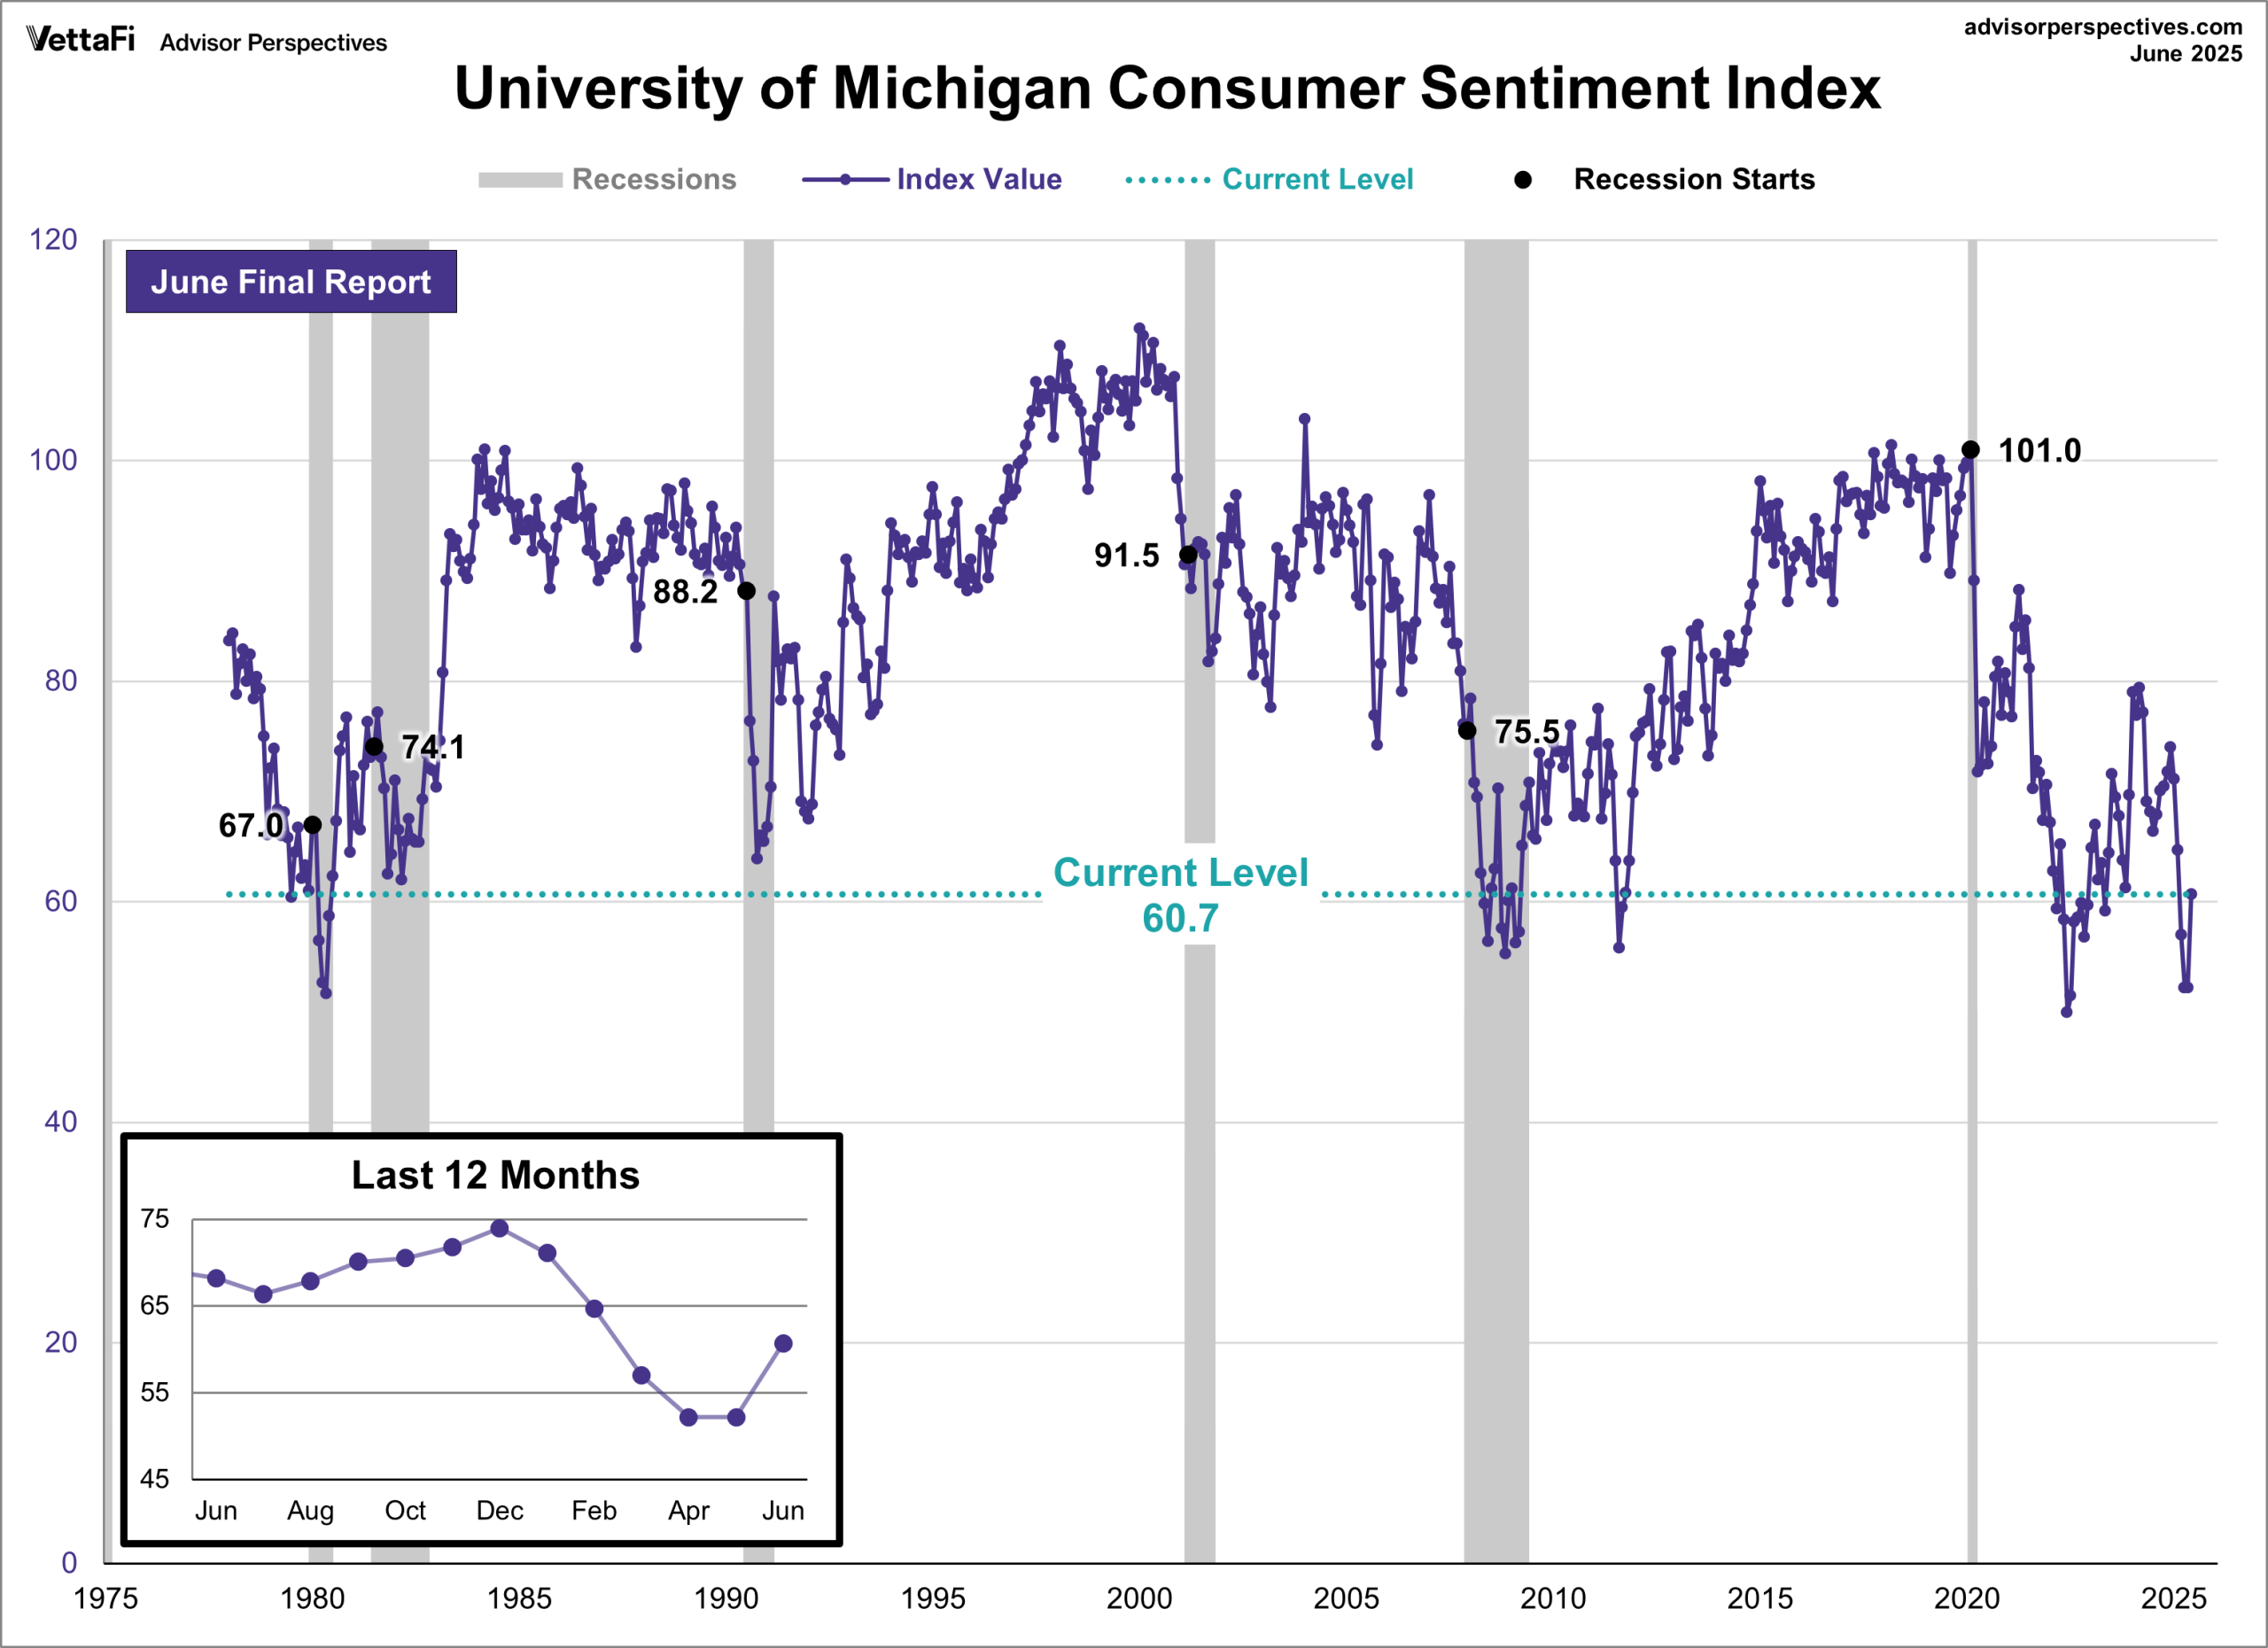
Advisor Perspectives had a post of June 27, 2025 (“Consumer Sentiment Increases for First Time in Six Months“) that displays the latest Conference Board Consumer Confidence and University of Michigan Consumer Sentiment Index charts. They are presented below:
(click on charts to enlarge images)
–
–
While I don’t believe that confidence surveys should be overemphasized, I find these readings and trends to be notable, especially in light of a variety of other highly disconcerting measures highlighted throughout this site.
_____
The Special Note summarizes my overall thoughts about our economic situation
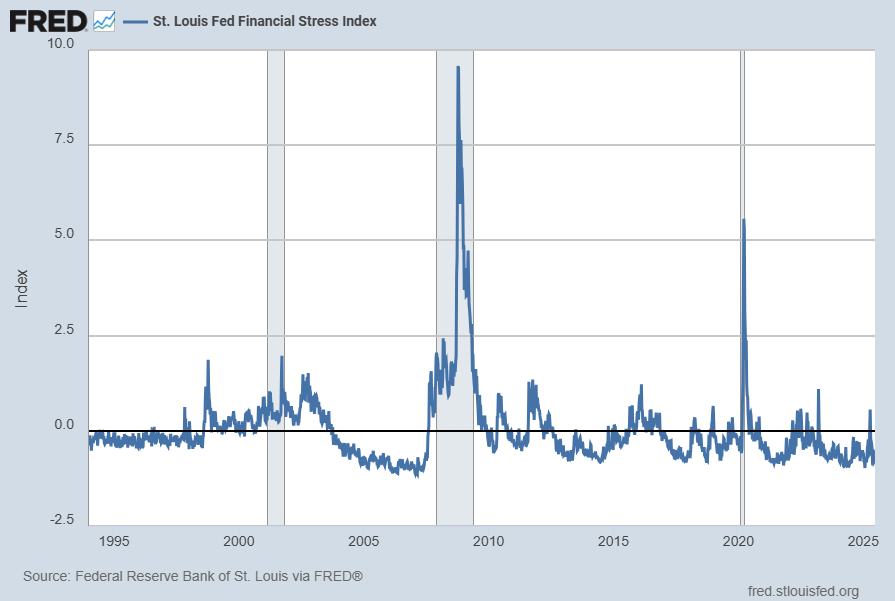
The St. Louis Fed’s Financial Stress Index (STLFSI4) is one index that is supposed to measure stress in the financial system. Its reading as of the June 26, 2025 update (reflecting data through June 20, 2025) is -.6635:
source: Federal Reserve Bank of St. Louis, St. Louis Fed Financial Stress Index [STLFSI4], retrieved from FRED, Federal Reserve Bank of St. Louis; accessed June 26, 2025: https://fred.stlouisfed.org/series/STLFSI4
Of course, there are a variety of other measures and indices that are supposed to measure financial stress and other related issues, both from the Federal Reserve as well as from private sources.
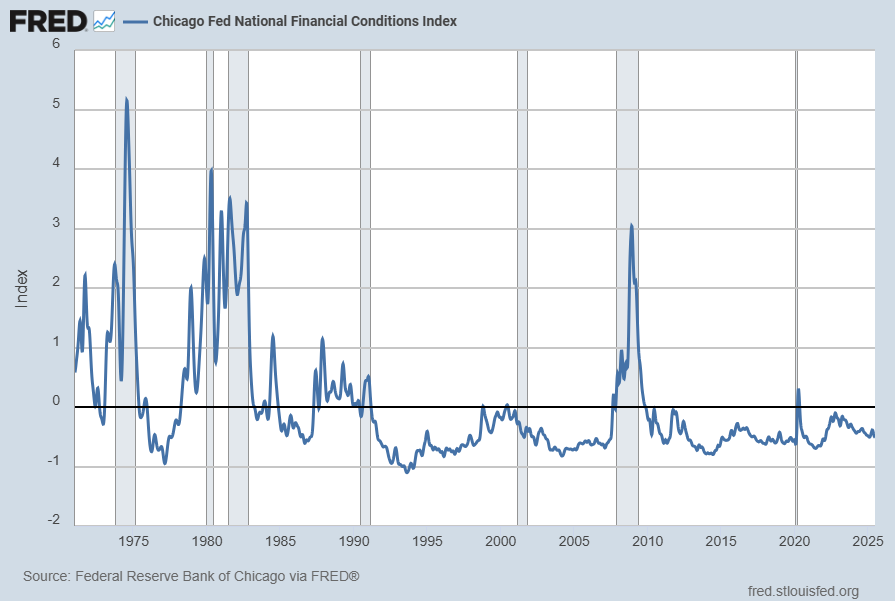
Two other indices that I regularly monitor include the Chicago Fed National Financial Conditions Index (NFCI) as well as the Chicago Fed Adjusted National Financial Conditions Index (ANFCI).
Here are summary descriptions of each, as seen in FRED:
The National Financial Conditions Index (NFCI) measures risk, liquidity and leverage in money markets and debt and equity markets as well as in the traditional and “shadow” banking systems. Positive values of the NFCI indicate financial conditions that are tighter than average, while negative values indicate financial conditions that are looser than average.
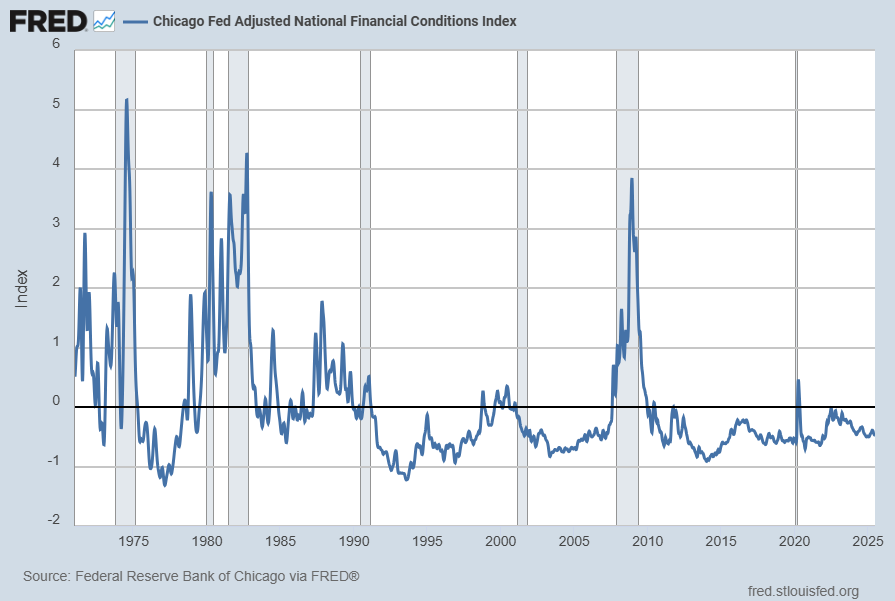
The adjusted NFCI (ANFCI). This index isolates a component of financial conditions uncorrelated with economic conditions to provide an update on how financial conditions compare with current economic conditions.
For further information, please visit the Federal Reserve Bank of Chicago’s web site:
Below are the most recently updated charts of the NFCI and ANFCI, respectively.
The NFCI chart below was last updated on June 25, 2025 incorporating data from January 8, 1971 through June 20, 2025 on a weekly basis. The June 20 value is -.51043:
Data Source: FRED, Federal Reserve Economic Data, Federal Reserve Bank of St. Louis; accessed June 26, 2025: http://research.stlouisfed.org/fred2/series/NFCI
–
The ANFCI chart below was last updated on June 25, 2025 incorporating data from January 8, 1971 through June 20, 2025, on a weekly basis. The June 20 value is -.47560:
Data Source: FRED, Federal Reserve Economic Data, Federal Reserve Bank of St. Louis; accessed June 26, 2025: http://research.stlouisfed.org/fred2/series/ANFCI
_________
I post various indicators and indices because I believe they should be carefully monitored. However, as those familiar with this site are aware, I do not necessarily agree with what they depict or imply.
_____
The Special Note summarizes my overall thoughts about our economic situation
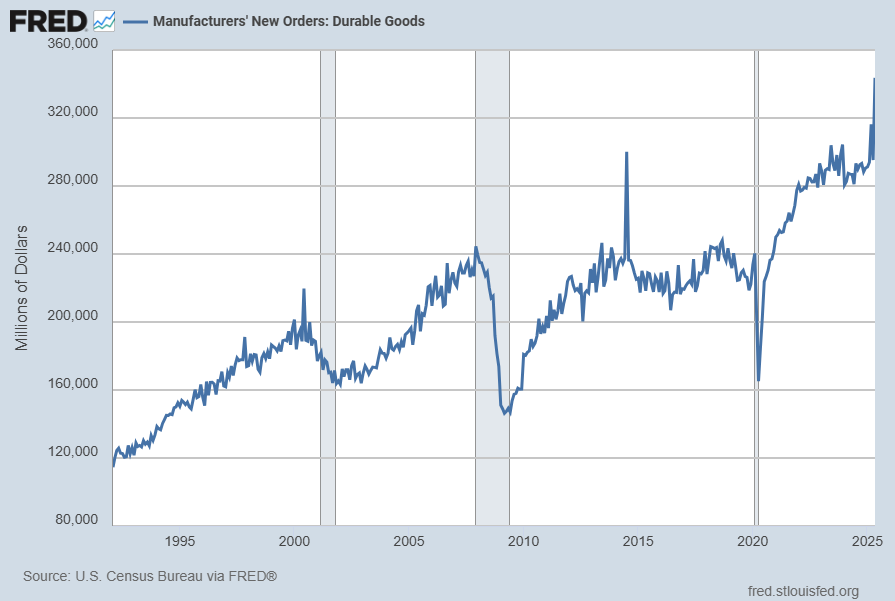
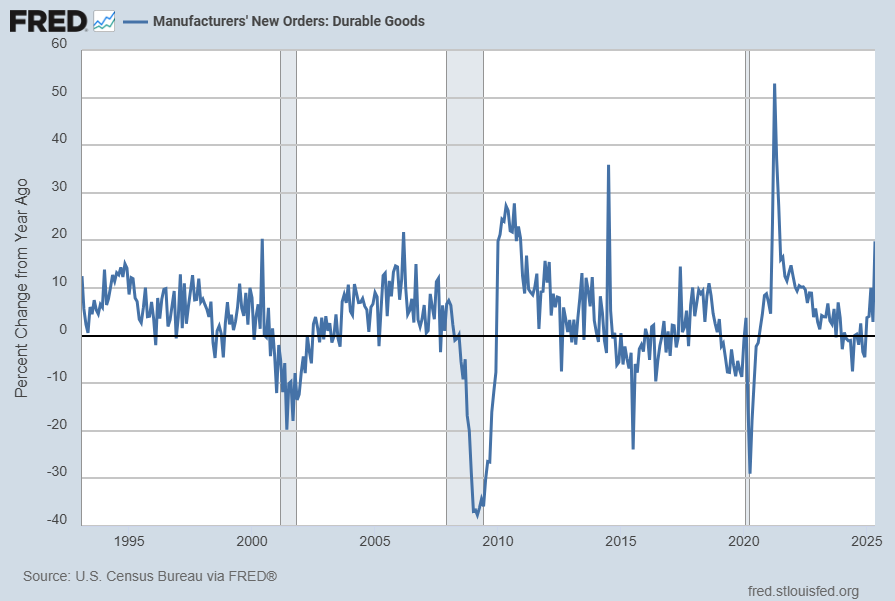
Many people place emphasis on Durable Goods New Orders as a prominent economic indicator and/or leading economic indicator.
For reference, below are two charts depicting this measure.
First, from the St. Louis Fed site (FRED), a chart through May 2025, updated on June 26, 2025. This value is $343,585 ($ Millions):
(click on charts to enlarge images)
–
Second, here is the chart depicting this measure on a “Percent Change from a Year Ago” basis, with a last value of 19.8%:
Data Source: FRED, Federal Reserve Economic Data, Federal Reserve Bank of St. Louis: Manufacturers’ New Orders: Durable Goods [DGORDER]; U.S. Department of Commerce: Census Bureau; accessed June 26, 2025; http://research.stlouisfed.org/fred2/series/DGORDER
_________
I post various indicators and indices because I believe they should be carefully monitored. However, as those familiar with this site are aware, I do not necessarily agree with what they depict or imply.
_____
The Special Note summarizes my overall thoughts about our economic situation
The following is an update of various indicators that are supposed to predict and/or depict economic activity. These indicators have been discussed in previous blog posts:
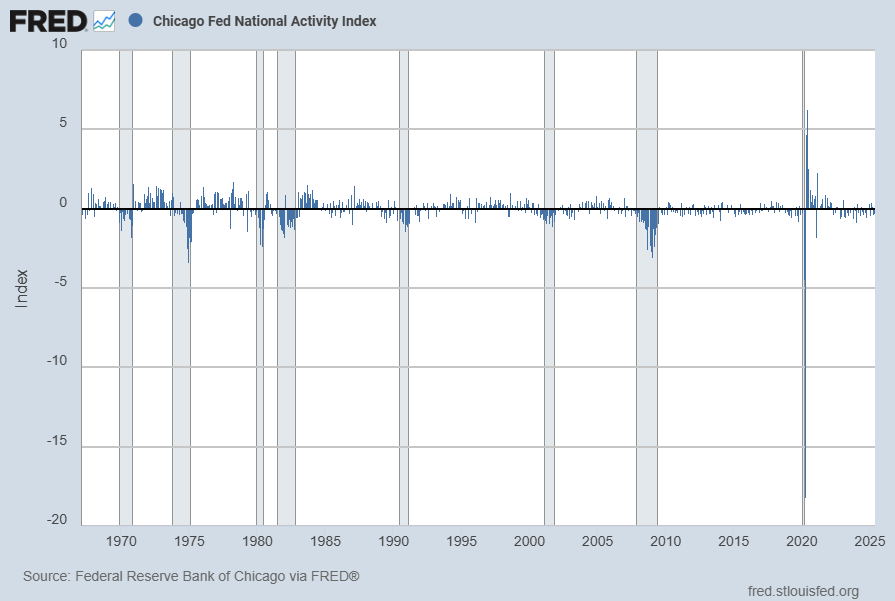
The June 2025 Chicago Fed National Activity Index (CFNAI) updated as of June 26, 2025:
The CFNAI, with a current reading of -.28:
source: Federal Reserve Bank of Chicago, Chicago Fed National Activity Index [CFNAI], retrieved from FRED, Federal Reserve Bank of St. Louis; accessed June 26, 2025: https://fred.stlouisfed.org/series/CFNAI
The CFNAI-MA3, with a current reading of -.16:
source: Federal Reserve Bank of Chicago, Chicago Fed National Activity Index: Three Month Moving Average [CFNAIMA3], retrieved from FRED, Federal Reserve Bank of St. Louis; accessed June 26, 2025: https://fred.stlouisfed.org/series/CFNAIMA3
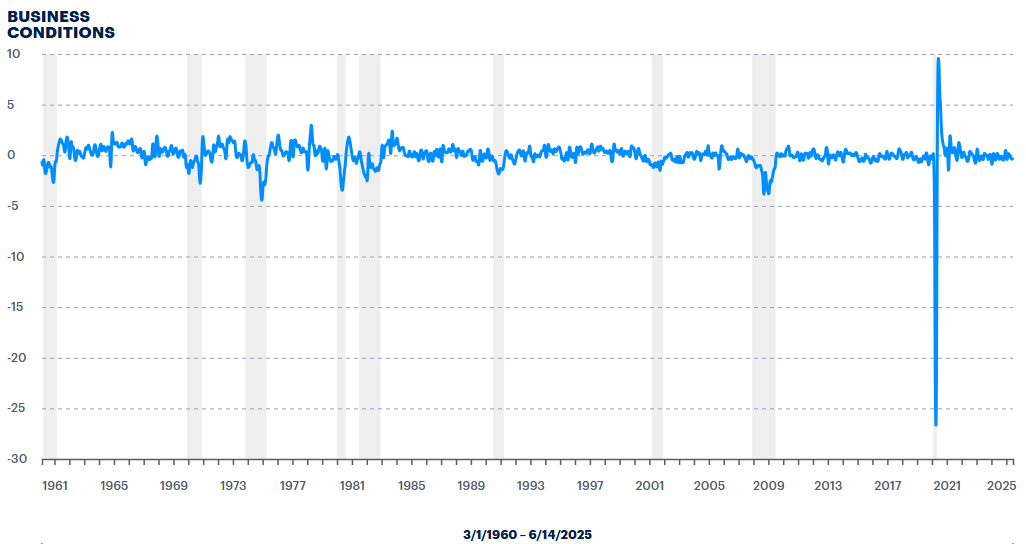
The ADS Index as of June 18, 2025, reflecting data from March 1, 1960 through June 14, 2025, with last value -.236785:
–
The Conference Board Leading Economic Index (LEI), Coincident Economic Index (CEI), and Lagging Economic Index (LAG):
As per the June 20, 2025 Conference Board press release the LEI was 99.0 in May, the CEI was 115.1 in May, and the LAG was 119.6 in May.
An excerpt from the release:
“The LEI for the US fell again in May, but only marginally,” said Justyna Zabinska-La Monica, Senior Manager, Business Cycle Indicators, at The Conference Board. “The recovery of stock prices after the April drop was the main positive contributor to the Index. However, consumers’ pessimism, persistently weak new orders in manufacturing, a second consecutive month of rising initial claims for unemployment insurance, and a decline in housing permits weighed on the Index, leading to May’s overall decline. With the substantial negatively revised drop in April and the further downtick in May, the six-month growth rate of the Index has become more negative, triggering the recession signal. The Conference Board does not anticipate recession, but we do expect a significant slowdown in economic growth in 2025 compared to 2024, with real GDP growing at 1.6% this year and persistent tariff effects potentially leading to further deceleration in 2026.”
_________
I post various indicators and indices because I believe they should be carefully monitored. However, as those familiar with this site are aware, I do not necessarily agree with what they depict or imply.
_____
The Special Note summarizes my overall thoughts about our economic situation
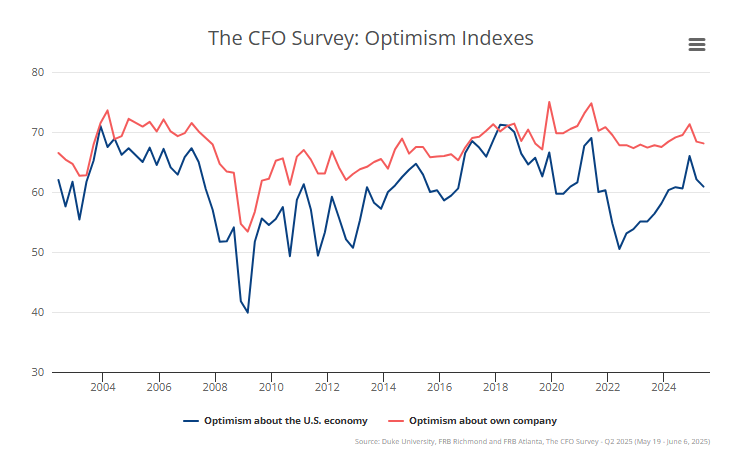
On June 25, 2025 The CFO Survey was released. It contains a variety of statistics regarding how CFOs view business and economic conditions.
In the CFO Survey press release, I found the following to be the most notable excerpts – although I don’t necessarily agree with them:
In the survey, which closed on June 6, CFOs revised higher their own-firm unit cost and price growth projections for 2025, while reducing their revenue growth expectations. Financial executives also lowered their expectations for real GDP growth over the next four quarters to 1.4 percent, from 1.9 percent in the prior survey. Moreover, the probability respondents assigned to negative year-ahead economic growth jumped to 23 percent from 15 percent last quarter.
also:
“Perhaps the most striking facet of the outlook for those that report tariffs and trade policy as a pressing concern is that their nominal sales revenue expectations fail to outpace their price growth projections, which means their real revenue growth is expected to contract in 2025,” said Atlanta Fed economist Brent Meyer.
The CFO Survey contains an Optimism Index chart, with the blue line showing U.S. Optimism (with regard to the economy) at 60.9, as seen below:
—
It should be interesting to see how well the CFOs predict business and economic conditions going forward. I discussed past various aspects of this, and the importance of these predictions, in the July 9, 2010 post titled “The Business Environment”.
(past posts on CEO and CFO surveys can be found under the “CFO and CEO Confidence” label)
_____
I post various economic forecasts because I believe they should be carefully monitored. However, as those familiar with this site are aware, I do not necessarily agree with many of the consensus estimates and much of the commentary in these forecast surveys.
_____
The Special Note summarizes my overall thoughts about our economic situation
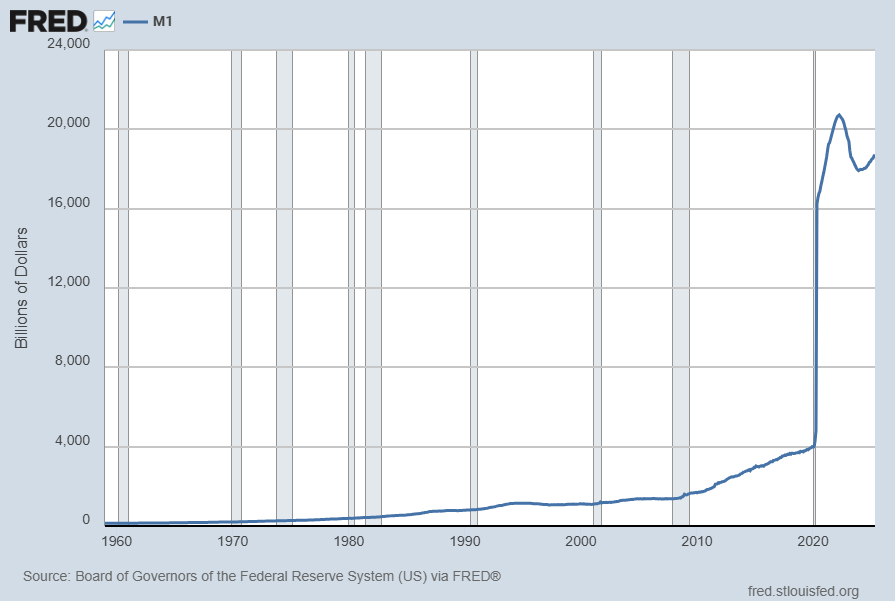
For reference purposes, below are two sets of charts depicting growth in the money supply.
The first shows the M1, defined in FRED as the following:
Before May 2020, M1 consists of (1) currency outside the U.S. Treasury, Federal Reserve Banks, and the vaults of depository institutions; (2) demand deposits at commercial banks (excluding those amounts held by depository institutions, the U.S. government, and foreign banks and official institutions) less cash items in the process of collection and Federal Reserve float; and (3) other checkable deposits (OCDs), consisting of negotiable order of withdrawal, or NOW, and automatic transfer service, or ATS, accounts at depository institutions, share draft accounts at credit unions, and demand deposits at thrift institutions.
Beginning May 2020, M1 consists of (1) currency outside the U.S. Treasury, Federal Reserve Banks, and the vaults of depository institutions; (2) demand deposits at commercial banks (excluding those amounts held by depository institutions, the U.S. government, and foreign banks and official institutions) less cash items in the process of collection and Federal Reserve float; and (3) other liquid deposits, consisting of OCDs and savings deposits (including money market deposit accounts). Seasonally adjusted M1 is constructed by summing currency, demand deposits, and OCDs (before May 2020) or other liquid deposits (beginning May 2020), each seasonally adjusted separately.
Here is the “M1 Money Stock” (seasonally adjusted) chart, updated on June 24, 2025 depicting data through May 2025, with a value of $18,712.60 Billion:
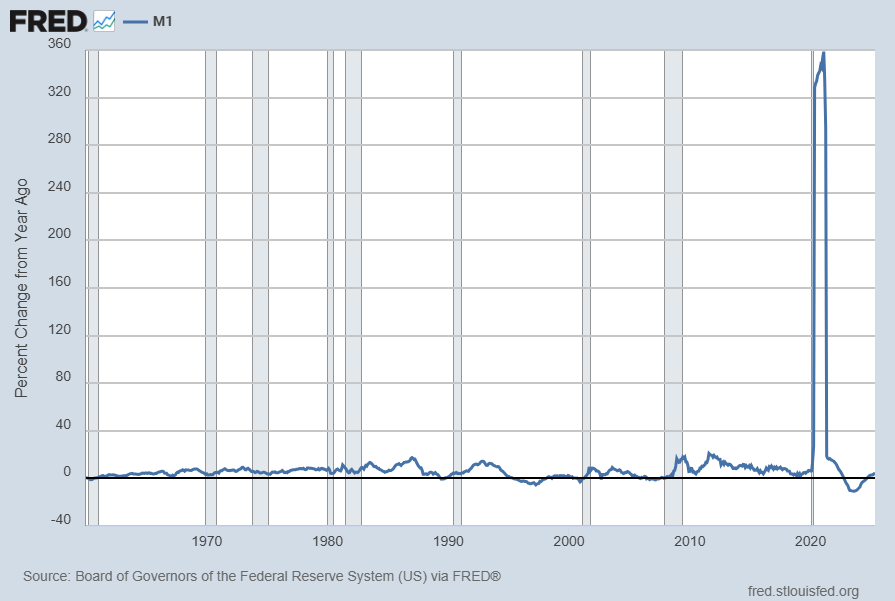
Here is the “M1 Money Stock” chart on a “Percent Change From Year Ago” basis, with a current value of 3.9%:
Data Source: Board of Governors of the Federal Reserve System (US), M1 Money Stock [M1SL], retrieved from FRED, Federal Reserve Bank of St. Louis; accessed June 24, 2025: https://fred.stlouisfed.org/series/M1SL
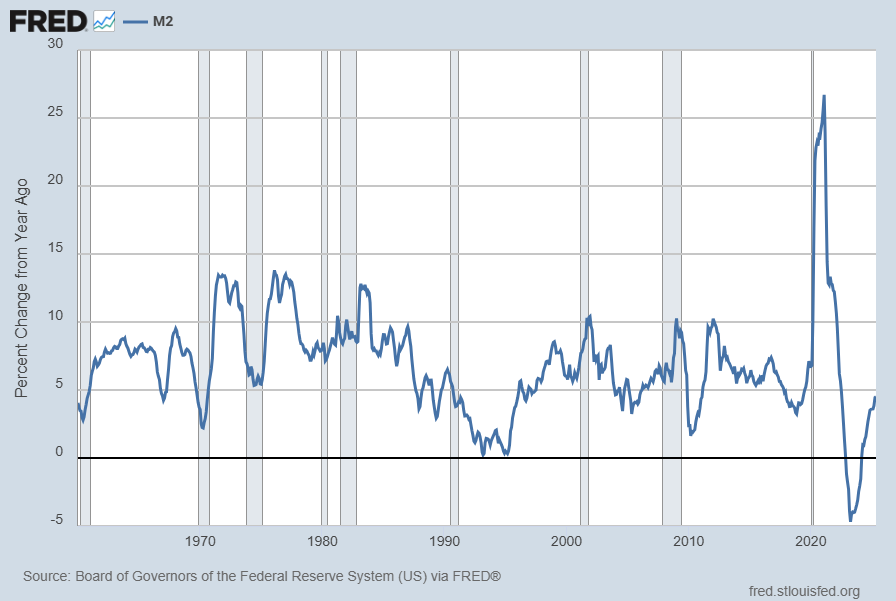
The second set shows M2, defined in FRED as the following:
Before May 2020, M2 consists of M1 plus (1) savings deposits (including money market deposit accounts); (2) small-denomination time deposits (time deposits in amounts of less than $100,000) less individual retirement account (IRA) and Keogh balances at depository institutions; and (3) balances in retail money market funds (MMFs) less IRA and Keogh balances at MMFs.
Beginning May 2020, M2 consists of M1 plus (1) small-denomination time deposits (time deposits in amounts of less than $100,000) less IRA and Keogh balances at depository institutions; and (2) balances in retail MMFs less IRA and Keogh balances at MMFs. Seasonally adjusted M2 is constructed by summing savings deposits (before May 2020), small-denomination time deposits, and retail MMFs, each seasonally adjusted separately, and adding this result to seasonally adjusted M1.
Here is the “M2 Money Stock” (seasonally adjusted) chart, updated on June 24, 2025, depicting data through May 2025, with a value of $21,942.0 Billion:
Here is the “M2 Money Stock” chart on a “Percent Change From Year Ago” basis, with a current value of 4.5%:
Data Source: Board of Governors of the Federal Reserve System (US), M2 Money Stock [M2SL], retrieved from FRED, Federal Reserve Bank of St. Louis; accessed June 24, 2025: https://fred.stlouisfed.org/series/M2SL
_____
The Special Note summarizes my overall thoughts about our economic situation
The June 2025 Livingston Surveypublished on June 24, 2025 contains, among its various forecasts, a S&P500 forecast. It shows the following price forecast for the dates shown:
June 30, 2025 5850.0
Dec. 31, 2025 5801.7
June 30, 2026 6027.3
Dec. 31, 2026 6210.3
These figures represent the median value across the forecasters on the survey’s panel.
_____
I post various economic forecasts because I believe they should be carefully monitored. However, as those familiar with this site are aware, I do not agree with many of the consensus estimates and much of the commentary in these forecast surveys.
_____
The Special Note summarizes my overall thoughts about our economic situation
Perhaps the main reason that I write of our economic situation is that I continue to believe, based upon various analyses, that our economic situation is in many ways misunderstood. While no one likes to contemplate a future rife with economic adversity, current and future economic problems must be properly recognized and rectified if high-quality, sustainable long-term economic vitality is to be realized.
There are an array of indications and other “warning signs” – many readily apparent – that current economic activity and financial market performance is accompanied by exceedingly perilous dynamics.
I have written extensively about this peril, including in the following:
My analyses continues to indicate that the growing level of financial danger will lead to the next stock market crash that will also involve (as seen in 2008) various other markets as well. Key attributes of this next crash is its outsized magnitude (when viewed from an ultra-long term historical perspective) and the resulting economic impact. This next financial crash is of tremendous concern, as my analyses indicate it will lead to a Super Depression – i.e. an economy characterized by deeply embedded, highly complex, and difficult-to-solve problems.
For long-term reference purposes, here is a chart of the Dow Jones Industrial Average since 1900, depicted on a monthly basis using a LOG scale (updated through June 20, 2025 with a last value of 42,206.82):
(click on chart to enlarge image)(chart courtesy of StockCharts.com)
_____
The Special Note summarizes my overall thoughts about our economic situation
Business Roundtable today released its Q2 2025 CEO Economic Outlook Survey, a composite index of CEO plans for capital spending and employment and expectations for sales over the next six months.
The overall Index dropped by 15 points from last quarter to 69, well below its historic average of 83. The decline is the result of decreases in all three subindices, driven by a downward shift in CEO plans and expectations, most notably in the employment subindex.
On May 29, 2025, The Conference Board released the Q2 2025 Measure Of CEO Confidence. The overall measure of CEO Confidence was at 34, down from the previous reading of 60. [note: a reading of more than 50 points reflects more positive than negative responses]
Notable excerpts from this Press Release include:
“CEO Confidence collapsed in Q2 2025 after surging in Q1,” said Stephanie Guichard, Senior Economist, Global Indicators, The Conference Board. “All components of the Measure weakened into pessimism territory. CEOs’ views about current economic conditions led the plunge, registering the largest quarter-on-quarter decline in almost 50 years. Expectations for the future also plummeted, with more than half of CEOs now expecting conditions to worsen over the next six months, both for the economy overall and in their own industries. CEOs’ assessments of current conditions in their own industries—a measure not included in calculating the topline Confidence measure—also fell sharply in Q2. The vast majority of CEOs (83%) said they expect a recession in the next 12-18 months, nearly matching the percentage who feared recession in late 2022 and early 2023. The US–China trade deal announced on May 12 seems to have eased, but not removed, concerns about the future. CEOs responding before and after May 12 reported similar very negative views about the current state of the economy and their own industries. However, the CEOs who responded after May 12 tended to be somewhat less pessimistic about the future and fewer expected a deep recession.“
_____
Additional details can be seen in the sources mentioned above.
_____
I post various economic forecasts because I believe they should be carefully monitored. However, as those familiar with this site are aware, I do not necessarily agree with many of the consensus estimates and much of the commentary in these forecast surveys.
_____
The Special Note summarizes my overall thoughts about our economic situation