On Wednesday, July 27, 2022 FOMC Chair Jerome Powell gave his scheduled July 2022 FOMC Press Conference. (link of video and related materials)
Below are Jerome Powell’s comments I found most notable – although I don’t necessarily agree with them – in the order they appear in the transcript. These comments are excerpted from the “Transcript of Chairman Powell’s Press Conference“ (preliminary)(pdf) of July 27, 2022, with the accompanying “FOMC Statement.”
Excerpts from Chairman Powell’s opening comments:
Good afternoon. My colleagues and I are strongly committed to bringing inflation back down, and we are moving expeditiously to do so. We have both the tools we need and the resolve it will take to restore price stability on behalf of American families and businesses. The economy and the country have been through a lot over the past two-and-a-half years and have proved resilient. It is essential that we bring inflation down to our 2 percent goal if we are to have a sustained period of strong labor market conditions that benefit all.
From the standpoint of our Congressional mandate to promote maximum employment and price stability, the current picture is plain to see: The labor market is extremely tight, and inflation is much too high. Against this backdrop, today the FOMC raised its policy interest rate by 3/4 percentage point and anticipates that ongoing increases in the target range for the federal funds rate will be appropriate. In addition, we are continuing the process of significantly reducing the size of our balance sheet, and I will have more to say about today’s monetary policy actions after briefly reviewing economic developments.
Recent indicators of spending and production have softened. Growth in consumer spending has slowed significantly, in part reflecting lower real disposable income and tighter financial conditions. Activity in the housing sector has weakened, in part reflecting higher mortgage rates. And after a strong increase in the first quarter, business fixed investment also looks to have declined in the second quarter.
Excerpts of Jerome Powell’s responses as indicated to various questions:
COLBY SMITH. Thank you so much for taking our questions. Colby Smith with The Financial Times. As the Committee considers the policy path forward, how will it weigh the expected decline and headline inflation which might come as a result of the drop in commodity prices against the fact that we are likely to see some persistence in core readings in particular? And given that potential tension and signs of any kind of activity weakening here, how has the Committee’s thinking changed on how far into restrictive territory rates may need to go?
CHAIR POWELL. So, I guess I’d start by saying we’ve been saying we would move expeditiously to get to the range of neutral. And I think we’ve done that now. We’re at 2.25 to 2.5 and that’s right in the range of what we think is neutral. So, the question is how are we thinking about the path forward. So, one thing that hasn’t changed– won’t change is that our focus is going to continue to be using our tools to bring demand back into better balance with supply in order to bring inflation back down. That will continue to be our overarching focus. We also said that we expect ongoing rate hikes will be appropriate. And that we’ll make decisions meeting by meeting. So, what are we going to be looking at? We’ll be looking at the incoming data as I mentioned, and that’ll start with economic activity. Are we seeing the slowdown that we– the slowdown in economic activity that we think we need? And there’s some evidence that we are at this time. Of course, we’ll be looking at labor market conditions. And we’ll be asking whether we see the alignment between supply and demand getting better, getting closer. Of course, we’ll be looking closely at inflation. You mentioned headline and core. Our mandate is for headline, of course, it’s not for core. But we look at core because core is actually a better indicator of headline. And of all inflation going forward. So, we’ll be looking at both. And we’ll be looking at those both really for what they’re saying for the outlook rather than just simply for what they say. But we’ll be asking. Do we see inflationary pressures declining? Do we see actual readings of inflation coming down? So in light of all that data, the question we’ll be asking is whether the stance of policy we have is sufficiently restrictive to bring inflation back down to our 2 percent target? And it’s also worth noting that these rate hikes have been large and they’ve come quickly. And it’s likely that their full effect has not been felt by the economy. So, there’s probably some additional tightening, significant additional tightening in the pipeline. So where are we going with this? I think the best– I think the Committee broadly feels that we need to get policy to at least to a moderately restrictive level. And maybe the best datapoint for that would be what we wrote down in our SEP at the June meeting, so I think the median for the end of this year, the median would have been between 3 and a quarter and 3 and a half. And then people wrote down 50 basis points higher than that for 2023. So that’s– even though that’s now six weeks old, I guess, that’s the most recent reading. Of course, we’ll update that reading at the September meeting in eight weeks. So that’s how we’re thinking about it. As I mentioned, as it relates to September, I said that another unusually large increase could be appropriate, but that’s not a decision we’re making now. It’s one that we’ll make based on the data we see. And we’re going to be making decisions meeting by meeting. We think it’s time to just go to a meeting by meeting basis and not provide the kind of clear guidance that we had provided on the weighted neutral.
also:
STEVE LIESMAN. Steve Liesman, CNBC. Thanks for taking my question, Mr. Chairman. Earlier this week, the president said we are not going to be in a recession. So I have two questions off of that. Do you share the President’s confidence in not being in a recession, and second, how would or would not a recession change policy? Is it a bright line, sir, where contraction of the economy would be a turning point in policy? Was there some amount of contraction of the economy the Committee would be willing to abide in its effort to reduce inflation?
CHAIR POWELL. So, as I mentioned, we think it’s necessary to have growth slowdown. And growth is going to be slowing down this year for a couple of reasons. One of which is that you’re coming off of the very high growth of the reopening year of 2021. You’re also seeing tighter monetary policy. And you should see some slowing. We actually think we need a period of growth below potential, in order to create some slack so that the supply side can catch up. We also think that there will be, in all likelihood, some softening in labor market conditions. And those are things that we expect, and we think that they’re probably necessary if we were to have– to get inflation. If we were to be able to get inflation back down on the path to 2 percent and ultimately get there.
STEVE LIESMAN [INAUDIBLE] the question was whether you see a recession coming and how you might or might not change policy.
CHAIR POWELL. So, we’re going to be– again, we’re going to be focused on getting inflation back down. And we– as I’ve said on other occasions, price stability is really the bedrock of the economy. And nothing works in the economy without price stability. We can’t have a strong labor market without price stability for an extended period of time. We all want to get back to the kind of labor market we had before the pandemic where differences between racial and gender differences and that kind of thing were at historic minimums, where participation was high, where inflation was low. We want to get back to that. But that’s not happening. That’s not going to happen without restoring price stability. So, that’s something we see as something that we simply must do. And we think that we don’t see it as a trade off with the employment mandate. We see it as a way to facilitate the sustained achievement of the employment mandate in the longer term.
also:
NEIL IRWIN. Thanks, Chair Powell. Neil Irwin from Axios. To build a little on what Steve was asking, do you believe the United States is currently in a recession? Will the GDP reading tomorrow affect that judgment one way or the other? And has your assessment of the risk of recession changed any in recent weeks?
CHAIR POWELL. So, I do not think the U.S. is currently in a recession. And the reason is there are just too many areas of the economy that are performing too well. And of course, I would point to the labor market, in particular. As I mentioned, it’s true that growth is slowing. For reasons that we understand. Really the growth was extraordinarily high last year, 5 and a half percent. We would have expected growth to slow. There’s also more slowing going on now. But if you look at the labor market, you’ve got growth, I think payroll jobs averaging 450,000 per month? That’s a remarkably strong level for this state of affairs. The unemployment rate at near 50-year low at 3.6 percent. All of the wage measures that we track are running very strong. So this is a very strong labor market, and it’s just not consistent with– 2.7 million people hired in the first half of the year? It doesn’t make sense that the economy would be in recession with this kind of thing happening. So, I don’t think the U.S. economy’s in recession right now.
also:
JEAN YUNG. Thank you, Mr. Chairman. Jean Yung with Market News. I wanted to ask about the balance sheet reduction program. It’s been working for a couple months now and in a different environment than the last time the Fed did it. What are you learning about how it’s working and how markets are reacting? And is reaching the minimum level of reserves needed in the system still several years away at the current pace?
CHAIR POWELL. So we think it’s working fine. As you know, we tapered up into it. And in September, we’ll go to full strength. And the markets seem to have accepted it. By all assessments, the markets should be able to absorb this. And we expect that will be the case. So, I would say the plan is broadly on track. It’s a little bit slow to get going because some of these trades don’t settle for a bit of time. But it will be picking up steam. So I guess your second question was getting– the process of getting back down to the new equilibrium will take a while. And that time, it’s hard to be precise, but the model would suggest that it could be between two, two and a half years, that kind of thing. And this is a much faster pace than the last time. Balance sheet’s much bigger than it was. But we look at this carefully and we thought that this was the sensible pace. And we have no reason to think that it’s not.
_____
_____
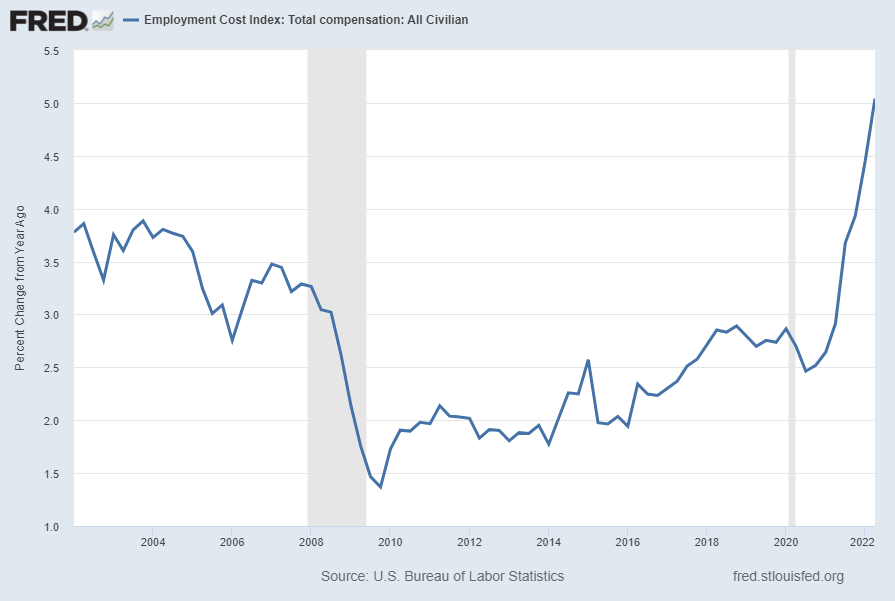
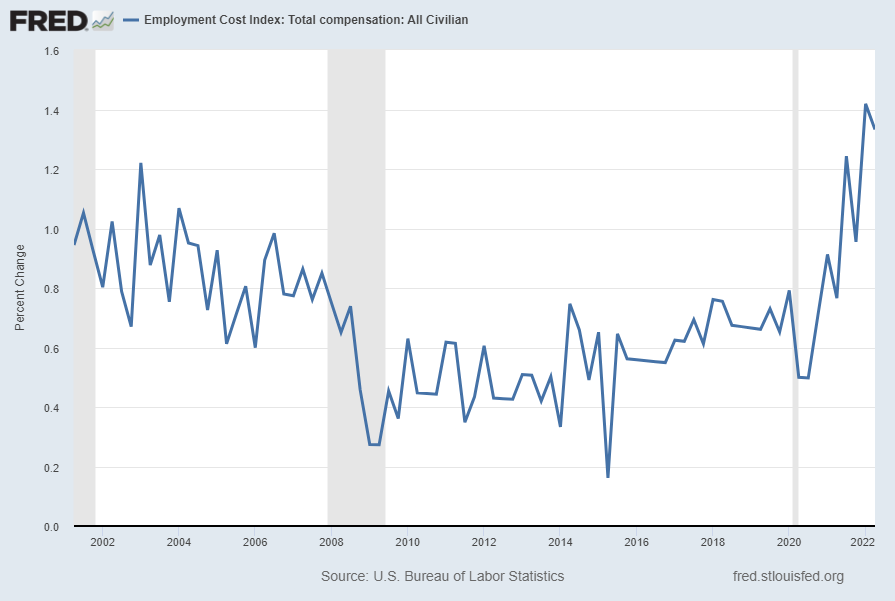
The Special Note summarizes my overall thoughts about our economic situation
SPX at 4051.08 as this post is written