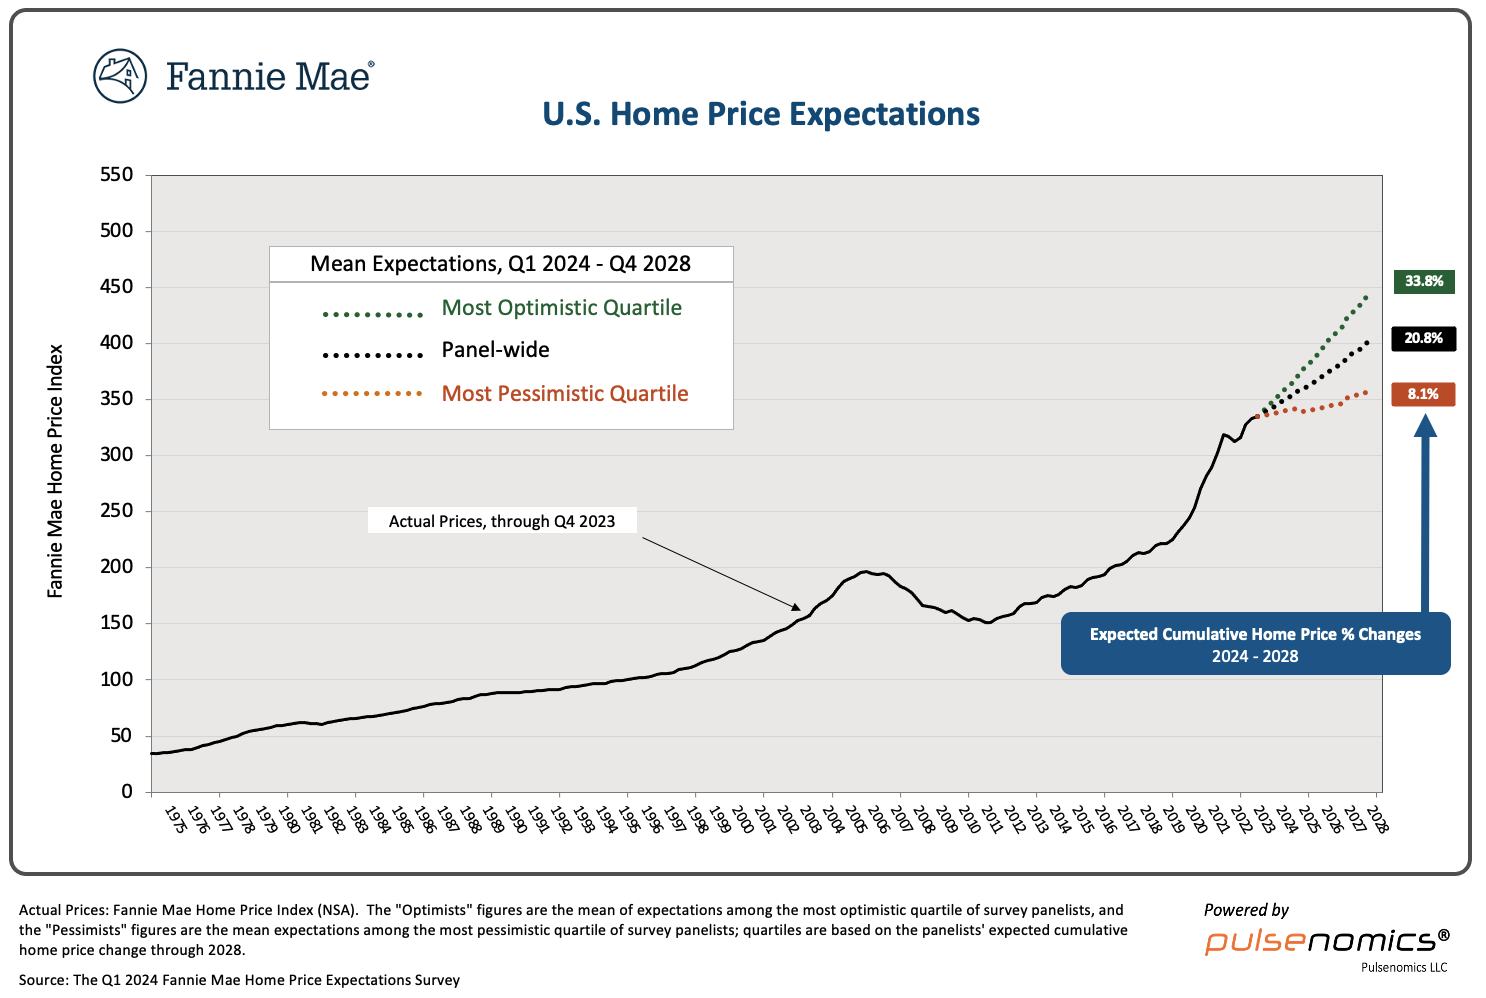
As one can see from the above chart, the average expectation is that the residential real estate market, as depicted by the Fannie Mae Home Price Index, will continually climb.
The detail of the survey is interesting. Of the survey respondents, only four (of the displayed responses) forecasts a cumulative price decrease through 2028.
The Median Cumulative Home Price Appreciation for years 2024-2028 is seen as 4.0%, 7.74%, 12.16%, 16.08%, and 20.84%, respectively.
For a variety of reasons, I continue to believe that these forecasts will prove far too optimistic.
I have written extensively about the residential real estate situation. For a variety of reasons, it is exceedingly complex. While many people continue to have an optimistic view regarding future residential real estate prices, in my opinion such a view is unsupported on an “all things considered” basis. Residential real estate is an exceedingly large asset bubble. As such, from these price levels there exists potential for a price decline of outsized magnitude.
_____
The Special Note summarizes my overall thoughts about our economic situation
For reference purposes, below are two sets of charts depicting growth in the money supply.
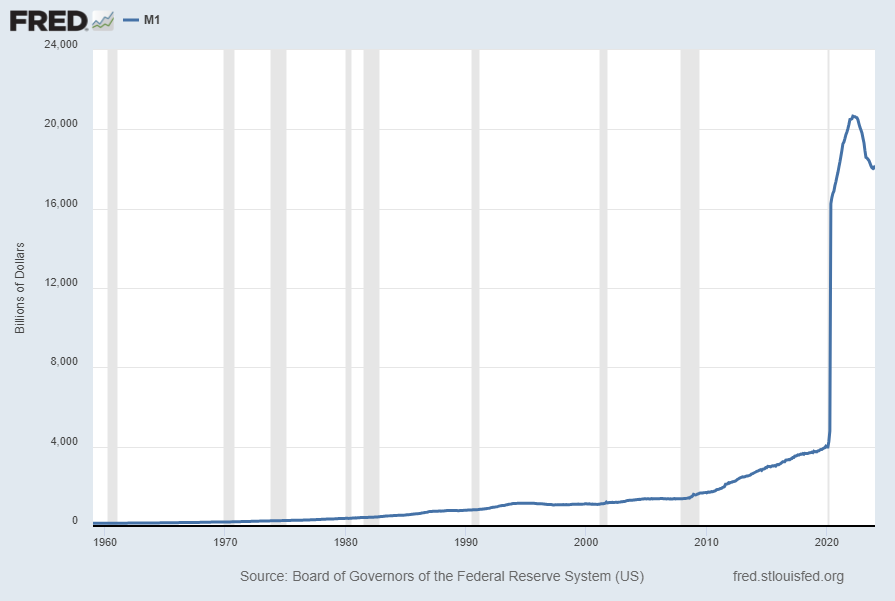
The first shows the M1, defined in FRED as the following:
Before May 2020, M1 consists of (1) currency outside the U.S. Treasury, Federal Reserve Banks, and the vaults of depository institutions; (2) demand deposits at commercial banks (excluding those amounts held by depository institutions, the U.S. government, and foreign banks and official institutions) less cash items in the process of collection and Federal Reserve float; and (3) other checkable deposits (OCDs), consisting of negotiable order of withdrawal, or NOW, and automatic transfer service, or ATS, accounts at depository institutions, share draft accounts at credit unions, and demand deposits at thrift institutions.
Beginning May 2020, M1 consists of (1) currency outside the U.S. Treasury, Federal Reserve Banks, and the vaults of depository institutions; (2) demand deposits at commercial banks (excluding those amounts held by depository institutions, the U.S. government, and foreign banks and official institutions) less cash items in the process of collection and Federal Reserve float; and (3) other liquid deposits, consisting of OCDs and savings deposits (including money market deposit accounts). Seasonally adjusted M1 is constructed by summing currency, demand deposits, and OCDs (before May 2020) or other liquid deposits (beginning May 2020), each seasonally adjusted separately.
Here is the “M1 Money Stock” (seasonally adjusted) chart, updated on February 27, 2024 depicting data through January 2024, with a value of $17,989.0 Billion:
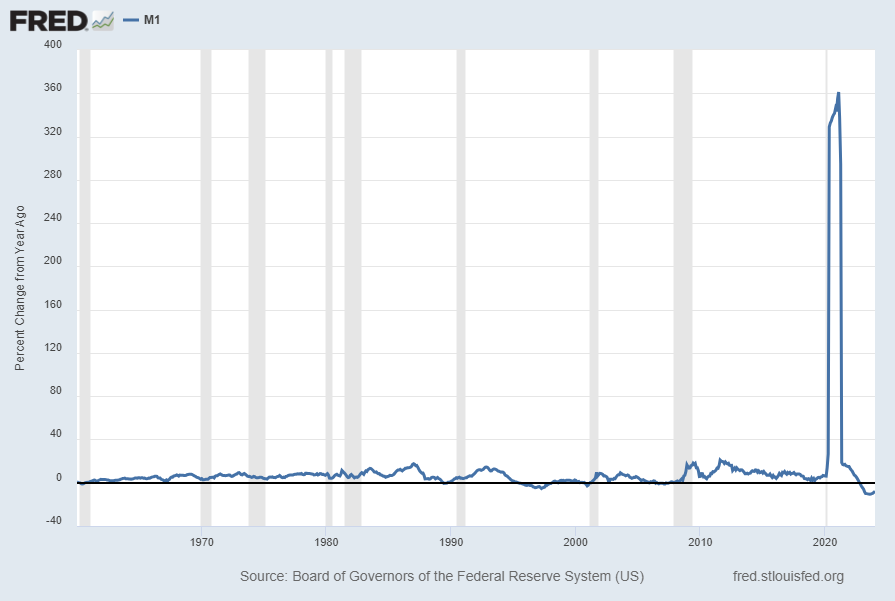
Here is the “M1 Money Stock” chart on a “Percent Change From Year Ago” basis, with a current value of -8.0%:
Data Source: Board of Governors of the Federal Reserve System (US), M1 Money Stock [M1SL], retrieved from FRED, Federal Reserve Bank of St. Louis; accessed February 27, 2024: https://fred.stlouisfed.org/series/M1SL
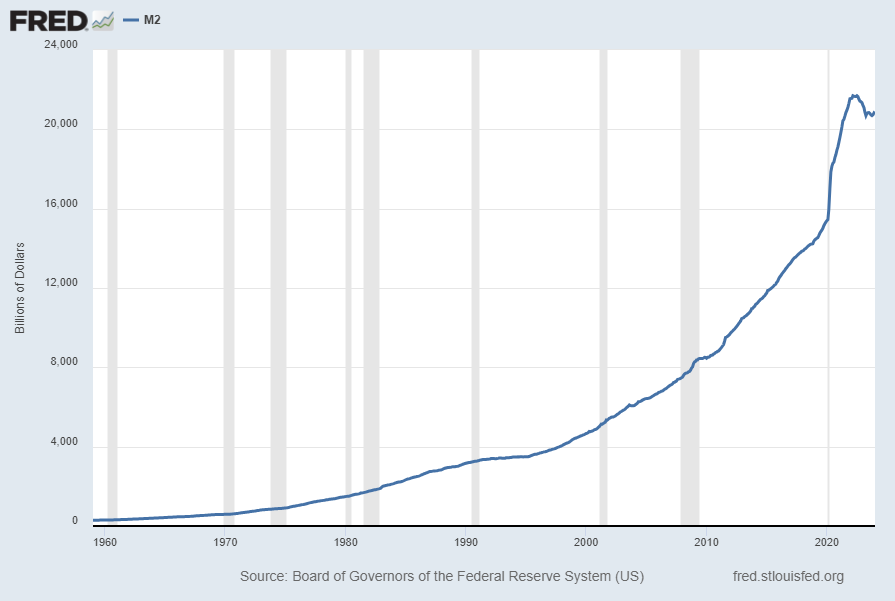
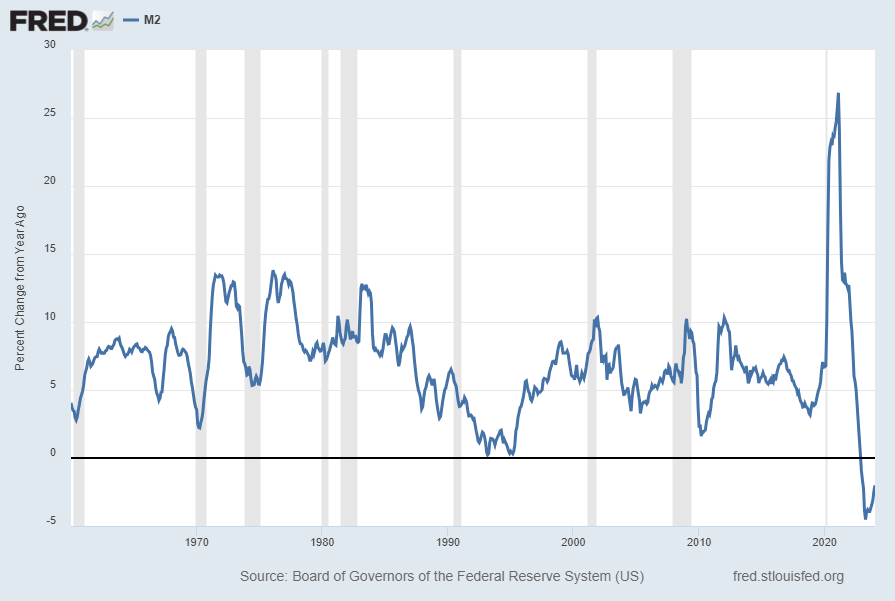
The second set shows M2, defined in FRED as the following:
Before May 2020, M2 consists of M1 plus (1) savings deposits (including money market deposit accounts); (2) small-denomination time deposits (time deposits in amounts of less than $100,000) less individual retirement account (IRA) and Keogh balances at depository institutions; and (3) balances in retail money market funds (MMFs) less IRA and Keogh balances at MMFs.
Beginning May 2020, M2 consists of M1 plus (1) small-denomination time deposits (time deposits in amounts of less than $100,000) less IRA and Keogh balances at depository institutions; and (2) balances in retail MMFs less IRA and Keogh balances at MMFs. Seasonally adjusted M2 is constructed by summing savings deposits (before May 2020), small-denomination time deposits, and retail MMFs, each seasonally adjusted separately, and adding this result to seasonally adjusted M1.
Here is the “M2 Money Stock” (seasonally adjusted) chart, updated on February 27, 2024, depicting data through January 2024, with a value of $20,781.80 Billion:
Here is the “M2 Money Stock” chart on a “Percent Change From Year Ago” basis, with a current value of -2.0%:
Data Source: Board of Governors of the Federal Reserve System (US), M2 Money Stock [M2SL], retrieved from FRED, Federal Reserve Bank of St. Louis; accessed February 27, 2024: https://fred.stlouisfed.org/series/M2SL
_____
The Special Note summarizes my overall thoughts about our economic situation
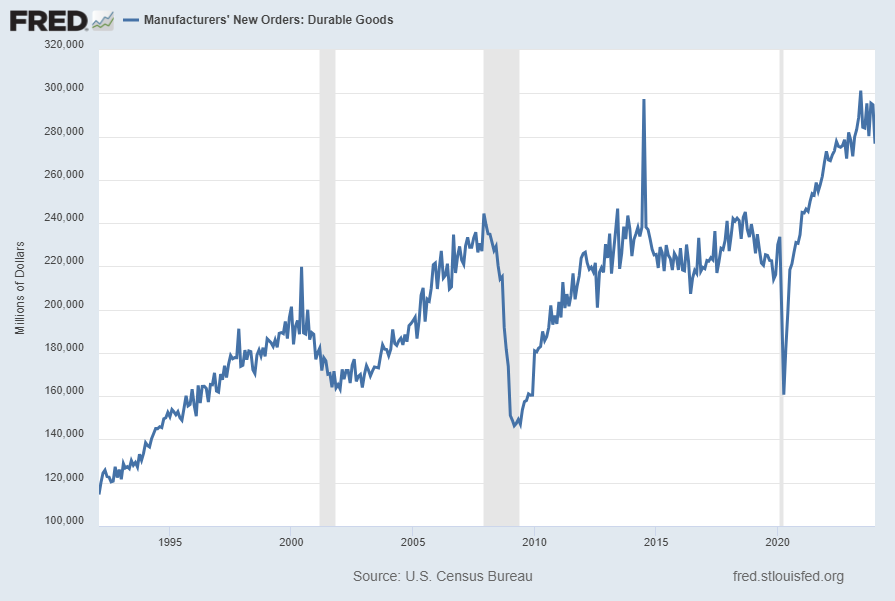
Many people place emphasis on Durable Goods New Orders as a prominent economic indicator and/or leading economic indicator.
For reference, below are two charts depicting this measure.
First, from the St. Louis Fed site (FRED), a chart through January 2024, updated on February 27, 2024. This value is $276,652 ($ Millions):
(click on charts to enlarge images)
–
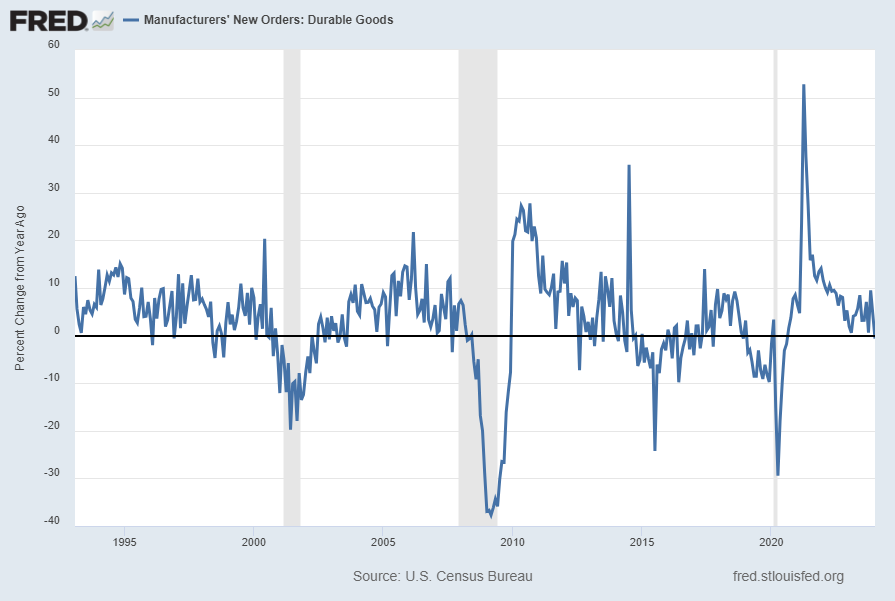
Second, here is the chart depicting this measure on a “Percent Change from a Year Ago” basis, with a last value of -.6%:
Data Source: FRED, Federal Reserve Economic Data, Federal Reserve Bank of St. Louis: Manufacturers’ New Orders: Durable Goods [DGORDER]; U.S. Department of Commerce: Census Bureau; accessed February 27, 2024; http://research.stlouisfed.org/fred2/series/DGORDER
_________
I post various indicators and indices because I believe they should be carefully monitored. However, as those familiar with this site are aware, I do not necessarily agree with what they depict or imply.
_____
The Special Note summarizes my overall thoughts about our economic situation
Perhaps the main reason that I write of our economic situation is that I continue to believe, based upon various analyses, that our economic situation is in many ways misunderstood. While no one likes to contemplate a future rife with economic adversity, current and future economic problems must be properly recognized and rectified if high-quality, sustainable long-term economic vitality is to be realized.
There are an array of indications and other “warning signs” – many readily apparent – that current economic activity and financial market performance is accompanied by exceedingly perilous dynamics.
I have written extensively about this peril, including in the following:
My analyses continues to indicate that the growing level of financial danger will lead to the next stock market crash that will also involve (as seen in 2008) various other markets as well. Key attributes of this next crash is its outsized magnitude (when viewed from an ultra-long term historical perspective) and the resulting economic impact. This next financial crash is of tremendous concern, as my analyses indicate it will lead to a Super Depression – i.e. an economy characterized by deeply embedded, highly complex, and difficult-to-solve problems.
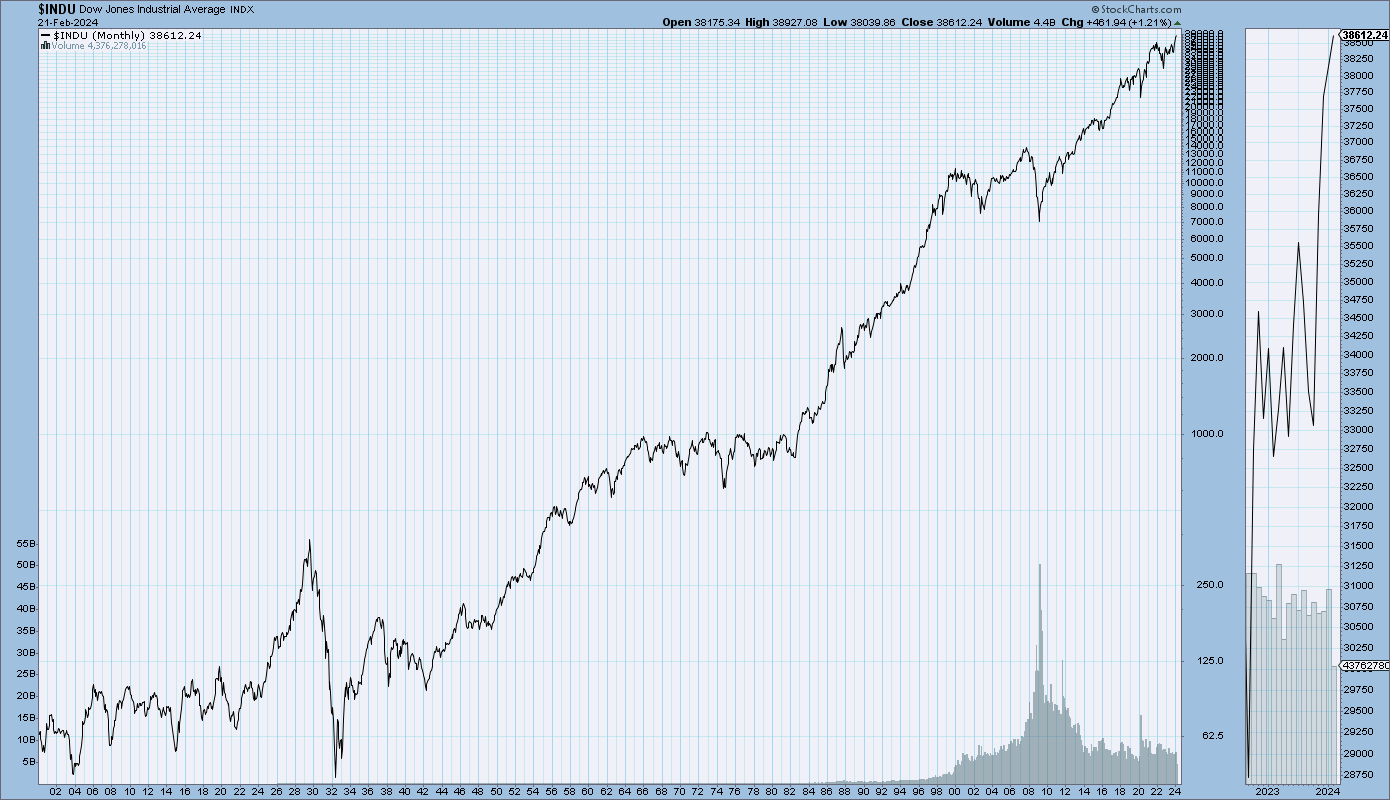
For long-term reference purposes, here is a chart of the Dow Jones Industrial Average since 1900, depicted on a monthly basis using a LOG scale (updated through February 21, 2024 with a last value of 38,612.24):
(click on chart to enlarge image)(chart courtesy of StockCharts.com)
_____
The Special Note summarizes my overall thoughts about our economic situation
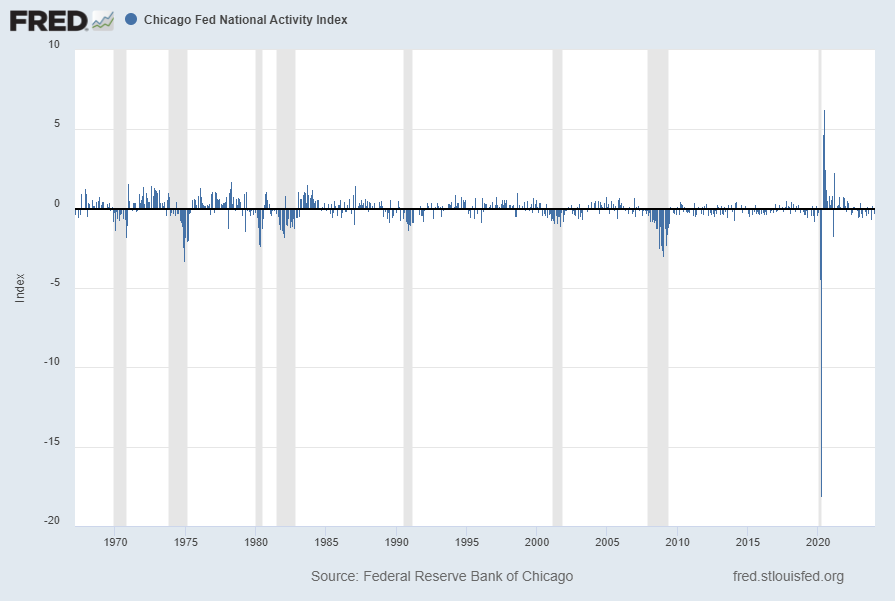
The following is an update of various indicators that are supposed to predict and/or depict economic activity. These indicators have been discussed in previous blog posts:
source: Federal Reserve Bank of Chicago, Chicago Fed National Activity Index [CFNAI], retrieved from FRED, Federal Reserve Bank of St. Louis; accessed February 22, 2024: https://fred.stlouisfed.org/series/CFNAI
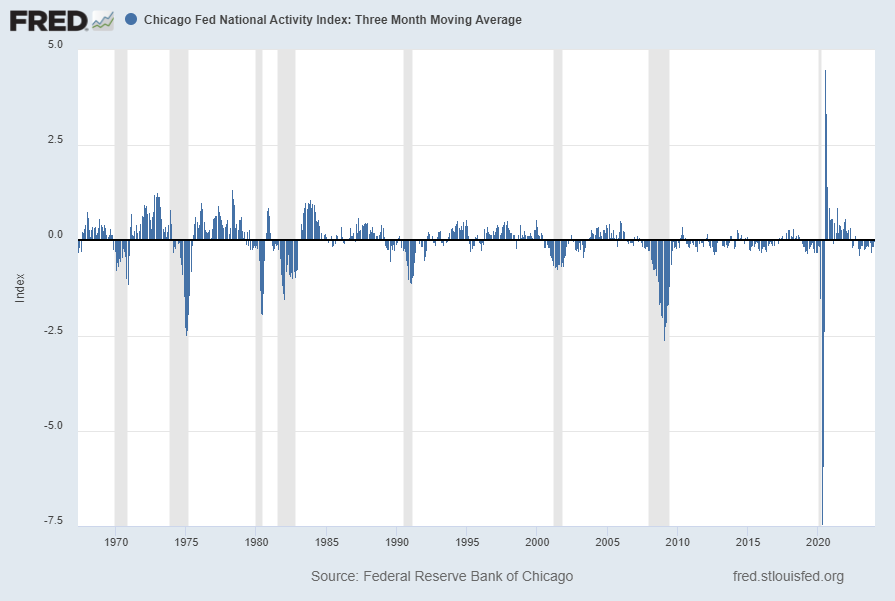
The CFNAI-MA3, with a current reading of -.02:
source: Federal Reserve Bank of Chicago, Chicago Fed National Activity Index: Three Month Moving Average [CFNAIMA3], retrieved from FRED, Federal Reserve Bank of St. Louis; accessed February 22, 2024: https://fred.stlouisfed.org/series/CFNAIMA3
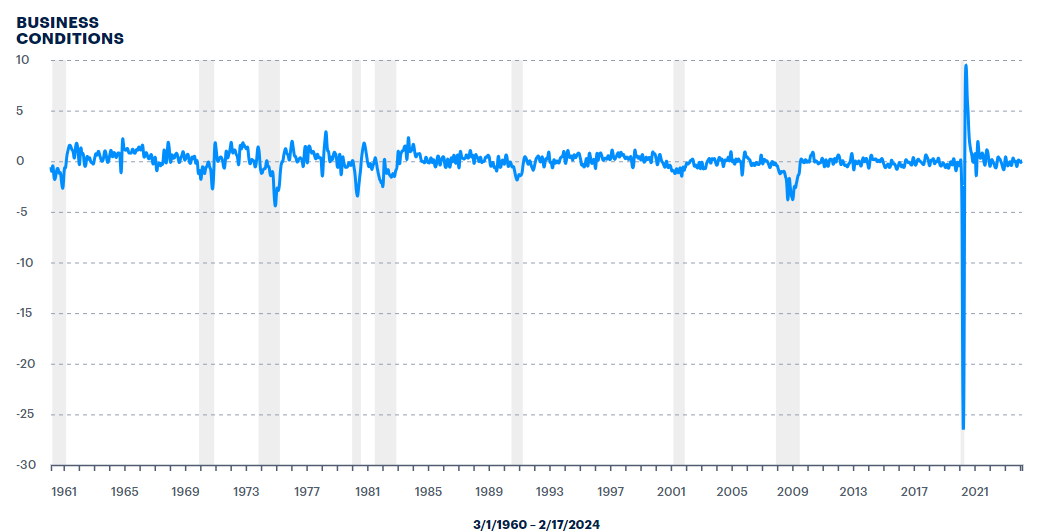
The ADS Index as of February 22, 2024, reflecting data from March 1, 1960 through February 17, 2024, with last value .036461:
–
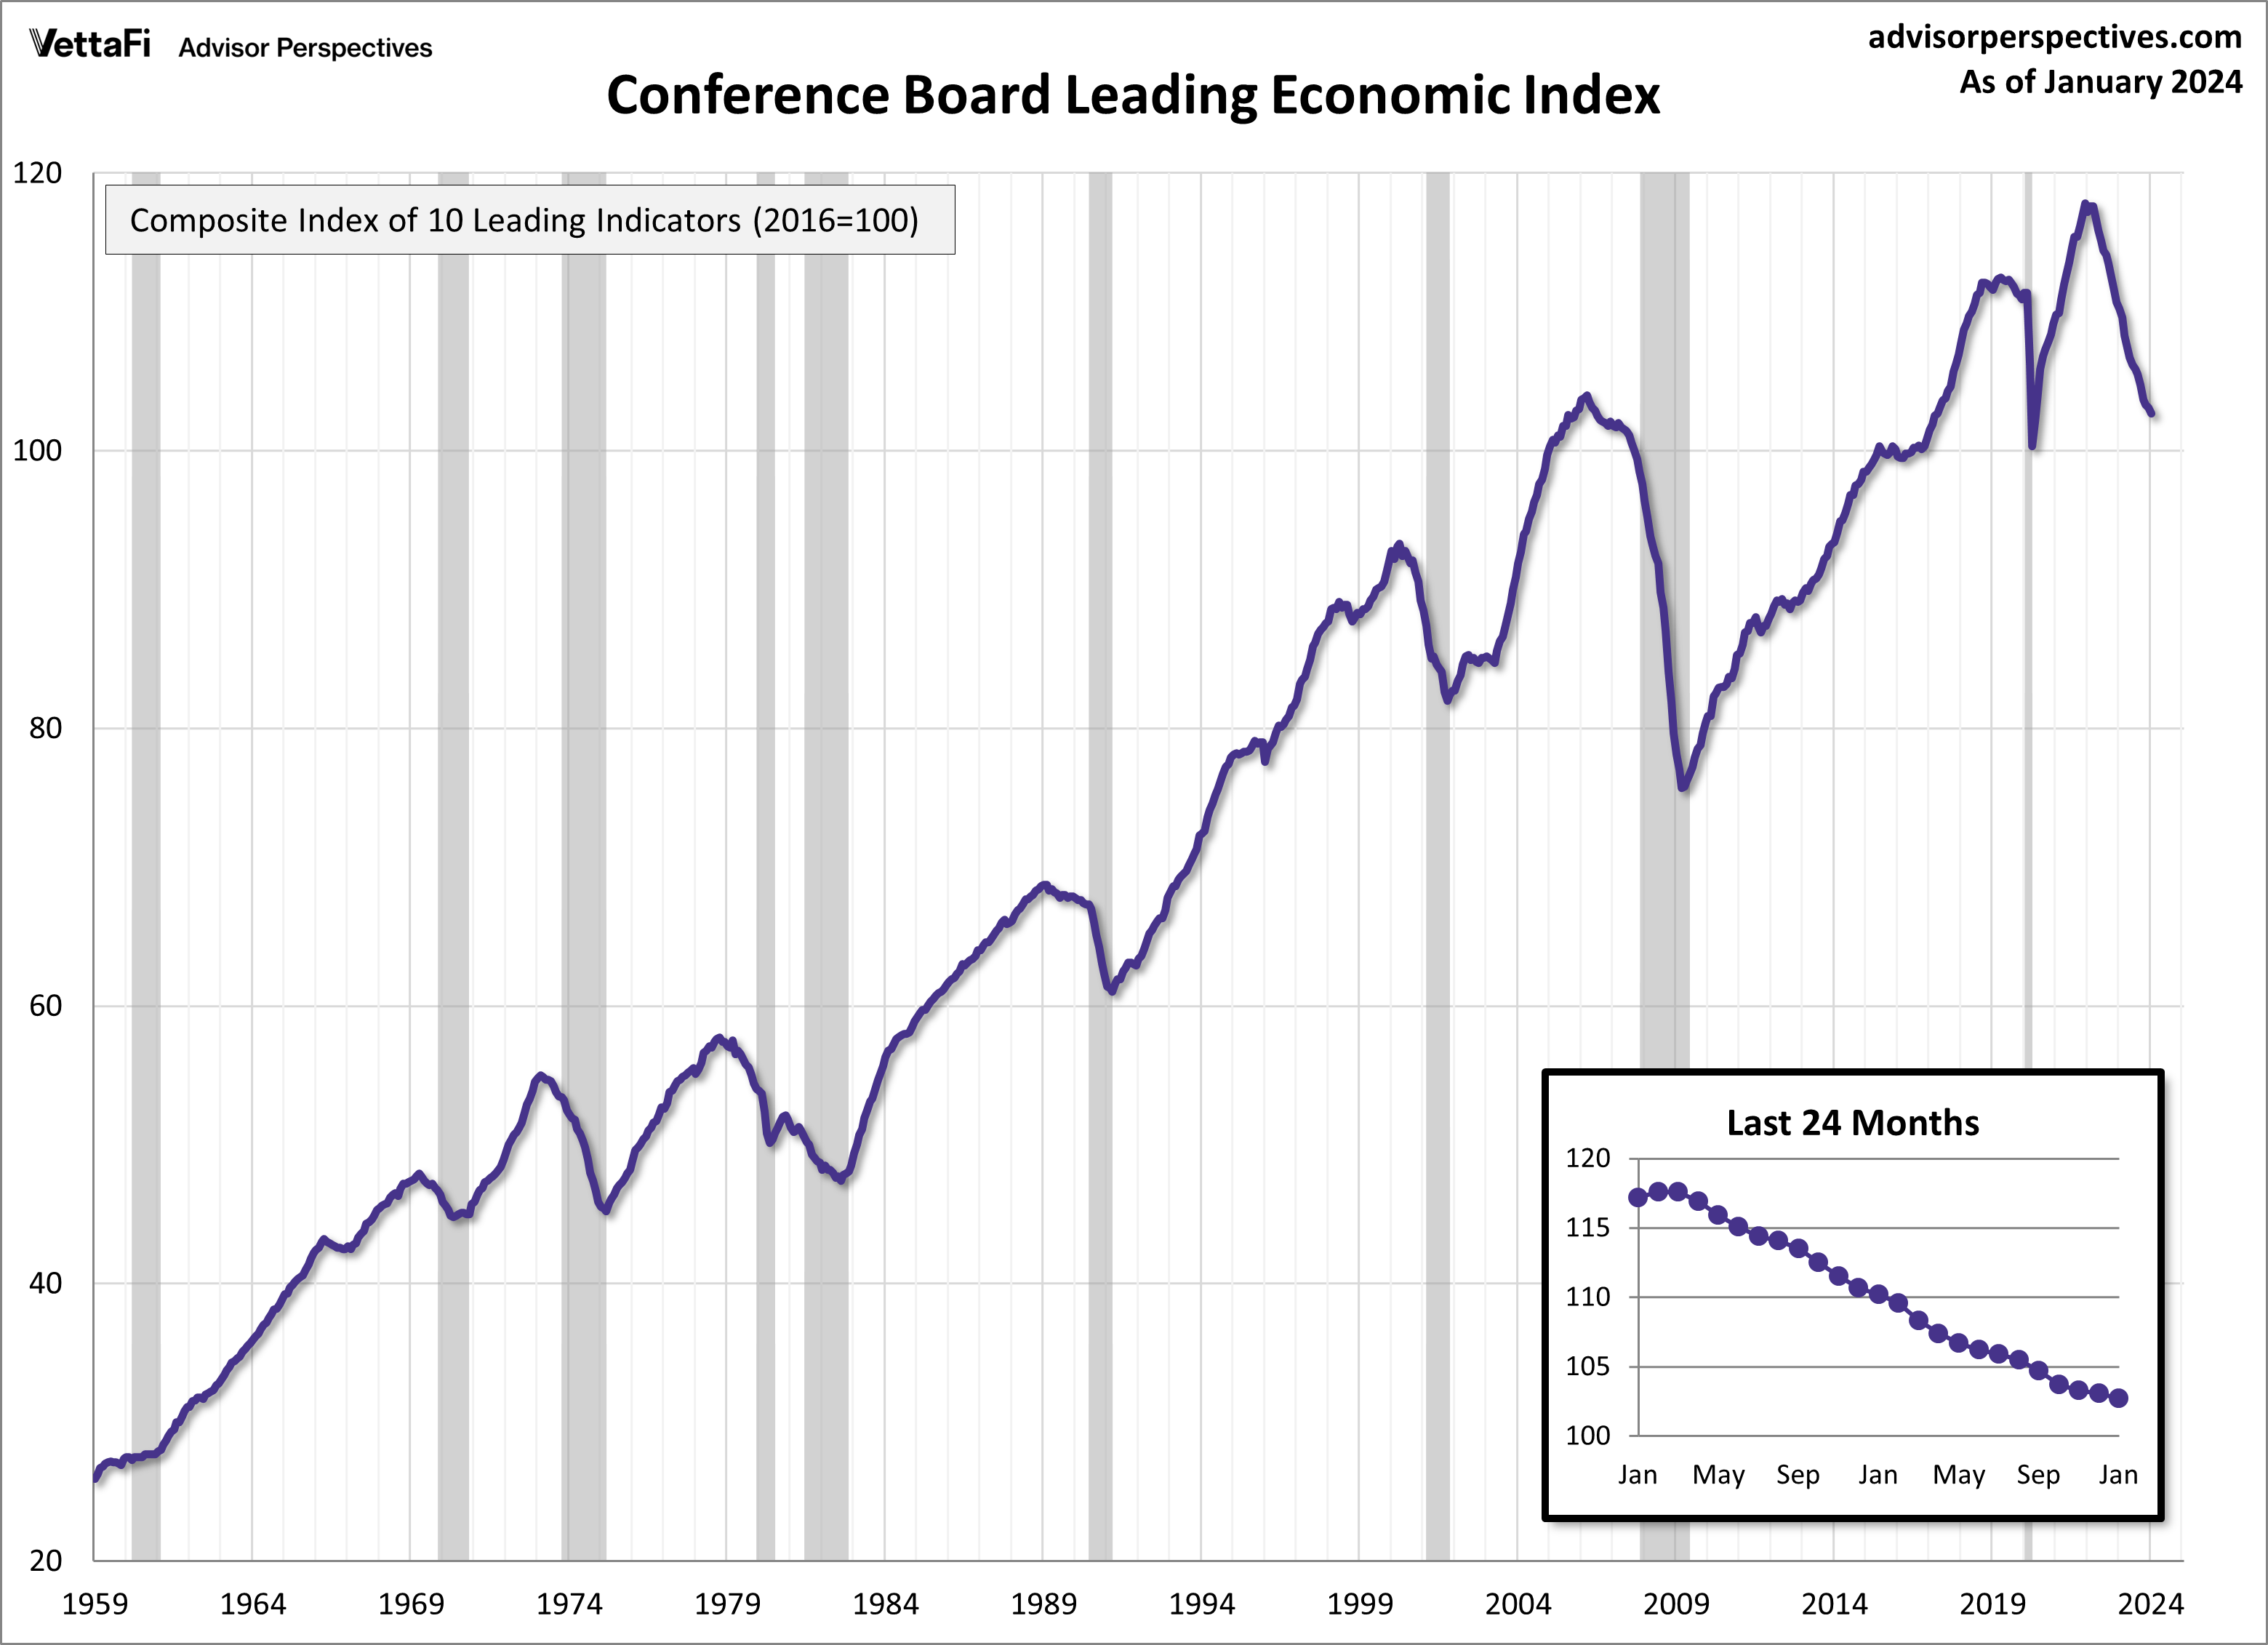
The Conference Board Leading Economic Index (LEI), Coincident Economic Index (CEI), and Lagging Economic Index (LAG):
As per the February 20, 2024 Conference Board press release the LEI was 102.7 in January, the CEI was 112.1 in January, and the LAG was 118.6 in January.
An excerpt from the release:
“The U.S. LEI fell further in January, as weekly hours worked in manufacturing continued to decline and the yield spread remained negative,” said Justyna Zabinska-La Monica, Senior Manager, Business Cycle Indicators, at The Conference Board. “While the declining LEI continues to signal headwinds to economic activity, for the first time in the past two years, six out of its ten components were positive contributors over the past six-month period (ending in January 2024). As a result, the leading index currently does not signal recession ahead. While no longer forecasting a recession in 2024, we do expect real GDP growth to slow to near zero percent over Q2 and Q3.”
I post various indicators and indices because I believe they should be carefully monitored. However, as those familiar with this site are aware, I do not necessarily agree with what they depict or imply.
_____
The Special Note summarizes my overall thoughts about our economic situation
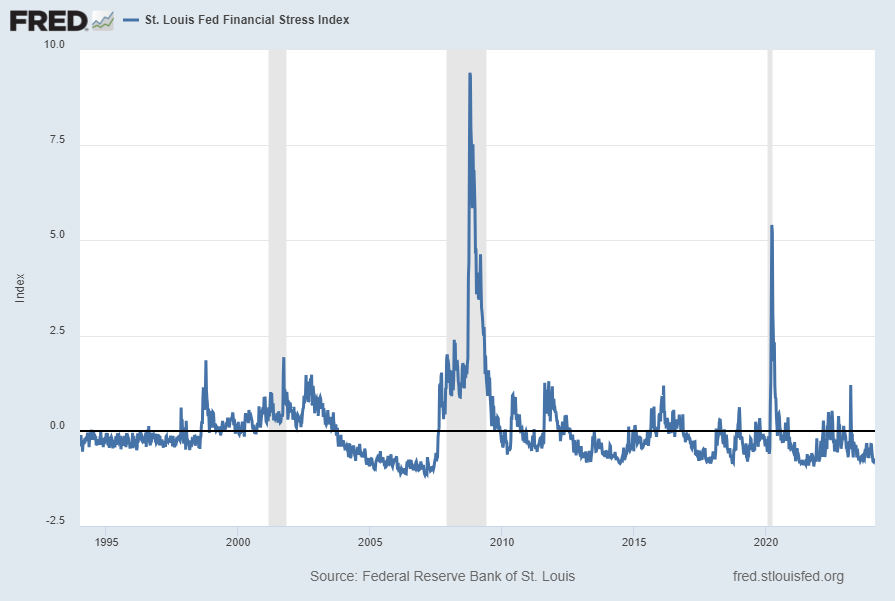
The St. Louis Fed’s Financial Stress Index (STLFSI4) is one index that is supposed to measure stress in the financial system. Its reading as of the February 22, 2024 update (reflecting data through February 16, 2024) is -.8423:
source: Federal Reserve Bank of St. Louis, St. Louis Fed Financial Stress Index [STLFSI4], retrieved from FRED, Federal Reserve Bank of St. Louis; accessed February 22, 2024: https://fred.stlouisfed.org/series/STLFSI4
Of course, there are a variety of other measures and indices that are supposed to measure financial stress and other related issues, both from the Federal Reserve as well as from private sources.
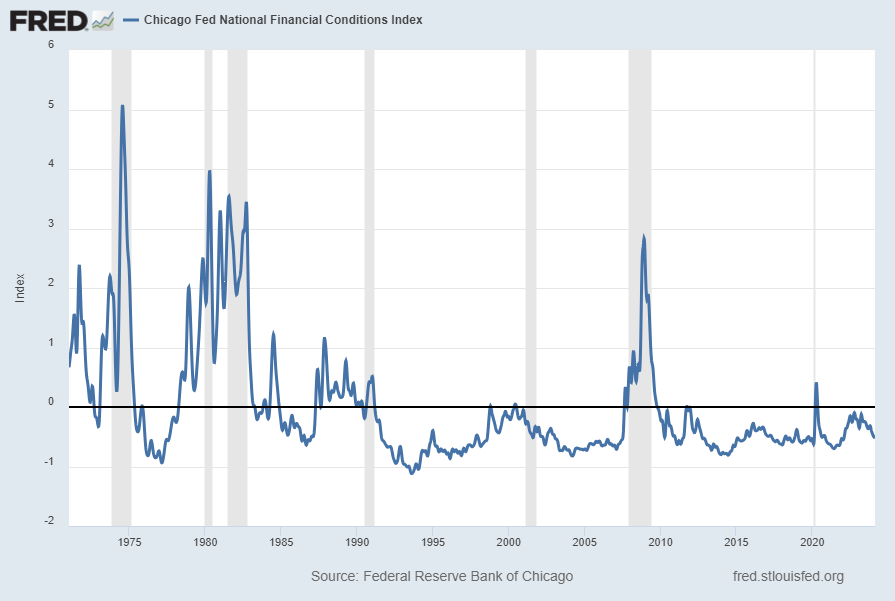
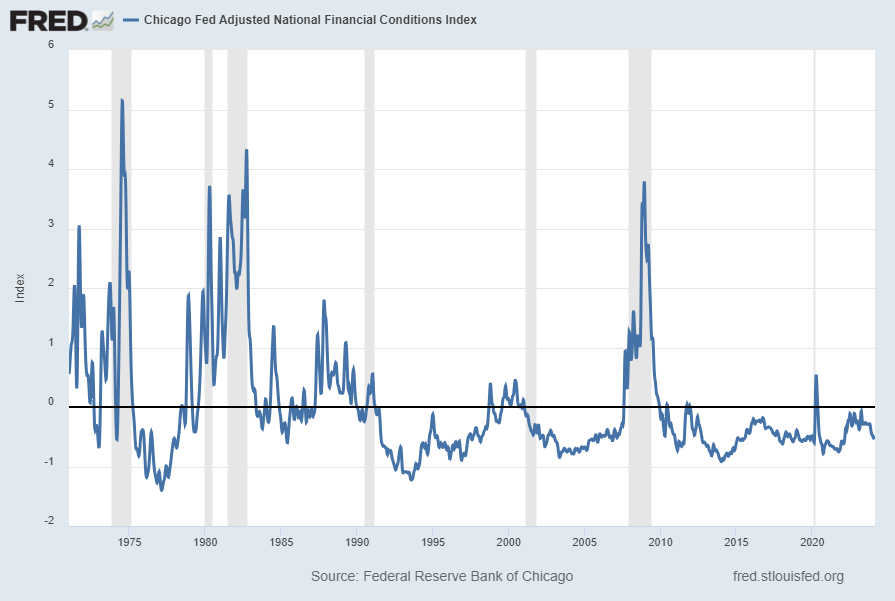
Two other indices that I regularly monitor include the Chicago Fed National Financial Conditions Index (NFCI) as well as the Chicago Fed Adjusted National Financial Conditions Index (ANFCI).
Here are summary descriptions of each, as seen in FRED:
The National Financial Conditions Index (NFCI) measures risk, liquidity and leverage in money markets and debt and equity markets as well as in the traditional and “shadow” banking systems. Positive values of the NFCI indicate financial conditions that are tighter than average, while negative values indicate financial conditions that are looser than average.
The adjusted NFCI (ANFCI). This index isolates a component of financial conditions uncorrelated with economic conditions to provide an update on how financial conditions compare with current economic conditions.
For further information, please visit the Federal Reserve Bank of Chicago’s web site:
Below are the most recently updated charts of the NFCI and ANFCI, respectively.
The NFCI chart below was last updated on February 22, 2024 incorporating data from January 8, 1971 through February 16, 2024 on a weekly basis. The February 16 value is -.52151:
The ANFCI chart below was last updated on February 22, 2024 incorporating data from January 8, 1971 through February 16, 2024, on a weekly basis. The February 16, 2024 value is -.50523:
I post various indicators and indices because I believe they should be carefully monitored. However, as those familiar with this site are aware, I do not necessarily agree with what they depict or imply.
_____
The Special Note summarizes my overall thoughts about our economic situation
The stock market bubble continues to grow in size, which is highly notable given the enormous size of the bubble during February 2020. My analyses indicate that this stock market bubble is the largest stock market bubble ever in the United States. As well, another problematic aspect is that the stock market bubble is just one of many exceedingly large asset bubbles in existence. The existence of these astoundingly large asset bubbles poses a grave risk to the financial system and economy.
I have written extensively concerning the stock market bubble, its causes, and current and future consequences. It should be noted that a fully comprehensive discussion would be exceedingly lengthy and at times very complex. Perhaps the paramount aspects of this stock market bubble is that, for various reasons, it is far larger than most conventional measures would suggest; and that the future consequences of the “bursting” of the bubble will be highly problematical on many fronts.
As stated in the February 2020 commentary, one of the foremost signs of asset bubbles is excessive sentiment. Excessive sentiment can manifest in many ways. The current stock market environment exhibits a broad array of excessively positive sentiment. This excessively positive sentiment is often referred to as excessive speculation or “froth.” The current stock market is experiencing an epochal speculative mania.
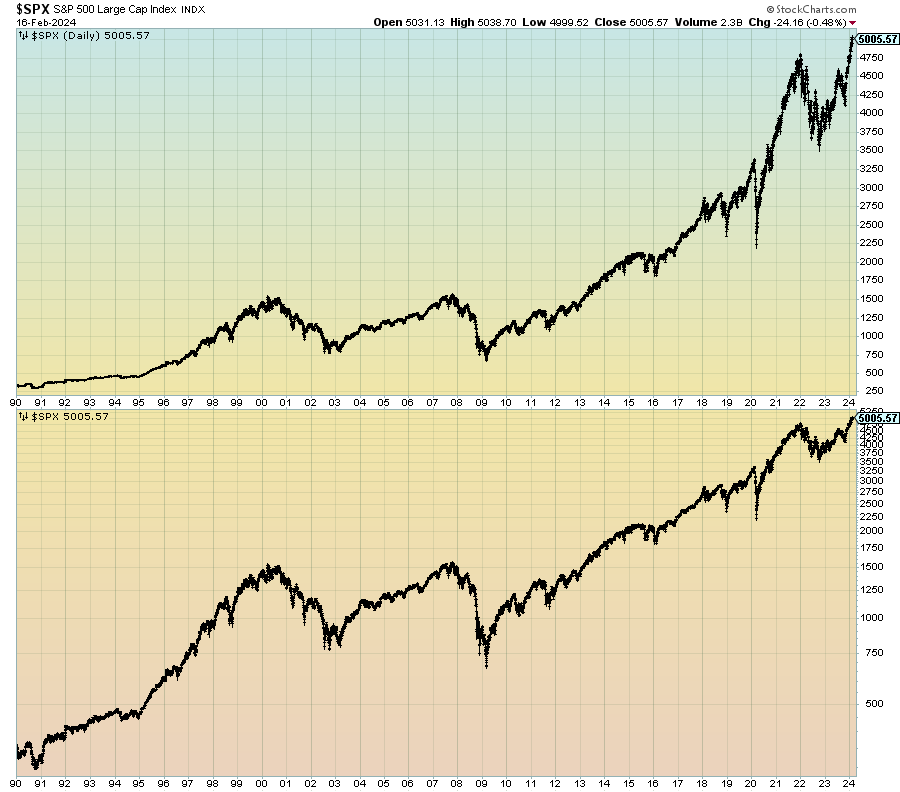
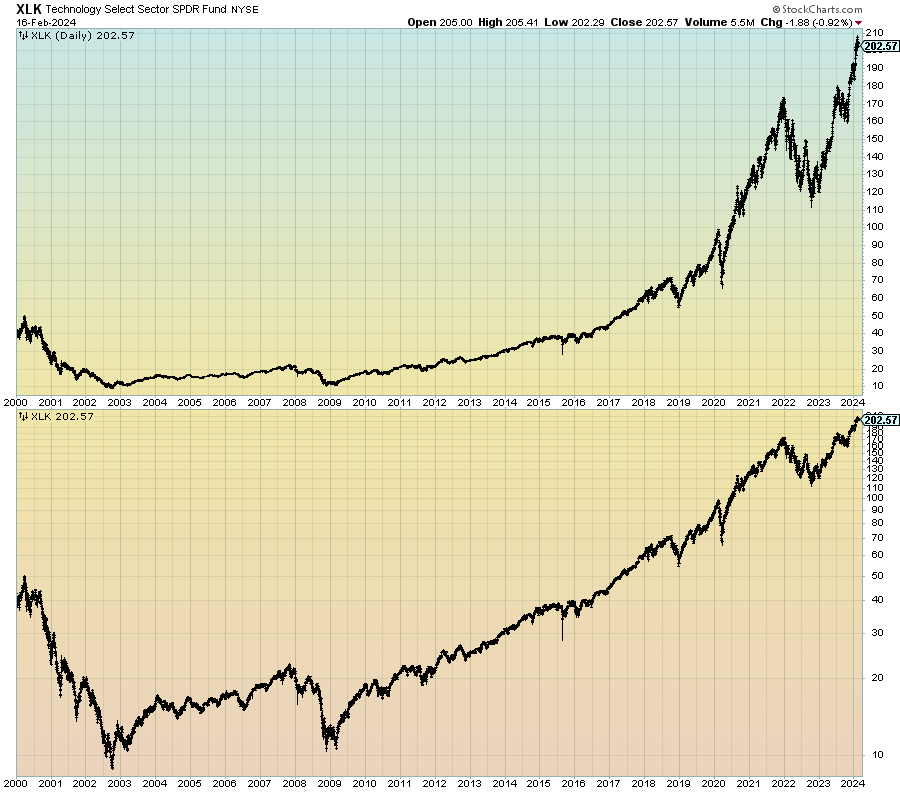
In the February 2020 commentary I displayed a variety of long-term charts that depicted notable fundamental and technical measures. Below is an update to three of those charts, the S&P500, the XLK ETF, and the Nasdaq 100. The XLK and Nasdaq 100 illustrate the outsized price appreciation of perhaps the most overvalued market segment, technology.
Shown below is the S&P500 daily chart since 1990, with prices displayed on a linear scale on the top plot and a LOG scale on the bottom plot:
(click on charts to enlarge images)(charts courtesy of StockCharts.com; chart creation and annotation by the author)
Here is the XLK (technology) ETF since the year 2000, shown on a linear price scale (top plot) and a LOG scale (bottom plot):
(click on chart to enlarge image)(charts courtesy of StockCharts.com; chart creation and annotation by the author)
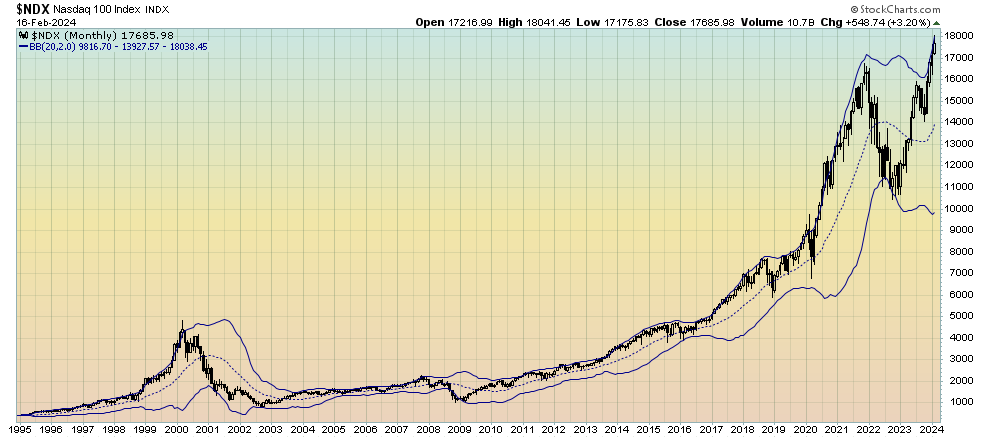
From a technical analysis perspective, many indicators show highly unique readings. Among these are the Bollinger Bands seen in the Nasdaq 100 chart, demonstrating the outsized velocity of recent price increases. As seen in the monthly chart below, the price has strongly rebounded since mid-2022 and is once again at the upper Bollinger Band:
(click on chart to enlarge image)(charts courtesy of StockCharts.com; chart creation and annotation by the author)
Another indication of a highly elevated level of froth is the extreme excessive valuations and accompanying very rapid price advance of scores of individual stocks both in technology as well as other sectors.
As I have mentioned in previous commentaries, the “bursting” of this stock market bubble will have many adverse impacts. My analyses continue to indicate this popping of the bubble will occur during a crash.
My analyses continues to indicate that the growing level of financial danger will lead to the next stock market crash that will also involve (as seen in 2008) various other markets as well. Key attributes of this next crash is its outsized magnitude (when viewed from an ultra-long term historical perspective) and the resulting economic impact. This next financial crash is of tremendous concern, as my analyses indicate it will lead to a Super Depression – i.e. an economy characterized by deeply embedded, highly complex, and difficult-to-solve problems.
_____
The Special Note summarizes my overall thoughts about our economic situation
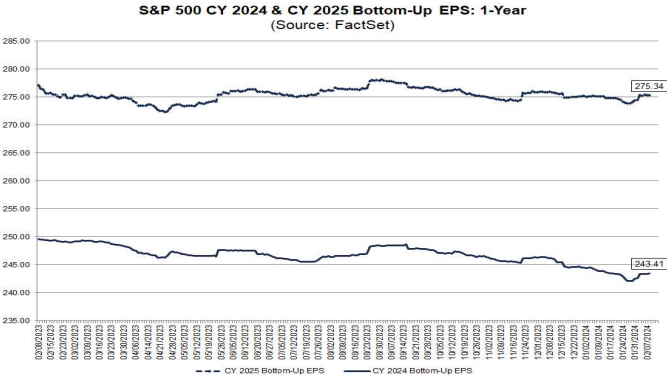
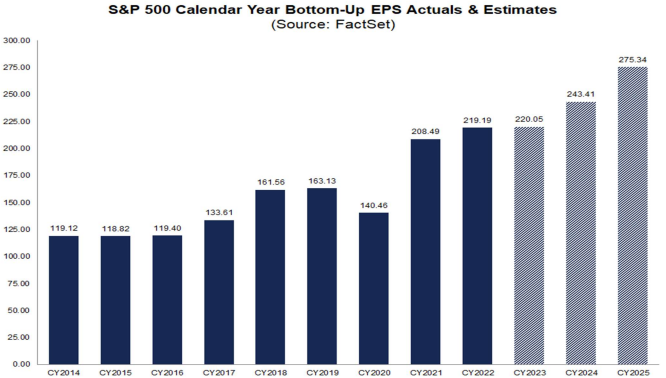
FactSet publishes a report titled “Earnings Insight” that contains a variety of information including the trends and expectations of S&P500 earnings.
For reference purposes, here are two charts as seen in the “Earnings Insight” report of February 9, 2024:
from page 32:
(click on charts to enlarge images)
from page 33:
_____
I post various economic forecasts because I believe they should be carefully monitored. However, as those familiar with this site are aware, I do not agree with many of the consensus estimates and much of the commentary in these forecast surveys.
_____
The Special Note summarizes my overall thoughts about our economic situation
As many are aware, Refinitiv publishes earnings estimates for the S&P500. (My other posts concerning S&P earnings estimates can be found under the S&P500 Earnings label)
The following estimates are from Exhibit 24 of the “S&P500 Earnings Scorecard” (pdf) of February 9, 2024, and represent an aggregation of individual S&P500 component “bottom up” analyst forecasts. For reference, the Year 2014 value is $118.78/share; the Year 2015 value is $117.46/share; the Year 2016 value is $118.10/share; the Year 2017 value is $132.00/share; the Year 2018 value is $161.93/share; the Year 2019 value is $162.93/share; the Year 2020 value is $139.72/share; the year 2021 value is $208.12/share; and the year 2022 value is $218.09/share:
Year 2023 estimate:
$224.55/share
Year 2024 estimate:
$243.12/share
Year 2025 estimate:
$274.92/share
_____
I post various economic forecasts because I believe they should be carefully monitored. However, as those familiar with this site are aware, I do not agree with many of the consensus estimates and much of the commentary in these forecast surveys.
_____
The Special Note summarizes my overall thoughts about our economic situation