Friday, March 29, 2019

Consumer Confidence Surveys – As Of March 29, 2019

The Doug Short site had a post of March 29, 2019 (“Michigan Consumer Sentiment: March Final Rebounded“) that displays the latest Conference Board Consumer Confidence and Thomson/Reuters University of Michigan Consumer Sentiment Index charts.  They are presented below:
(click on charts to enlarge images)
Conference Board Consumer Confidence Index
University of Michigan Consumer Sentiment Index
There are a few aspects of the above charts that I find highly noteworthy.  Of course, until the sudden upswing in 2014, the continued subdued absolute levels of these two surveys was disconcerting.
Also, I find the “behavior” of these readings to be quite disparate as compared to the other post-recession periods, as shown in the charts between the gray shaded areas (the gray areas denote recessions as defined by the NBER.)
While I don’t believe that confidence surveys should be overemphasized, I find these readings to be notable, especially in light of a variety of other highly disconcerting measures highlighted throughout this site.
_____
The Special Note summarizes my overall thoughts about our economic situation
SPX at 2827.25 as this post is written

Thursday, March 28, 2019

Corporate Profits As A Percentage Of GDP

In the last post (“4th Quarter 2018 Corporate Profits“) I displayed, for reference purposes, a long-term chart depicting Corporate Profits After Tax.
There are many ways to view this measure, both on an absolute as well as relative basis.
One relative measure is viewing Corporate Profits as a Percentage of GDP.  I feel that this metric is important for a variety of reasons.  As well, the measure is important to a variety of parties, including investors, businesses, and government policy makers.
As one can see from the long-term chart below (updated through the fourth quarter), (After Tax) Corporate Profits as a Percentage of GDP is at levels that can be seen as historically (very) high.  While there are many reasons as to why this is so, from a going-forward standpoint I think it is important to recognize both that such a notable condition exists, as well as contemplate and/or plan for such factors and conditions that would come about if (and in my opinion “when”) a more historically “normal” ratio of Corporate Profits as a Percentage of GDP occurs.  This topic can be very complex in nature, and depends upon myriad factors.  In my opinion it deserves far greater recognition.
(click on chart to enlarge image)
After-Tax Corporate Profits As A Percentage Of GDP
Data Source: FRED, Federal Reserve Economic Data, Federal Reserve Bank of St. Louis; accessed March 28, 2019
_____
The Special Note summarizes my overall thoughts about our economic situation
SPX at 2816.08 as this post is written

4th Quarter 2018 Corporate Profits

Today’s (March 28, 2019) GDP release (Q4 2018,Third Estimate) was accompanied by the Bureau of Economic Analysis (BEA) Corporate Profits report (Preliminary Estimate) for the 4th Quarter.
Of course, there are many ways to adjust and depict overall Corporate Profits.  For reference purposes, here is a chart from the St. Louis Federal Reserve (FRED) showing the Corporate Profits After Tax (without IVA and CCAdj) (last updated March 28, 2019, with a value of $1946.013 Billion SAAR):
Corporate Profits After Tax (without IVA and CCAdj) chart
Here is the Corporate Profits After Tax measure shown on a Percentage Change from a Year Ago perspective:
Corporate Profits After Tax (without IVA and CCAdj) Percent Change From Year Ago chart
Data Source: FRED, Federal Reserve Economic Data, Federal Reserve Bank of St. Louis: Corporate Profits After Tax [CP]; U.S. Department of Commerce: Bureau of Economic Analysis; accessed March 28, 2019; https://research.stlouisfed.org/fred2/series/CP
_________
I post various indicators and indices because I believe they should be carefully monitored.  However, as those familiar with this site are aware, I do not necessarily agree with what they depict or imply.
_____
The Special Note summarizes my overall thoughts about our economic situation
SPX at 2809.35 as this post is written

Deloitte “CFO Signals” Report Q1 2019 – Notable Aspects

Recently Deloitte released their “CFO Signals” “High-Level Summary” report for the 1st Quarter of 2019.
As seen in page 2 of the report, there were 158 survey respondents.  As stated:
“Each quarter (since 2Q10), CFO Signals has tracked the thinking and actions of CFOs representing many of North America’s largest and most influential companies.
All respondents are CFOs from the US, Canada, and Mexico, and the vast majority are from companies with more than $1 billion in annual revenue. For a summary of this quarter’s response demographics, please see the sidebars and charts on this page. For other information about participation and methodology, please contact nacfosurvey@deloitte.com.”
Here are some of the excerpts that I found notable:
from page 3:

Perceptions

How do you regard the status of the North American, European, and Chinese economies? Perceptions of North America declined, with 80% of CFOs rating current conditions as good (down from 88% last quarter), and 28% expecting better conditions in a year (even with last quarter). Perceptions of Europe declined to just 16% and 8%; China slid to 20% and 16%. Page 6.
What is your perception of the capital markets? Seventy percent of CFOs say debt financing is attractive (up from 62%). Equity financing attractiveness fell for both public (from 35% to 25%) and private (37% to 27%) company CFOs. Just 46% now say US equities are overvalued—a three-year low. Page 7.

Sentiment

Overall, what external/internal risks worry you the most? CFOs express even stronger concerns about trade policies/tariffs, economic risks/slowdowns, and US political turmoil. Talent is again the dominant internal concern. Page 8.
Compared to three months ago, how do you feel about the financial prospects for your company? The net optimism index rebounded from last quarter’s dismal +3 to +16 this quarter—better, but still the third-lowest reading in three years. Thirty-two percent of CFOs express rising optimism (26% last quarter), and 16% express declining optimism (23% last quarter). Page 9.

Expectations

What is your company’s business focus for the next year? CFOs indicate a bias toward revenue growth over cost reduction (51% vs. 25%); investing cash over returning it (46% vs. 19%); current offerings over new ones (40% vs. 36%); and current geographies over new ones (64% vs. 12%). Page 10.
How do you expect your key operating metrics to change over the next 12 months? YOY revenue growth expectations fell from 5.5% to 4.8%, earnings growth slid from 7.3% to 7.1%, capital spending rose from 5.0% to 5.9%, and hiring fell from 3.2% to 2.1% (all sit below their two-year averages). Dividend growth declined from 4.5% to 3.9%, the lowest level since 4Q17. Page 11.

Special topic: Downturn planning and Washington policy focus

Where does your company stand with respect to downturn planning? Nearly 85% of CFOs say they expect a US downturn by the end of 2020, and they overwhelmingly expect a slowdown rather than a recession. A minority say they have detailed defensive or opportunistic plans. Pages 12-13.
If you believe a downturn will occur, what is driving your belief? CFOs were most likely to cite US trade policy, business and credit cycles, and the impacts of slowing growth in China and Europe on the US economy. Page 12.
What defensive actions will your company take? The most common actions involve reducing spending and limiting or reducing headcount. Page 14.
In which policy areas would your company like to see Washington provide clarity/change first? CFOs overwhelmingly rate trade policy the most important policy area, with infrastructure investment a distant second. Page 15.
from page 9:

Sentiment

Optimism regarding own-companies’ prospects

Own-company optimism rebounded from last quarter’s 10-quarter low, but it remains at one of its lowest levels in three years. The proportion citing “no change” reached a new survey high— likely a negative sign given last quarter’s strong pessimism. 
Last quarter’s net optimism declined sharply to just +3—the lowest reading since 1Q16. This quarter it rose to +16, but it still represents the third-lowest reading in three years. Thirty-two percent of CFOs expressed rising optimism (up from 26%), and 16% cited declining optimism (down from 23%).
Net optimism for the US improved from last quarter’s +9 to +19—still its second-lowest level in more than two years. Canada rebounded from last quarter’s dismal -36 to +25. Mexico fell again and is at its lowest point since 1Q17 at -60.
Manufacturing, Retail/Wholesale, and Healthcare/Pharma were comparatively pessimistic (all at zero). Financial Services and Services were much stronger, with both above +30.
Please see the full report for industry-specific charts. Note that industry sample sizes vary markedly and that the means are most volatile for the least-represented. Due to a very small sample size, T/M/E was not used as a comparison point this quarter.
from page 11:

Expectations

Growth in key metrics, year-over-year

Expectations for revenue, earnings, dividends, hiring, and wages all declined (only capital spending rose), and all metrics sit below their two-year averages.
Revenue growth declined from 5.5% to 4.8%, one of its lowest levels in two years. The US fell to a two-year low. Canada rose, but is below its two year average. Mexico declined and is below its two-year average. Technology and Energy/Resources lead; Manufacturing and Retail/Wholesale trail.
Earnings growth declined from 7.3% to 7.1%, a two-year low. The US fell to a two-year low. Canada improved, but sits at its second-lowest level in three years. Mexico remained near its two-year average. Retail/Wholesale and Healthcare/ Pharma are highest; Manufacturing is lowest.
Capital spending growth rose from 5.0% to 5.9%, but is still the second lowest level in two years. The US rose, but sits at its second-lowest level in two years. Mexico rose sharply but remains below its two-year average. Canada rose above its two-year average. Healthcare/Pharma and Retail/ Wholesale are highest; Manufacturing is lowest.
Domestic personnel growth fell from 3.2% to 2.1%, the second-lowest level in two years. The US fell to its lowest level in more than a year. Canada declined to near its two-year average; Mexico fell to a five-year low. Services and Technology lead; Energy/Resources trails.
Dividend growth declined from 4.5% to 3.9%, the lowest level since 4Q17.
Please see the full report for industry-specific charts. Note that industry sample sizes vary markedly and that the means are most volatile for the least-represented. Due to a very small sample size, T/M/E was not used as a comparison point this quarter.
Among the various charts and graphics in the report are graphics depicting trends in “Own Company Optimism” on page 9 and “Economic Optimism” found on page 6.
_____
I post various business and economic surveys because I believe they should be carefully monitored.  However, as those familiar with this site are aware, I do not necessarily agree with many of the consensus estimates and much of the commentary in these surveys.
_____
The Special Note summarizes my overall thoughts about our economic situation
SPX at 2805.37 as this post is written

Wednesday, March 27, 2019

Chicago Fed National Financial Conditions Index (NFCI)

The St. Louis Fed’s Financial Stress Index (STLFSI) is one index that is supposed to measure stress in the financial system.  Its reading as of the March 21, 2019 update (reflecting data through March 15, 2019) is -1.256.
Of course, there are a variety of other measures and indices that are supposed to measure financial stress and other related issues, both from the Federal Reserve as well as from private sources.
Two other indices that I regularly monitor include the Chicago Fed National Financial Conditions Index (NFCI) as well as the Chicago Fed Adjusted National Financial Conditions Index (ANFCI).
Here are summary descriptions of each, as seen in FRED:
The National Financial Conditions Index (NFCI) measures risk, liquidity and leverage in money markets and debt and equity markets as well as in the traditional and “shadow” banking systems. Positive values of the NFCI indicate financial conditions that are tighter than average, while negative values indicate financial conditions that are looser than average.
The adjusted NFCI (ANFCI). This index isolates a component of financial conditions uncorrelated with economic conditions to provide an update on how financial conditions compare with current economic conditions.
For further information, please visit the Federal Reserve Bank of Chicago’s web site:
Below are the most recently updated charts of the NFCI and ANFCI, respectively.
The NFCI chart below was last updated on March 27, 2019 incorporating data from January 8, 1971 through March 22, 2019, on a weekly basis.  The March 22 value is -.88:
NFCI
Data Source: FRED, Federal Reserve Economic Data, Federal Reserve Bank of St. Louis; accessed March 27, 2019: 
http://research.stlouisfed.org/fred2/series/NFCI
The ANFCI chart below was last updated on March 27, 2019 incorporating data from January 8, 1971 through March 22, 2019, on a weekly basis.  The March 22 value is -.72:
ANFCI
Data Source: FRED, Federal Reserve Economic Data, Federal Reserve Bank of St. Louis; accessed March 27, 2019: 
http://research.stlouisfed.org/fred2/series/ANFCI
_________
I post various indicators and indices because I believe they should be carefully monitored.  However, as those familiar with this site are aware, I do not necessarily agree with what they depict or imply.
_____
The Special Note summarizes my overall thoughts about our economic situation
SPX at 2818.58 as this post is written

Tuesday, March 26, 2019

Money Supply Charts Through February 2019

For reference purposes, below are two sets of charts depicting growth in the money supply.
The first shows the MZM (Money Zero Maturity), defined in FRED as the following:
M2 less small-denomination time deposits plus institutional money funds.
Money Zero Maturity is calculated by the Federal Reserve Bank of St. Louis.
Here is the “MZM Money Stock” (seasonally adjusted) chart, updated on March 22, 2019 depicting data through February 2019, with a value of $15,797.2 Billion:
MZMSL
Here is the “MZM Money Stock” chart on a “Percent Change From Year Ago” basis, with a current value of 3.2%:
MZMSL Percent Change From Year Ago
Data Source: FRED, Federal Reserve Economic Data, Federal Reserve Bank of St. Louis; accessed March 26, 2019;
https://research.stlouisfed.org/fred2/series/MZMSL
The second set shows M2, defined in FRED as the following:
M2 includes a broader set of financial assets held principally by households. M2 consists of M1 plus: (1) savings deposits (which include money market deposit accounts, or MMDAs); (2) small-denomination time deposits (time deposits in amounts of less than $100,000); and (3) balances in retail money market mutual funds (MMMFs). Seasonally adjusted M2 is computed by summing savings deposits, small-denomination time deposits, and retail MMMFs, each seasonally adjusted separately, and adding this result to seasonally adjusted M1.
Here is the “M2 Money Stock” (seasonally adjusted) chart, updated on March 21, 2019, depicting data through February 2019, with a value of $14,478.8 Billion:
M2SL
Here is the “M2 Money Stock” chart on a “Percent Change From Year Ago” basis, with a current value of 4.2%:
M2SL Percent Change From Year Ago
Data Source: FRED, Federal Reserve Economic Data, Federal Reserve Bank of St. Louis; accessed March 26, 2019;
https://research.stlouisfed.org/fred2/series/M2SL
_____
The Special Note summarizes my overall thoughts about our economic situation
SPX at 2824.92 as this post is written

Monday, March 25, 2019

Updates Of Economic Indicators March 2019

Here is an update of various indicators that are supposed to predict and/or depict economic activity. These indicators have been discussed in previous blog posts:
The March 2019 Chicago Fed National Activity Index (CFNAI) updated as of March 25, 2019:
The CFNAI, with current reading of -.29:
CFNAI
source:  Federal Reserve Bank of Chicago, Chicago Fed National Activity Index [CFNAI], retrieved from FRED, Federal Reserve Bank of St. Louis, March 25, 2019;
https://fred.stlouisfed.org/series/CFNAI
The CFNAI-MA3, with current reading of -.18:
CFNAIMA3
source:  Federal Reserve Bank of Chicago, Chicago Fed National Activity Index: Three Month Moving Average [CFNAIMA3], retrieved from FRED, Federal Reserve Bank of St. Louis, March 25, 2019;
https://fred.stlouisfed.org/series/CFNAIMA3
As of March 22, 2019 (incorporating data through March 15, 2019) the WLI was at 145.6 and the WLI, Gr. was at -2.3%.
A chart of the WLI,Gr., from the Doug Short’s site ECRI update post of March 23, 2019:
ECRI WLI,Gr.
Here is the latest chart, depicting the ADS Index from December 31, 2007 through March 16, 2019:
ADS Index
The Conference Board Leading (LEI), Coincident (CEI) Economic Indexes, and Lagging Economic Indicator (LAG):
As per the March 21, 2019 press release, titled “The Conference Board Leading Economic Index (LEI) for the U.S. Increased” (pdf) the LEI was at 111.5, the CEI was at 105.9, and the LAG was 107.0 in February.
An excerpt from the release:
“The US LEI increased in February for the first time in five months,” said Ataman Ozyildirim, Director of Economic Research at The Conference Board. “February’s improvement was driven by accommodative financial conditions and a rebound in stock prices, which more than offset weaknesses in the labor market components. Despite the latest results, the US LEI’s growth rate has slowed over the past six months, suggesting that while the economy will continue to expand in the near-term, its pace of growth could decelerate by year end.”
Here is a chart of the LEI from the Doug Short’s site Conference Board Leading Economic Indexupdate of March 21, 2019:
Conference Board LEI
_________
I post various indicators and indices because I believe they should be carefully monitored.  However, as those familiar with this site are aware, I do not necessarily agree with what they depict or imply.
_____
The Special Note summarizes my overall thoughts about our economic situation
SPX at 2798.27 as this post is written

Friday, March 22, 2019

Philadelphia Fed – 1st Quarter 2019 Survey Of Professional Forecasters

The Philadelphia Fed 1st Quarter 2019 Survey of Professional Forecasters was released on March 22, 2019.  This survey is somewhat unique in various regards, such as it incorporates a longer time frame for various measures.
The survey shows, among many measures, the following median expectations:
Real GDP: (annual average level)
full-year 2019:  2.4%
full-year 2020:  2.0%
full-year 2021:  1.8%
full-year 2022:  2.1%
Unemployment Rate: (annual average level)
for 2019: 3.7%
for 2020: 3.7%
for 2021: 4.0%
for 2022: 4.2%
Regarding the risk of a negative quarter in real GDP in any of the next few quarters, mean estimates are 16.7%, 11.2%, 14.5%, 17.9% and 21.9% for each of the quarters from Q1 2019 through Q1 2020, respectively.
As well, there are also a variety of time frames shown (present quarter through the year 2028) with the median expected inflation (annualized) of each.  Inflation is measured in Headline and Core CPI and Headline and Core PCE.  Over all time frames expectations are shown to be in the 1.1% to 2.4% range.
_____
I post various economic forecasts because I believe they should be carefully monitored.  However, as those familiar with this site are aware, I do not agree with many of the consensus estimates and much of the commentary in these forecast surveys.
_____
The Special Note summarizes my overall thoughts about our economic situation
SPX at 2829.62 as this post is written

The U.S. Economic Situation – March 22, 2019 Update

Perhaps the main reason that I write of our economic situation is that I continue to believe, based upon various analyses, that our economic situation is in many ways misunderstood.  While no one likes to contemplate a future rife with economic adversity, current and future economic problems must be properly recognized and rectified if high-quality, sustainable long-term economic vitality is to be realized.
There are an array of indications and other “warning signs” – many readily apparent – that current economic activity and financial market performance is accompanied by exceedingly perilous dynamics.
I have written extensively about this peril, including in the following:
Building Financial Danger” (ongoing updates)
My analyses continues to indicate that the growing level of financial danger will lead to the next stock market crash that will also involve (as seen in 2008) various other markets as well.  Key attributes of this next crash is its outsized magnitude (when viewed from an ultra-long term historical perspective) and the resulting economic impact.  This next financial crash is of tremendous concern, as my analyses indicate it will lead to a Super Depression – i.e. an economy characterized by deeply embedded, highly complex, and difficult-to-solve problems.
For long-term reference purposes, here is a chart of the Dow Jones Industrial Average since 1900, depicted on a monthly basis using a LOG scale (updated through March 20, 2019, with a last value of 25745.67):
(click on chart to enlarge image)(chart courtesy of StockCharts.com)
DJIA since 1900 chart
_____
The Special Note summarizes my overall thoughts about our economic situation
SPX at 2854.88 as this post is written

Thursday, March 21, 2019

Jerome Powell’s March 20, 2019 Press Conference – Notable Aspects

On Wednesday, March 20, 2019 Jerome Powell gave his scheduled March 2019 FOMC Press Conference. (link of video and related materials)
Below are Jerome Powell’s comments I found most notable – although I don’t necessarily agree with them – in the order they appear in the transcript.  These comments are excerpted from the “Transcript of Chairman Powell’s Press Conference“ (preliminary)(pdf) of March 20, 2019, with the accompanying “FOMC Statement” and “Economic Projections of Federal Reserve Board Members and Federal Reserve Bank Presidents, March 2019.“
From Chairman Powell’s opening comments:
CHAIR POWELL. Good afternoon everyone, and welcome.  I will begin with an overview of economic conditions and an explanation of the decisions the Committee made at today’s meeting.
My colleagues and I have one overarching goal: to sustain the economic expansion, with a strong job market and stable prices, for the benefit of the American people.  The U.S. economy is in a good place, and we will continue to use our monetary policy tools to help keep it there.  The jobs market is strong, showing healthier wage gains and prompting many people to join or remain in the workforce.  The unemployment rate is near historic lows, and inflation remains near our 2 percent goal.  We continue to expect that the American economy will grow at a solid pace in 2019, although likely slower than the very strong pace of 2018.  We believe that our current policy stance is appropriate.  
also:
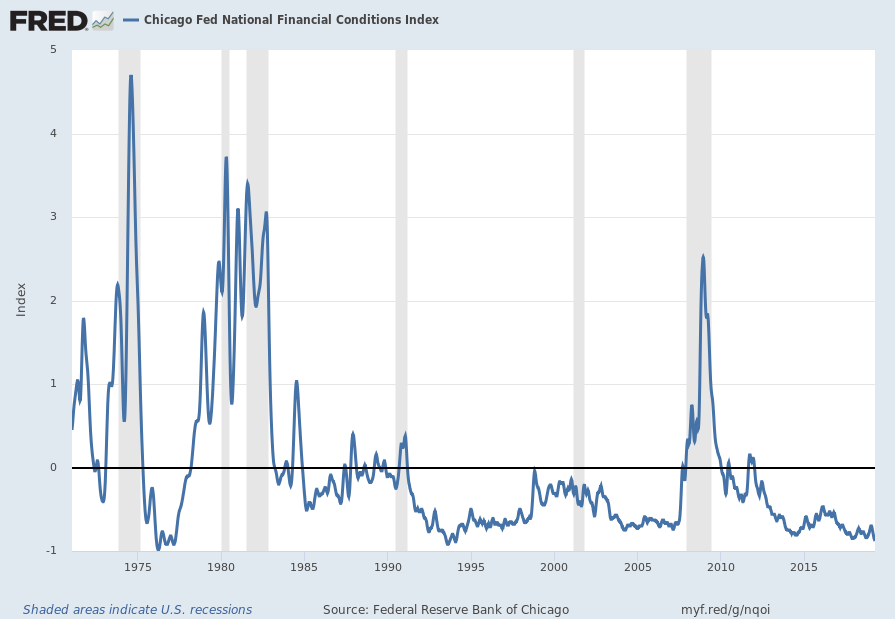
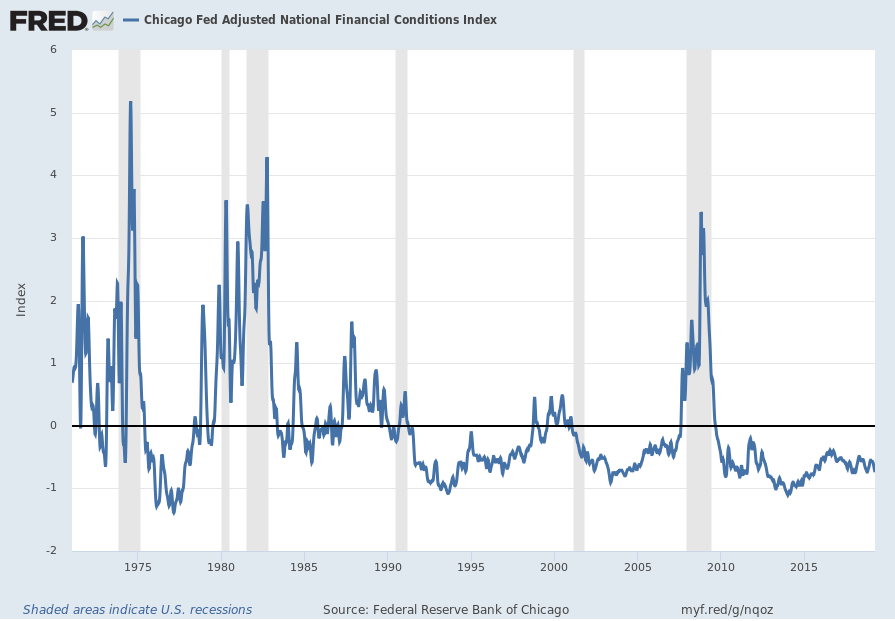
Data arriving since September suggest that growth is slowing somewhat more than expected.  Financial conditions tightened considerably over the fourth quarter.  While conditions have eased since then, they remain less supportive of growth than during most of 2018.  Growth has slowed in some foreign economies, notably in Europe and China.  While the U.S. economy showed little evidence of slowdown through the end of 2018, the limited data we have so far this year have been somewhat more mixed.  Unusually strong payroll job growth in January was followed by little growth at all in February.  Smoothing through these variations, average monthly job growth appears to have stepped down from last year’s strong pace, but job gains remain well above the pace necessary to provide jobs for new labor force entrants.  Many other labor market indicators continue to show strength.  Weak retail sales data for December bounced back considerably in January, but on balance seem to point to somewhat slower growth in consumer spending.  Business fixed investment also appears to be growing at a slower pace than last year.  Inflation has been muted, and some indicators of longer-term inflation expectations remain at the low end of their ranges in recent years.  Along with these developments, unresolved policy issues such as Brexit and the ongoing trade negotiations pose some risks to the outlook.
Jerome Powell’s responses as indicated to the various questions:
HEATHER LONG. Heather Long from the Washington Post. On the broader economy, can you clarify how worried the FOMC is about a steep slowdown. Some of the actions today look like there is more worry, and on the balance sheet, can you clarify, does the FOMC see the runoff as a form of monetary tightening? 
CHAIR POWELL. So, on the outlook, our outlook is a positive one. So, as I mentioned, FOMC participants continue to see growth this year of around two percent, just a bit below what we saw back in at the end of last year. And part of that is seeing that economic fundamentals, underlying economic fundamentals are still very strong. You have a strong labor market by most measures. You have rising incomes. You’ve got very low unemployment. You have confident surveys for households and also for businesses that are at attractive levels, and you also have financial conditions that are more accommodative than they were a couple of months ago. So, we see the outlook as a positive one. As far as balance sheet, the balance sheet plan, the answer to that is, you asked whether that’s related to our monetary policy in effect, and the answer is really no. We still think of the interest rate tool as the principal tool of monetary policy, and we think of ourselves as returning the balance sheet to a normal level over the course of the next six months, and were not really thinking of those as two different tools of monetary policy. 
STEVE LIESMAN. Steve Liesman, CNBC. Mr. Chairman, can you talk about how global developments are affecting the U.S.? What’s the cause of the weakness over there? How much is it responsible for the downgrade in GDP over here and what impact are tariffs both in the United States and retaliatory tariffs having on both the U.S. and the global economies? Thank you. 
CHAIR POWELL. So, global economy was a tailwind for the United States in 2017. That was the year of synchronized global growth, and we began 2018 expecting and hoping for more of the same. What happened instead is that the global economy started to gradually slow, and now we see a situation where the European economy has slowed substantially and so has the Chinese economy, although the European economy more. And just as strong global growth was a tailwind, weaker global growth can be a headwind to our economy. How big is that effect? It’s hard to be precise about it, but clearly we will feel that. It is an integrated global economy, and global financial markets are integrated as well. In terms of what’s causing it, it seems to be a range of different things. In China you have, you know, factors that are very specific to China. The main point though is that I would say the outlook, let’s look at the outlook, Chinese authorities have taken many steps since the middle of last year to support economic activity, and
I think the base case is that ultimately Chinese activity will stabilize at an attractive level. And in Europe, you know, we see some weakening, but, again, we don’t see, we don’t see recession, and we do see positive growth still. You ask about tariffs. I would say tariffs may be a factor in China. I don’t think they’re the main factor. I think the main factors are the levering campaign that the government undertook a couple of years ago and also just the longer term slowing to a more sustainable pace of growth that economies find as they mature. In terms of our own economy, the level of tariffs is relatively small in the size of our economy, relative to the size of our economy. We have since the beginning of the year and before really been hearing from our extensive network of business contacts, a lot of concerns about tariffs, concerns about material costs on imported products and the loss of markets and things like that, depending on which industry. So, there’s a fair amount of uncertainty. It’s hard to say how much of an effect that’s having on our economy. It’s very hard to tease that apart, but I will say it’s been a prominent concern among our business contacts for some time now.
also:
JIM TANKERSLEY. Hi, Mr. Chairman, Jim Tankersley, New York Times. I’m curious, you’re now a full percentage point, actually more than a percentage point below the White House in your projections for growth this year. By my calculations, that’s the largest spread we’ve seen since the end of the recession between the White House and the Fed. Why, for one, do you see, do you see the economy so differently than they do, and do you worry at all about implications for policy from that? 
CHAIR POWELL. I haven’t, I haven’t seen their projection. I wouldn’t comment on their projection. I would take it this way. You can think of growth as being composed of two things. And one is really growth in the workforce, more hours worked, and the other is productivity. Its output per hour. You can really think of growth as those two things. And I’ve been calling, often mentioned these days that it would be great if we had national level policies to support higher labor force participation. The United States is now one of the lowest countries among the advanced economies in terms of our labor force participation by prime age workers. And that’s a place where we can grow faster. If we can bring more people into the labor force and give them a chance to contribute to and benefit from our overall prosperity, that will be a great thing for the country. So, I would like to see that. Productivity is much harder. Very difficult to project productivity over long stretches of time. It’s a function of evolving technology. So, I guess I would say what’s the, what is the potential growth rate? It’s quite hard to know with any precision, and I just would like to see us, you know, undertake an effort to make it be as high as it can sustainably be. 
JIM TANKERSLEY. If I could follow up on that, do you see the tax cuts, the 2017 tax cuts as having provided a large boost to labor force participation as the White House does. 
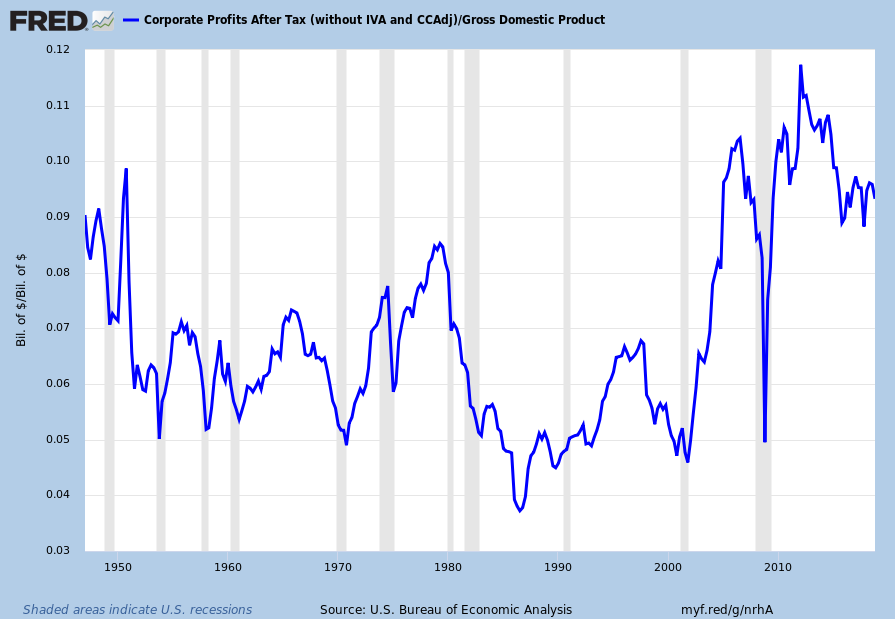
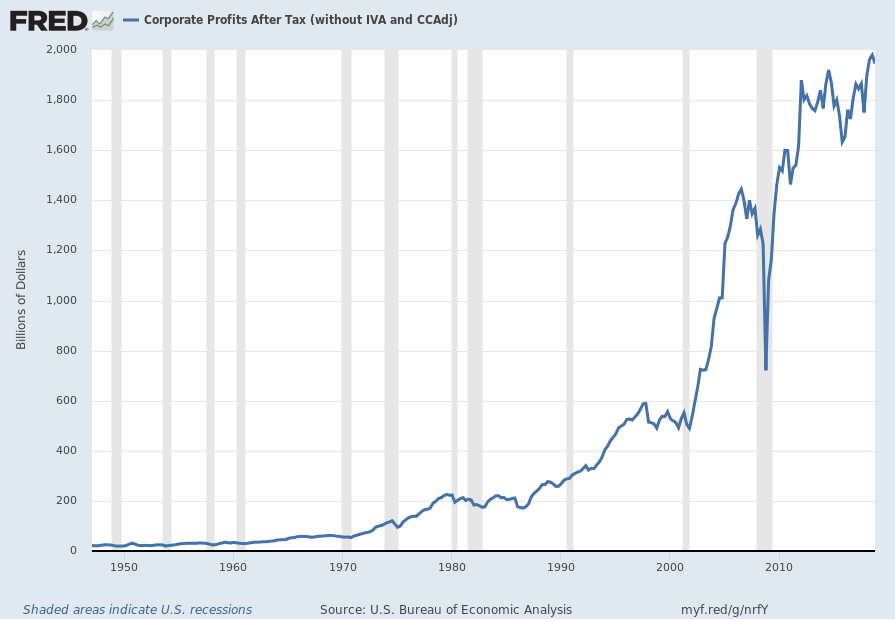
CHAIR POWELL. I would say so. I think it’s clear that the tax and spending policies that were adopted early last year supported demand in a significant way last year. And it’s also the case, I think, that they should have some supply side effects. I think it’s hard to know, it’s hard to identify those with any precision, and we hope they’re, we hope they’re very large. And the idea would be that lowering corporate taxes would spur more corporate investment, which would spur more productivity, and lowering individual taxes would spur greater labor force participation. I wouldn’t want to be handing, you know, assigning creditor blame for that, but I do think that the performance of labor force participation over the last really three or four years has been an upside surprise that most people didn’t see coming, and it’s extremely welcome.
also:
TREVOR HUNNICUTT. Trevor Hunnicutt from Reuters. You mentioned that you have kind of a positive outlook as it regards the economy but also see slower growth on the household side and the business side. Given how big of a part of the U.S. economy that is, what gives you kind of confidence that the slowdown we’re seeing is temporary. 
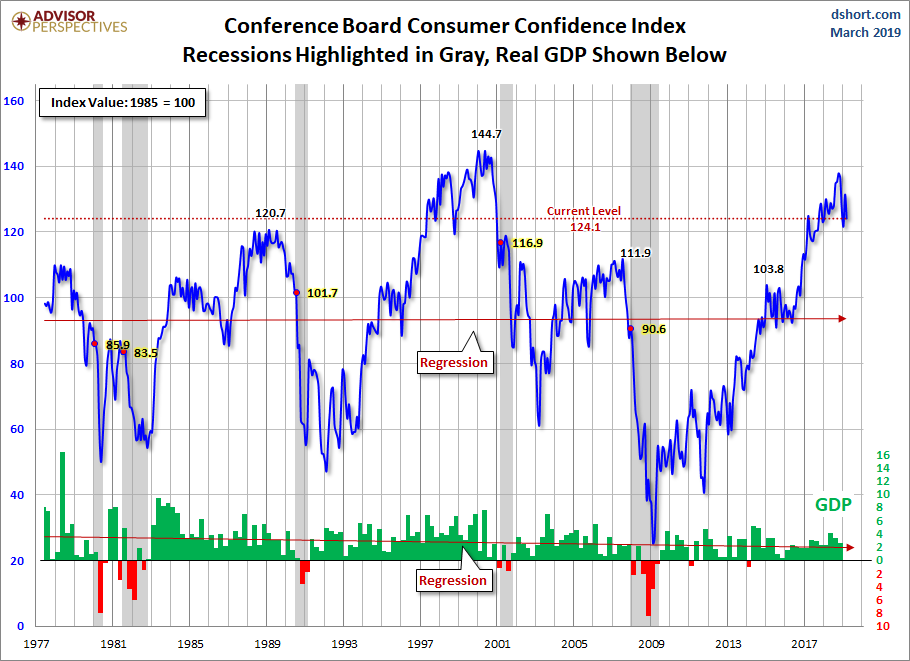
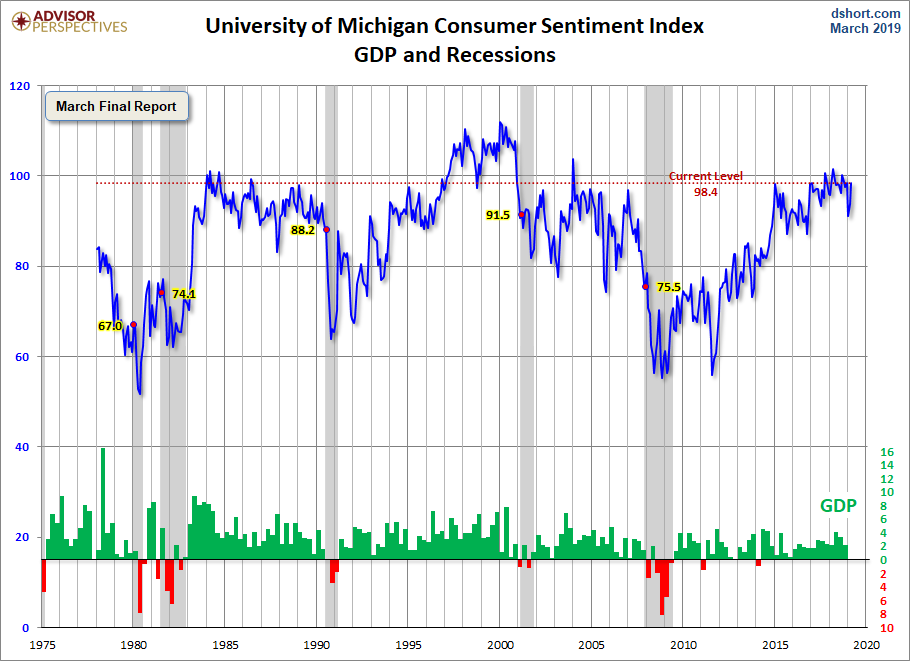
CHAIR POWELL. So on the household side, what we saw was a very weak reading on retail sales in December and then a bounceback in the January reading, and, you know, it was a surprise, I would say, and inconsistent with a significant amount of other data. We’re not dismissing it in any way, but I would go back to what is it that supports consumer spending. It’s 70 percent of the economy, as you point out, and its strong economic underlying fundamentals. So, rising wages, high levels of employment, low levels of unemployment, high levels of job creation. Confidence. 
The household confidence surveys have moved back up to where they were last summer. So we look at those fundamentals, and we think that looks like a setting in which consumption will have support from underlying economic fundamentals. And that’s really what we’re thinking there. So, you know, we’re also patiently watching and waiting and not assuming. We’re not taking no signal from the incoming data. That’s why we called it out in our statement. So, I think our eyes are open on this. 
NICK TIMIRAOS. Nick Timiraos of the Wall Street Journal. Chair Powell, in 1998 the Fed eased policy in a way that some say may have avoided a recession, others say may have helped fuel the NASDAQ tech stock bubble, and financial conditions have eased considerably this year since the policy pivot that you made clear in January, the S&P, for example, it’s just three percent below last summer’s peak. And so I wonder, does this episode from 20 years ago bear at all on your thinking today about the risks posed by rising asset values in an environment of a shallower policy path? 
CHAIR POWELL. We’re in a very different world today and post crisis, because we now very carefully monitor financial conditions and financial stability concerns on an ongoing basis, and we publish a report twice a year, and we have quarterly board meeting and briefings where we look deeply into these things. So this is something we have very much on our radar screen. 
And I would say overall we don’t see financial stability vulnerabilities as high. There are some aspects of the financial markets that we’re carefully monitoring, and those are in the nature of things that might be amplifiers to a downturn as opposed to a financial stability concern, which might lead to a financial crisis and that kind of thing, which we don’t see. 
So, we do monitor that, and I would also say, you know, that the whole question of monetary policy and financial stability is an unsettled and difficult one in our world. We do think that the principal tools for, you know, for managing financial stability are regulation, supervision, macroprudential tools, and those sorts of things as opposed to changing the interest rate. But we’re certainly very mindful of financial conditions and those risks. 
NICK TIMIRAOS. If I could ask a followup? If it’s the case that we’re in a lower neutral interest rate world where you could have more asset price appreciation, do you think the Fed needs more macroprudential tools so that it doesn’t have to lean on monetary to do so much. 
CHAIR POWELL. It’s a very difficult question with a long answer. We, in our system, we mainly rely on through the cycle tools like high capital and stress tests. Our financial stability system is built on those tools. High capital, high liquidity, resolution planning, stress testing. So those are always on. We also have some tools, like the countercyclical capital buffer, which we can deploy at times when vulnerabilities are meaningfully above normal. But we do rely on those tools. And I would say our banks are well capitalized. They’re far better capitalized and better aware of their risks and more liquid than they were before the financial crisis. So they’ll be more resilient in, you know, in difficult states of the economy. 
also:
NANCY MARSHALL-GENZER. Nancy Marshall-Genzer with Marketplace. Just a quick follow-up on Brexit. You mentioned that you’re making sure that U.S. financial institutions are ready for whatever outcome. I’m wondering, can you be a little more specific about that, and also how are you preparing for any pressures that a hard Brexit would put on the U.S. dollar?
CHAIR POWELL. Well, as I mentioned, you know, with the stress test that the largest financial institutions, and those are the ones that tend to be active internationally, that they undergo every year, we put them through very large financial shocks with large losses and big changes in markets every year. And we vary that every year. So, that’s a pretty good, you know, having done that for a number of years now, that’s, and having them be required to have adequate capital and liquidity even after all that happens. So that’s a good thing to have done knowing that you’re going into something that’s quite unknown, which may prove stressful. It may not prove stressful depending on what the outcome is. So, I think all that has probably prepared our institutions well. That said, nothing like this has happened in recent years, and so it’s really hard to be confident. So, we’re very watchful about what’s going on.
[ Inaudible Comment ]
So we don’t, you know, the dollar is really the business of the Treasury Department. It’s certainly a financial condition unto itself that plays into our models, but we don’t, you know, seek or model or attempt to affect the dollar directly with our policies.
_____
_____
The Special Note summarizes my overall thoughts about our economic situation
SPX at 2854.14 as this post is written