Friday, September 27, 2013

Deloitte “CFO Signals” Report 3Q 2013 – Notable Aspects

Recently Deloitte released their “CFO Signals” “High-Level Summary” report for the 3rd Quarter of 2013.

As seen in page 2 of the report, “One hundred and twenty-four CFOs responded during the two-week period ending August 23. Seventy-three percent of the respondents are from public companies, and 77% are from companies with more than $1B in annual revenue."

Here are some of the excerpts that I found notable:

from page 3 :

How do CFOs regard the current and future health of some of the world’s major economies?

CFOs are still feeling reasonably good about North America, but expectations for Europe are low, and expectations for China have fallen.  Nearly 38% rate North America’s economies as more good than bad (up from 30%), and more than half expect the economy to be stronger in a year. By comparison, only 26% regard China’s economy as good, and just 27% expect it to be better in a year; the numbers are 3% and 14% respectively for Europe.

What is the business focus for companies over the next year?

Companies still appear very focused on growth, but more appear to be reassessing their strategies. The vast majority of CFOs say their companies are focused on pursuing opportunity over limiting risk, and much more on growing and scaling than on contracting and rationalizing. Notable this quarter is an increasing bias toward planning over execution and toward direct-cost-reduction over indirectcost-reduction.

also:

How do companies expect performance, spending, and hiring to change over the next 12 months?

Growth and profitability expectations fell substantially this quarter, with sales growth expectations falling to just 5.0%* (well below the 7% long-term average) and earnings growth hitting a new low at just 8.0%* (well below the 12.3% historical average). Capital spending growth expectations fell sharply to just 4.9%*, and domestic hiring growth expectations declined to 1.3%*.

How does CFOs’ optimism regarding their companies’ prospects compare to last quarter?

CFO optimism has been high throughout 2013 and remains high this quarter – bucking a trend that typically sees a steep drop in the second and/or third quarters each year. Forty-two percent of CFOs express improved optimism about their companies’ prospects, and 24% express declining optimism.

from page 5 :

What’s next?

CFOs worsening expectations for key measures, such as sales, earnings, capital investment, and hiring are certainly a cause for concern. Add to this marked uncertainty around governments’ future responses to slow economic growth and geopolitical events, and it is difficult to see the pace of recovery quickening anytime soon.

from page 14:

Domestic hiring is expected to rise 1.3%—well below last quarter’s peak, but still above most recent quarters. The median is again 0%, but this quarter’s variability of responses is much lower than last quarter’s. Forty-seven percent of CFOs expect year-over-year gains (comparatively high), and 22% expect cuts (comparatively low).
_____

I post various business and economic surveys because I believe they should be carefully monitored.  However, as those familiar with this blog are aware, I do not necessarily agree with many of the consensus estimates and much of the commentary in these surveys.
_____

The Special Note summarizes my overall thoughts about our economic situation

SPX at 1688.07 as this post is written

Long-Term Charts Of The ECRI WLI & ECRI WLI, Gr. – September 27, 2013 Update

As I stated in my July 12, 2010 post (“ECRI WLI Growth History"):
For a variety of reasons, I am not as enamored with ECRI’s WLI and WLI Growth measures as many are.
However, I do think the measures are important and deserve close monitoring and scrutiny.
The movement of the ECRI WLI and WLI, Gr. is particularly notable at this time, as ECRI publicly announced on September 30, 2011 that the U.S. was “tipping into recession,” and ECRI has reiterated the view that the U.S. economy is currently in a recession, seen most recently in these seven sources :
Other past notable 2012 reaffirmations of the September 30, 2011 recession call by ECRI were seen (in chronological order)  on March 15 (“Why Our Recession Call Stands”) as well as various interviews and statements the week of May 6, including:
Also, subsequent to May 2012:
-

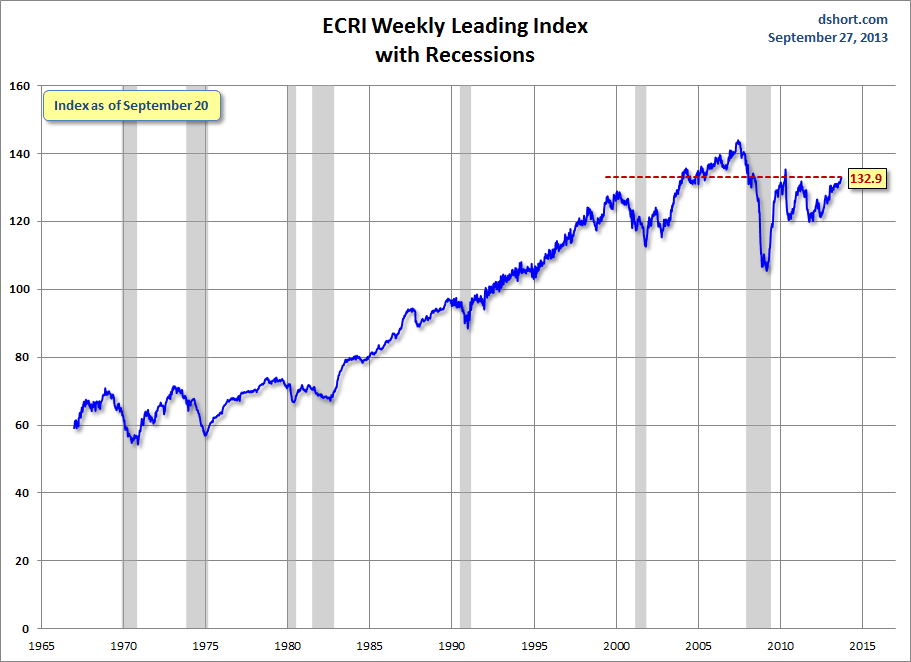
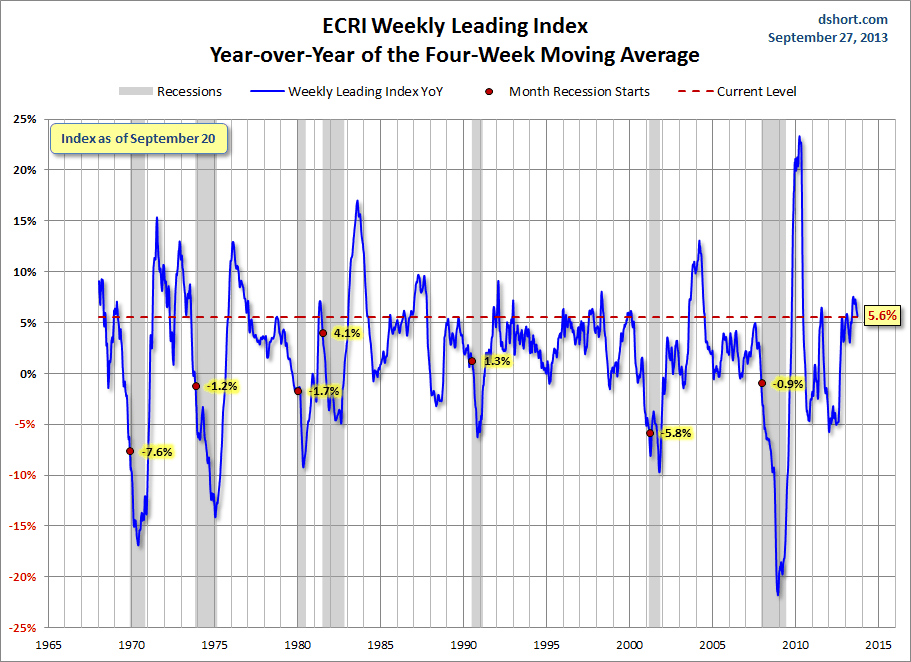
Below are three long-term charts, from Doug Short’s blog post of September 27 titled “ECRI Recession Watch:  Weekly Update.”  These charts are on a weekly basis through the September 27 release, indicating data through September 20, 2013.

Here is the ECRI WLI (defined at ECRI’s glossary):

(click on charts to enlarge images)

Dshort 9-27-13 ECRI-WLI 132.9

-

This next chart depicts, on a long-term basis, the Year-over-Year change in the 4-week moving average of the WLI:

Dshort 9-27-13 ECRI-WLI-YoY 5.6 percent

-

This last chart depicts, on a long-term basis, the WLI, Gr.:

Dshort 9-27-13 ECRI-WLI-growth-since-1965 4.9

_________

I post various economic indicators and indices because I believe they should be carefully monitored.  However, as those familiar with this blog are aware, I do not necessarily agree with what they depict or imply.
_____

The Special Note summarizes my overall thoughts about our economic situation

SPX at 1692.28 as this post is written
Thursday, September 26, 2013

St. Louis Financial Stress Index – September 26, 2013 Update

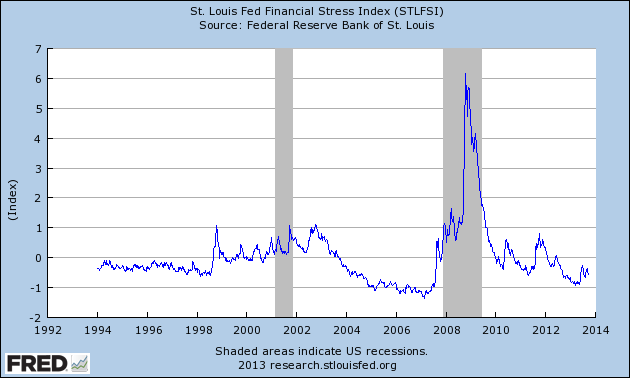
On March 28, 2011 I wrote a post ("The STLFSI") about the  St. Louis Fed’s Financial Stress Index (STLFSI) which is supposed to measure stress in the financial system.  For reference purposes, the most recent chart is seen below.  This chart was last updated on September 26, incorporating data from December 31,1993 to September 20, 2013, on a weekly basis.  The September 20, 2013 value is -.572:

(click on chart to enlarge image)

STLFSI_9-26-13 -.572

-

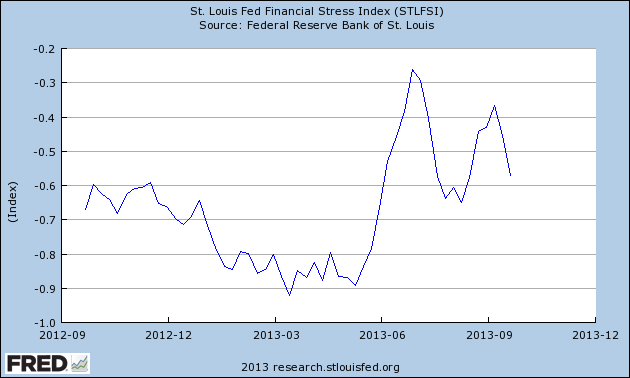
Here is the STLFSI chart from a 1-year perspective:

STLFSI_9-26-13 -.572 1-year
Data Source: FRED, Federal Reserve Economic Data, Federal Reserve Bank of St. Louis; accessed September 26, 2013:
_________

I post various indicators and indices because I believe they should be carefully monitored.  However, as those familiar with this blog are aware, I do not necessarily agree with what they depict or imply.
_____

The Special Note summarizes my overall thoughts about our economic situation

SPX at 1695.61 as this post is written
Median Household Income Chart

I have written many blog posts concerning the worrisome trends in income and earnings.

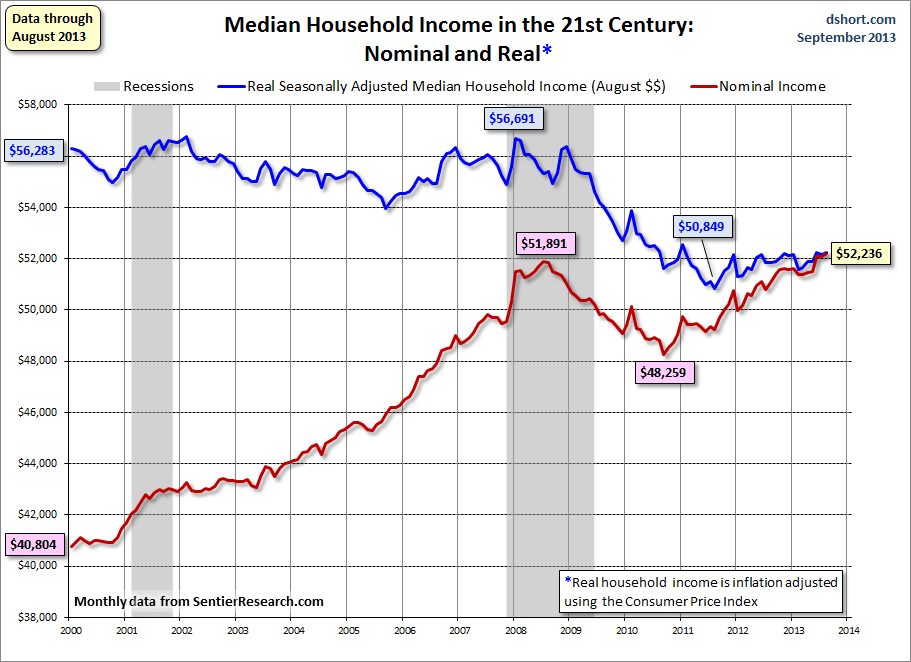
Doug Short, in his September 25 blog post, titled “Real Median Household Incomes:  'Stagnation Without Any Clear Trend'” produced the chart below.  It is based upon data from Sentier Research, and it shows both nominal and real median household incomes since 2000, as depicted.  As one can see, post-recession real median household income (seen in the blue line since 2009) is especially worrisome.

(click on chart to enlarge image)

Dshort 9-25-13 - household-income-monthly-median-since-2000

-

As Doug mentions in his aforementioned blog post:
As the excellent data from Sentier Research makes clear, the mainstream U.S. household was struggling before the Great Recession. At this point, real household incomes are in worse shape than they were four years ago when the recession ended.
Among other items seen in his blog post is a chart depicting each of the two (nominal and real household incomes) data series’ percent change over time since 2000.
_____

The Special Note summarizes my overall thoughts about our economic situation

SPX at 1702.97 as this post is written
Total Household Net Worth As Of 2Q 2013 – Two Long-Term Charts

In the last post ("Total Household Net Worth As A Percent Of GDP 2Q 2013") I displayed a long-term chart depicting Total Household Net Worth as a percentage of GDP.

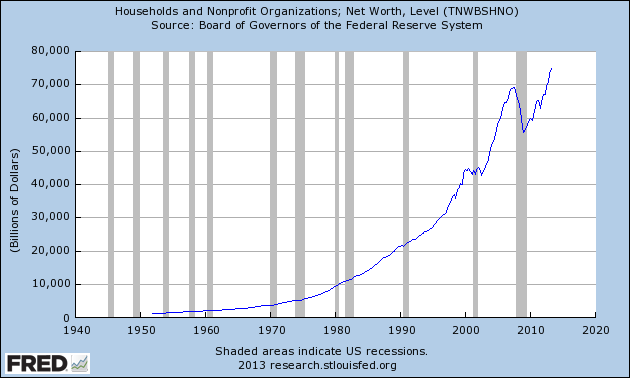
For reference purposes, here is Total Household Net Worth from a long-term perspective (from 1949:Q4 to 2013:Q2).  The last value (as of September 25, 2013) is $74.82094 Trillion:

(click on each chart to enlarge image)

TNWBSHNO_9-25-13 74820.94

-

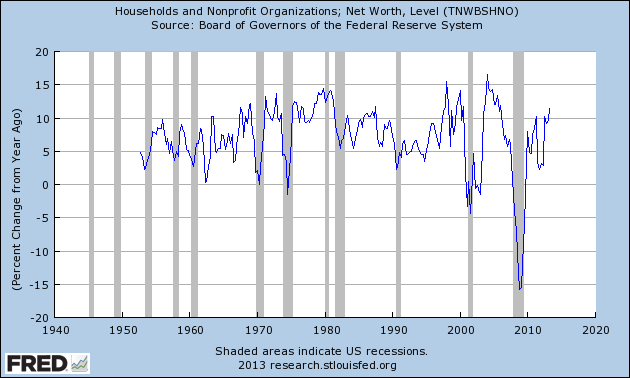
Also of interest is the same metric presented on a “Percent Change from a Year Ago” basis:

TNWBSHNO_9-25-13 74820.94 Percent Change From Year Ago
Data Source: FRED, Federal Reserve Economic Data, Board of Governors of the Federal Reserve System; accessed September 26, 2013:

_____

The Special Note summarizes my overall thoughts about our economic situation

SPX at 1692.77 as this post is written
Total Household Net Worth As A Percent Of GDP 2Q 2013

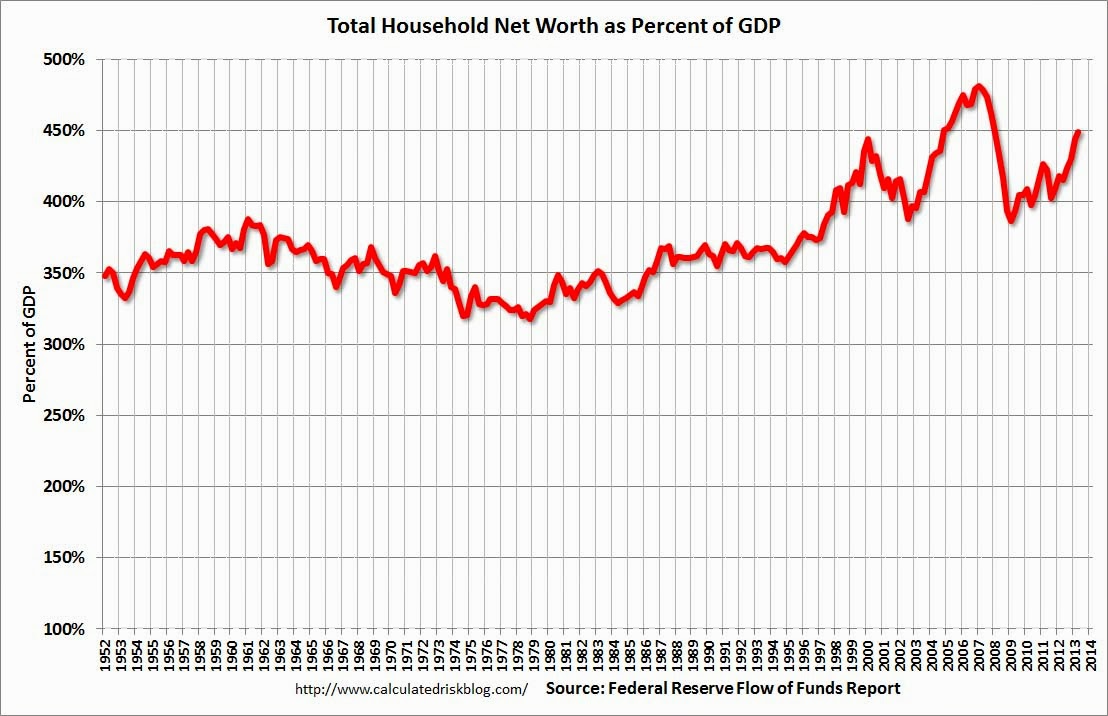
The following chart is from the CalculatedRisk blog post of September 25, 2013 titled “Fed’s Q2 Flow of Funds:  Household Mortgage Debt down $1.3 Trillion from Peak, Record Household Net Worth.” It depicts Total Household Net Worth as a Percent of GDP.  The underlying data is from the Federal Reserve Flow of Funds 2Q 2013 report:

(click on chart to enlarge image)

CR 9-25-13 - FFNetGDPQ22013

As seen in the above-referenced CalculatedRisk blog post:
According to the Fed, household net worth increased in Q2 compared to Q1, and is at a new record. Net worth peaked at $69.0 trillion in Q3 2007, and then net worth fell to $55.6 trillion in Q1 2009 (a loss of $13.4 trillion). Household net worth was at $74.8 trillion in Q2 2013 (up $19.2 trillion from the trough in Q1 2009).
The Fed estimated that the value of household real estate increased to $18.6 trillion in Q2 2013. The value of household real estate is still $4.0 trillion below the peak in early 2006.
My comments:

As I have written in previous posts on this Household Net Worth (as a percent of GDP) topic:
As one can see, the first outsized peak was in 2000, and attained after the stock market bull market / stock market bubbles and economic strength.  The second outsized peak was in 2007, right near the peak of the housing bubble as well as near the stock market peak.
As seen on the chart, the Total Household Net Worth is making an upturn, but is significantly below the prior 2007 peak.
I could extensively write about various interpretations that can be made from this chart.  One way this chart can be interpreted is a gauge of “what’s in it for me?” as far as the aggregated wealth citizens are gleaning from economic activity, as measured compared to GDP.
_____

The Special Note summarizes my overall thoughts about our economic situation

SPX at 1692.77 as this post is written
Wednesday, September 25, 2013

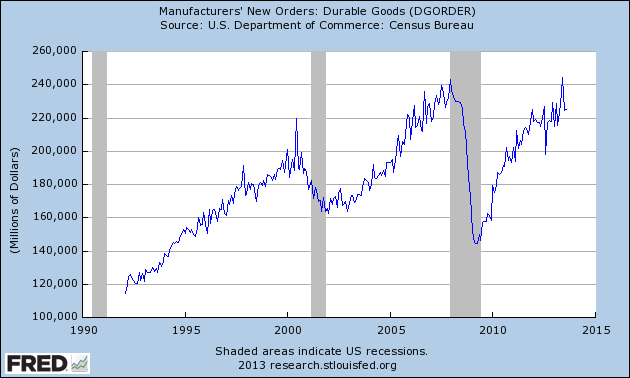
Durable Goods New Orders – Long-Term Charts Through August 2013

Many people place emphasis on Durable Goods New Orders as a prominent economic indicator and/or leading economic indicator.

For reference, below are charts depicting this measure.

First, from the St. Louis Fed site (FRED), a chart through August, last updated on September 25.  This value is 224,916 ($ Millions) :

(click on charts to enlarge images)

DGORDER_9-25-13 224916

-

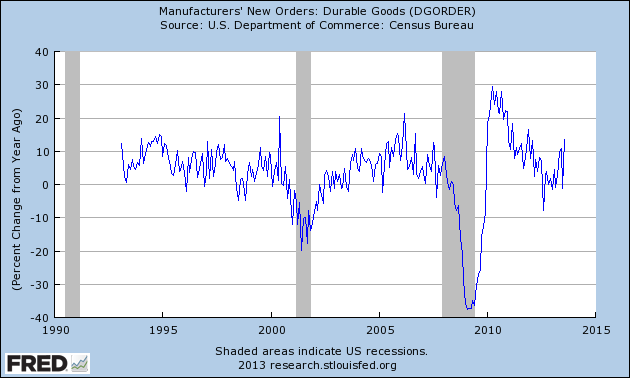
Here is the chart depicting this measure on a “Percentage Change from a Year Ago” basis:

DGORDER_9-25-13 224916 Percent Change From Year Ago
Data Source: FRED, Federal Reserve Economic Data, Federal Reserve Bank of St. Louis: Manufacturers’ New Orders:  Durable Goods [DGORDER] ; U.S. Department of Commerce: Census Bureau ; accessed September 25, 2013;

_________

I post various indicators and indices because I believe they should be carefully monitored.  However, as those familiar with this blog are aware, I do not necessarily agree with what they depict or imply.
_____

The Special Note summarizes my overall thoughts about our economic situation

SPX at 1694.25 as this post is written

Tuesday, September 24, 2013

Consumer Confidence Surveys – As Of September 24, 2013

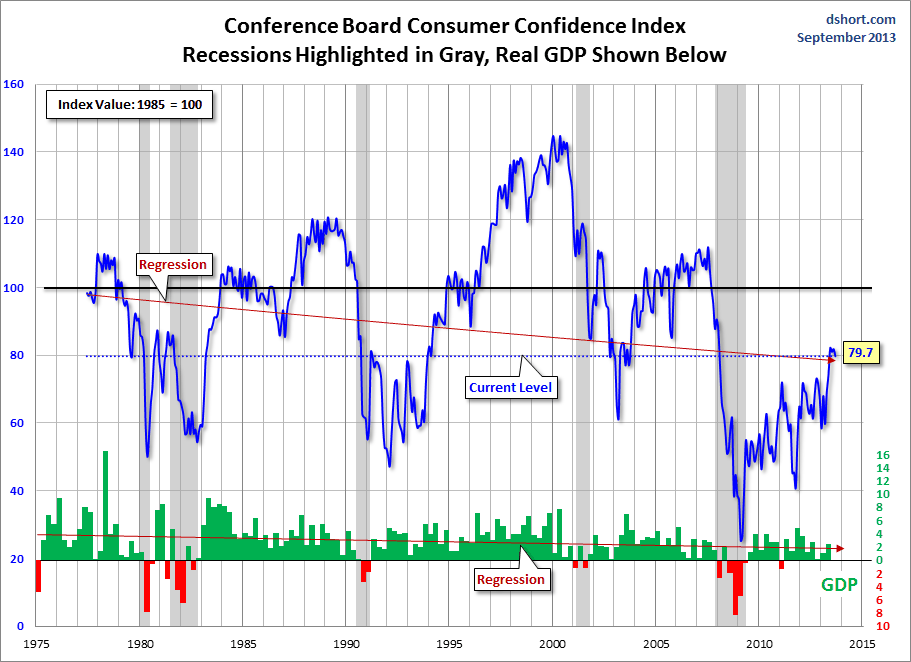
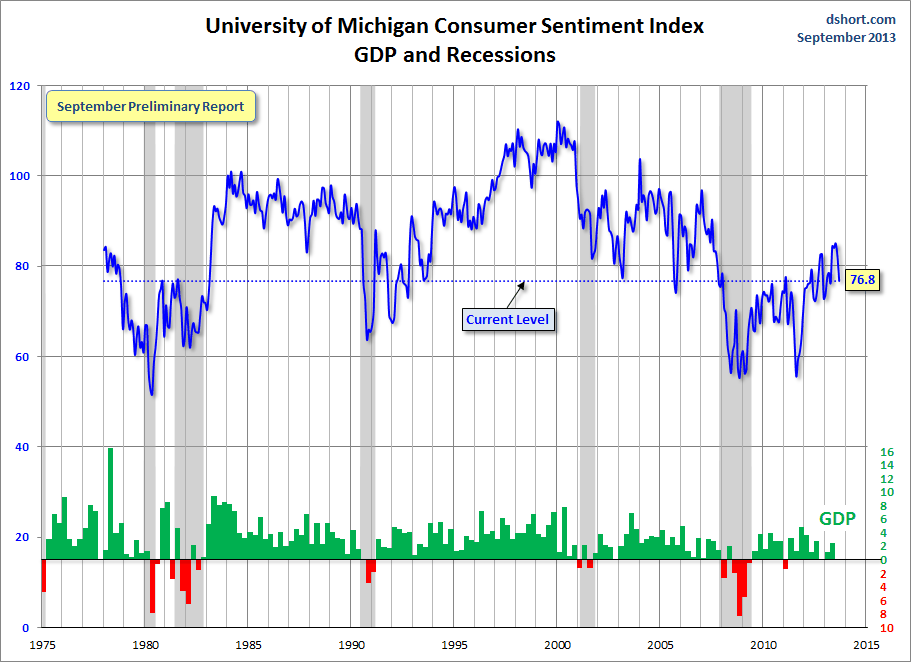
Doug Short had a blog post of September 24 ("Consumer Confidence Comes in a Bit Below Expectations") in which he presents the latest Conference Board Consumer Confidence and Thomson/Reuters University of Michigan Consumer Sentiment Index charts.  They are presented below:

(click on charts to enlarge images)

Dshort 9-24-13 Conference-Board-consumer-confidence-index

-

Dshort 9-24-13 Michigan-consumer-sentiment-index

-

There are a few aspects of the above charts that I find highly noteworthy.  Of course, the continuing subdued absolute levels of these two surveys is disconcerting.

Also, I find the “behavior” of these readings to be quite disparate as compared to the other post-recession periods, as shown in the charts between the gray shaded areas (the gray areas denote recessions as defined by the NBER.)

While I don’t believe that confidence surveys should be overemphasized, I find these readings to be very problematical, especially in light of a variety of other highly disconcerting measures highlighted throughout this blog.
_____

The Special Note summarizes my overall thoughts about our economic situation

SPX at 1704.25 as this post is written

Updates Of Economic Indicators September 2013

Here is an update on various indicators that are supposed to predict and/or depict economic activity.  These indicators have been discussed in previous blog posts:

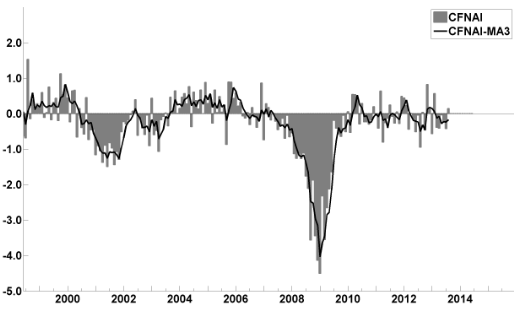
The September 2013 Chicago Fed National Activity Index (CFNAI)(pdf) updated as of September 23, 2013:

cfnai_monthly_MA3 9-23-13

-


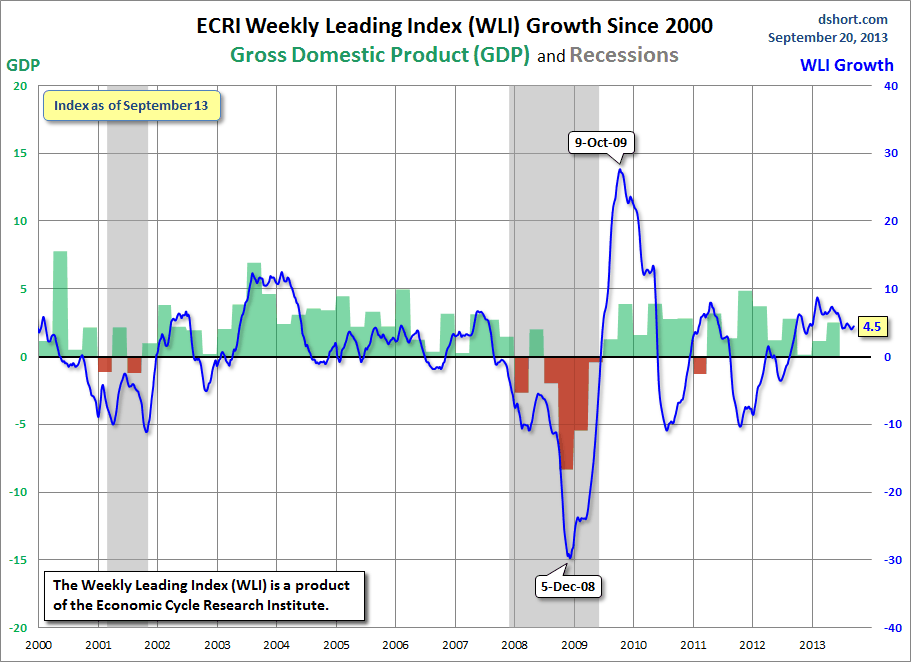
As of 9/20/13 (incorporating data through 9/13/13) the WLI was at 132.4 and the WLI, Gr. was at 4.5%.

A chart of the WLI, Gr. since 2000, from Doug Short’s blog of September 20 titled “ECRI Recession Watch:  Weekly Update” :

Dshort 9-20-13 ECRI-WLI-growth-since-2000 4.5

-


Here is the latest chart, depicting 12-31-07 through 9-14-13:

ads_12-31-07 through 9-14-13

-


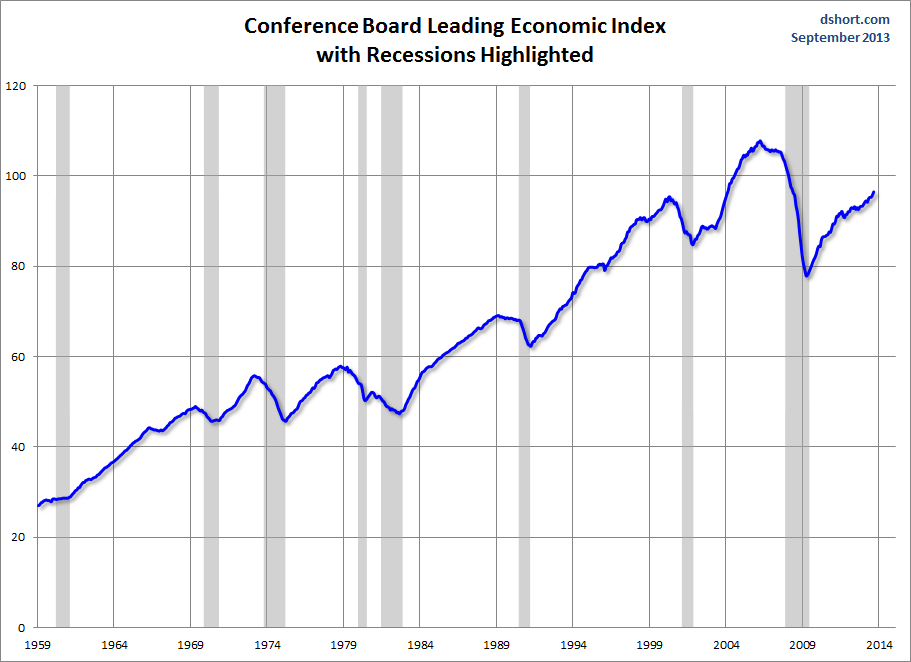
As per the September 19 press release, the LEI was at 96.6 and the CEI was at 106.3 in August.

An excerpt from the September 19 release:
“After a brief pause, the U.S. LEI rose sharply in July and August, resuming its upward trend,” said Ataman Ozyildirim, Economist at The Conference Board. “If the LEI’s six-month growth rate, which has nearly doubled, continues in the coming months, economic growth should gradually strengthen through the end of the year. Despite weakness in residential construction, consumer expectations, and the stock market, improvements in the LEI’s labor market and financial components, as well as new manufacturing orders, drove this month’s gain.”
Here is a chart of the LEI from Doug Short’s blog post of September 19 titled “Conference Board Leading Economic Index Continued to Rise in August" :

Dshort 9-19-13 CB-LEI

_________

I post various indicators and indices because I believe they should be carefully monitored.  However, as those familiar with this blog are aware, I do not necessarily agree with what they depict or imply.
_____

The Special Note summarizes my overall thoughts about our economic situation

SPX at 1701.84 as this post is written

Monday, September 23, 2013

Trends Of S&P500 Earnings Forecasts

S&P500 earnings trends and estimates are a notably important topic, for a variety of reasons, at this point in time.

FactSet publishes a report titled “Earnings Insight” that contains a variety of information including the trends and expectations of S&P500 earnings.

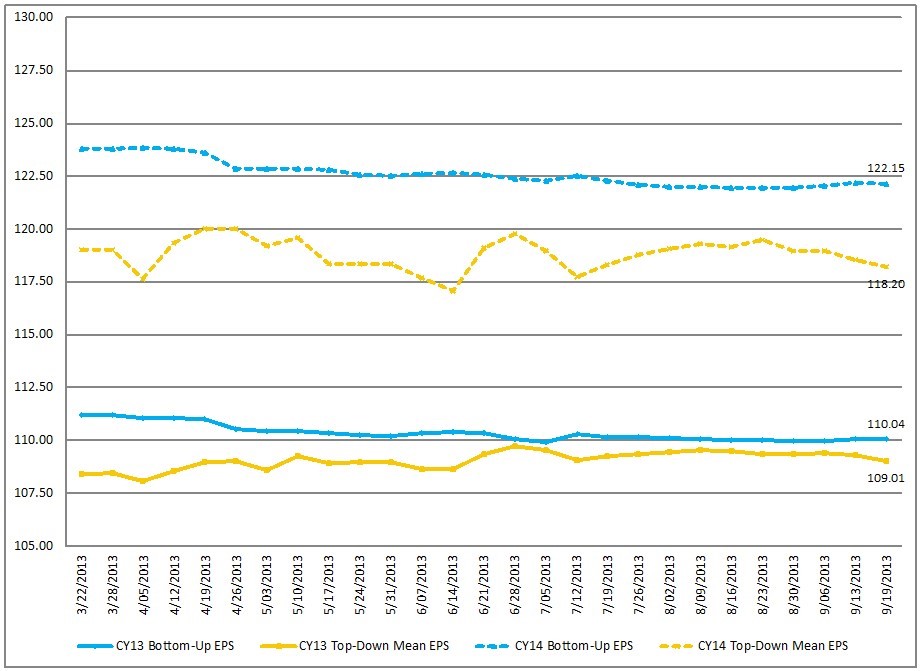
For reference purposes, here are two charts as seen in the “Earnings Insight” (pdf) report of September 20, 2013:

from page 16:

(click on charts to enlarge images)

CY Bottom-Up EPS vs. Top-Down Mean EPS (Trailing 26-Weeks)

FactSet Earnings Insight 9-20-13 CY2013 and CY2014

-

from page 17:

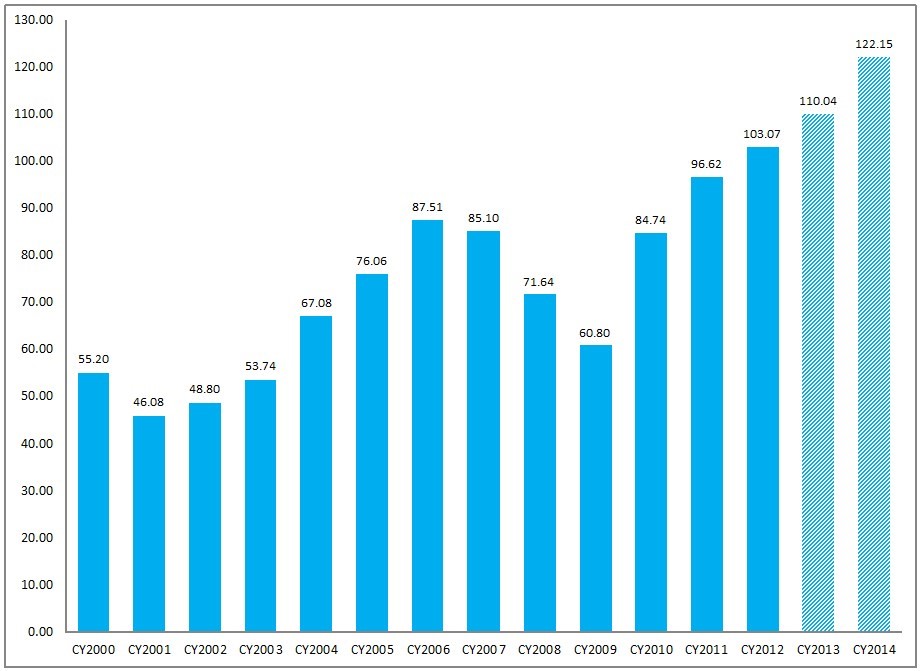
Calendar Year Bottom-Up EPS Actuals & Estimates

FactSet Earnings Insight 9-20-13 CY2000-CY2014

_____

I post various economic forecasts because I believe they should be carefully monitored.  However, as those familiar with this blog are aware, I do not agree with many of the consensus estimates and much of the commentary in these forecast surveys.
_____

The Special Note summarizes my overall thoughts about our economic situation

SPX at 1702.85 as this post is written

S&P500 Earnings Estimates For Years 2013, 2014, And 2015

As many are aware, Thomson Reuters publishes earnings estimates for the S&P500.  (My other posts concerning S&P earnings estimates can be found under the S&P500 Earnings label)

The following estimates are from Exhibit 12 of “The Director’s Report” of September 23, 2013, and represent an aggregation of individual S&P500 component “bottom up” analyst forecasts:

Year 2013 estimate:
$110.46/share

Year 2014 estimate:
$122.92/share

Year 2015 estimate:
$135.39/share
_____

I post various economic forecasts because I believe they should be carefully monitored.  However, as those familiar with this blog are aware, I do not agree with many of the consensus estimates and much of the commentary in these forecast surveys.
_____

The Special Note summarizes my overall thoughts about our economic situation

SPX at 1704.22 as this post is written

Standard & Poor’s S&P500 Earnings Estimates For 2013 & 2014 – As Of September 19, 2013

As many are aware, Standard & Poor’s publishes earnings estimates for the S&P500.  (My posts concerning their estimates can be found under the S&P500 Earnings tag)

For reference purposes, the most current estimates are reflected below, and are as of September 19, 2013:

Year 2013 estimates add to the following:
-From a “bottom up” perspective, operating earnings of $108.08/share
-From a “top down” perspective, operating earnings of N/A
-From a “top down” perspective, “as reported” earnings of $98.28/share

Year 2014 estimates add to the following:
-From a “bottom up” perspective, operating earnings of $122.32/share
-From a “top down” perspective, operating earnings of $113.75/share
-From a “top down” perspective, “as reported” earnings of $108.29/share
_____

I post various economic forecasts because I believe they should be carefully monitored.  However, as those familiar with this blog are aware, I do not agree with many of the consensus estimates and much of the commentary in these forecast surveys.
_____

The Special Note summarizes my overall thoughts about our economic situation

SPX at 1702.47 as this post is written

Current Economic Situation

With regard to our current economic situation,  my thoughts can best be described/summarized by the posts found under the 28 “Building Financial Danger” posts.

My thoughts concerning our ongoing economic situation – with future implications – can be seen on the page titled “A Special Note On Our Economic Situation,” which has been found near the bottom of every blog post since August 15, 2010.
_____

The Special Note summarizes my overall thoughts about our economic situation

SPX at 1701.24 as this post is written

Friday, September 20, 2013

Broad-Based Indicators Of Economic Activity

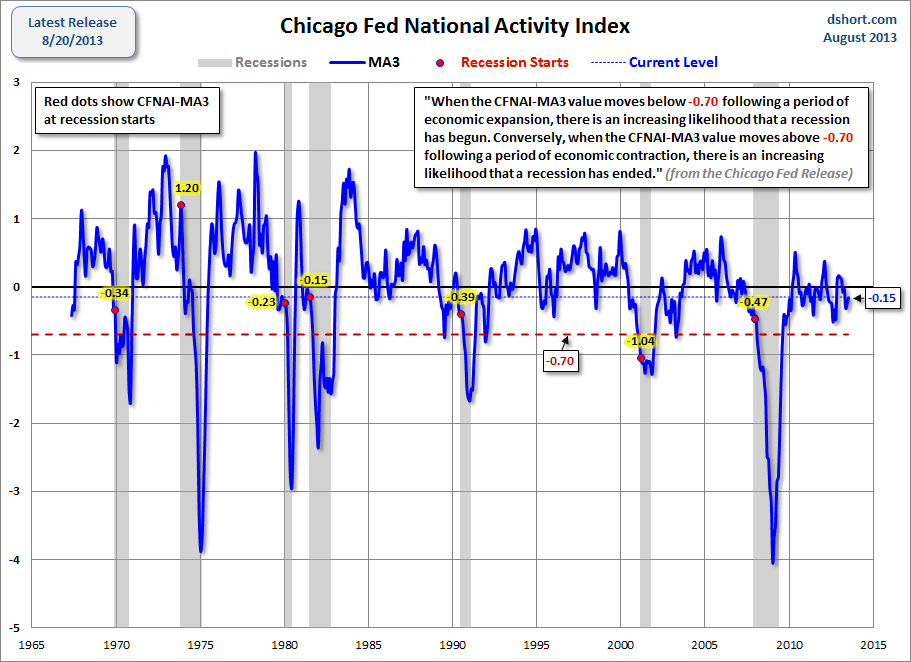
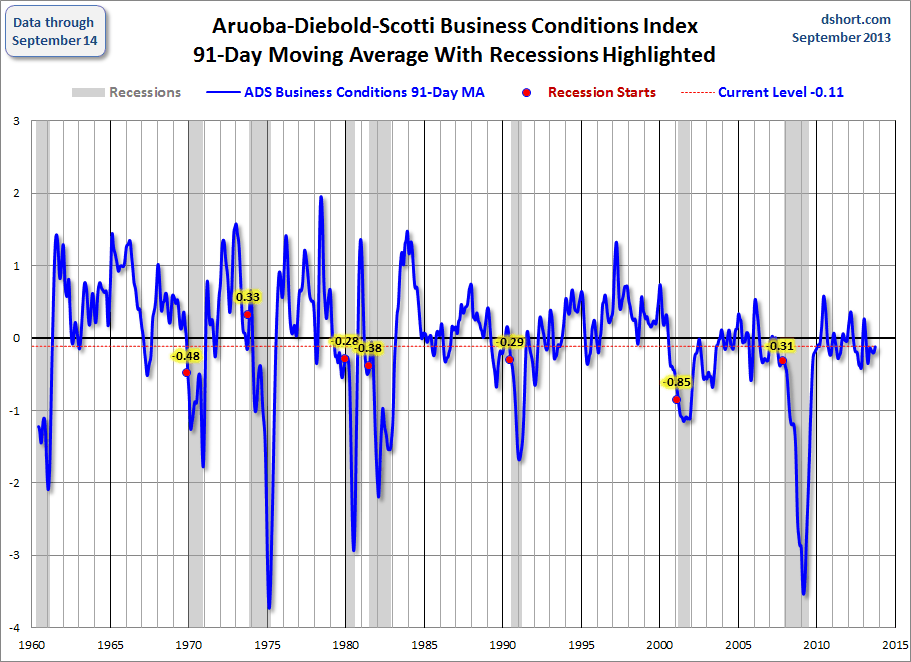
The Chicago Fed National Activity Index (CFNAI) and the Aruoba-Diebold-Scotti Business Conditions Index (ADS Index) are two broad-based economic indicators that I regularly feature in this site.

The current levels of each are notable, as they are vacillating from a short-term perspective and their long-term trends continue to sink.

Doug Short, in his blog post of September 20, titled “The Philly Fed Business Conditions Index” displays both the CFNAI MA-3 (3-month Moving Average) and ADS Index (91-Day Moving Average) from a variety of perspectives.

Of particular note, two of the charts, shown below, denote where the current levels of each reading is relative to the beginning of past recessionary periods, as depicted by the red dots.

The CFNAI MA-3:

(click on charts to enlarge images)

Dshort 9-20-13 Chicago-Fed-CFNAI-recession-indicator

-

The ADS Index, 91-Day MA:

Dshort 9-20-13 ADS-index-91-day-MA

-

Also shown in the Doug Short’s aforementioned post is a chart of each with a long-term trendline (linear regression) as well as a chart depicting GDP for comparison purposes.
_________

I post various indicators and indices because I believe they should be carefully monitored.  However, as those familiar with this blog are aware, I do not necessarily agree with what they depict or imply.
_____

The Special Note summarizes my overall thoughts about our economic situation

SPX at 1711.60 as this post is written

Ben Bernanke’s September 18, 2013 Press Conference – Notable Aspects

On Wednesday, September 18, 2013 Ben Bernanke gave his scheduled press conference.

Below are Ben Bernanke’s comments I found most notable – although I don’t necessarily agree with them – in the order they appear in the transcript.  These comments are excerpted from the "Transcript of Chairman Bernanke’s Press Conference"(preliminary)(pdf) of September 18, 2013, with the accompanying “FOMC Statement” and "Economic Projections of Federal Reserve Board Members and Federal Reserve Bank Presidents, September 2013" (pdf).

From Ben Bernanke’s opening comments:
In the Committee’s assessment, the downside risks to growth have diminished, on net, over the past year, reflecting, among other factors, somewhat better economic and financial conditions in Europe and increased confidence on the part of households and firms in the staying power of the U.S. recovery.  However, the tightening of financial conditions observed in recent months, if sustained, could slow the pace of improvement in the economy and the labor market.  In addition, federal fiscal policy continues to be an important restraint on growth and a source of downside risk.
Apart from some fluctuations due primarily to changes in oil prices, inflation has continued to run below the Committee’s 2 percent longer-term objective.  The Committee recognizes that inflation persistently below its objective could pose risks to economic performance, and we will continue to monitor inflation developments closely.  However, the unwinding of some transitory factors has led to moderately higher inflation recently, as expected; and, with longer-term inflation expectations well-anchored, the Committee anticipates that inflation will gradually move back toward 2 percent.
also:
At the meeting concluded earlier today, the sense of the Committee was that the broad contours of the medium-term economic outlook—including economic growth sufficient to support ongoing gains in the labor market, and inflation moving toward its objective—were close to the views it held in June.  But in evaluating whether a modest reduction in the pace of asset purchases would be appropriate at this meeting, however, the Committee concluded that the economic data do not yet provide sufficient confirmation of its baseline outlook to warrant such a reduction.  Moreover, the Committee has some concern that the rapid tightening of financial conditions in recent months could have the effect of slowing growth, as I noted earlier, a concern that would be exacerbated if conditions tightened further.  Finally, the extent of the effects of restrictive fiscal policies remains unclear, and upcoming fiscal debates may involve additional risks to financial markets and to the broader economy.  In light of these uncertainties, the Committee decided to await more evidence that the recovery’s progress will be sustained before adjusting the pace of asset purchases.
Bernanke’s responses as indicated to the various questions:

PEDRO DA COSTA. Thanks, Mr. Chairman. Pedro da Costa from Reuters. You cite meaningful progress on the labor market both on the unemployment front and in terms of payroll growth. But much of the decline in the unemployment rate has been due as you know to the decline in participation. So my question to you is and also on the payroll front, some people would argue that, while there has been growth, it hasn't been strong enough to keep up with population growth and make up the gap that we have from the recession. So, how high do you think the jobless rate would be if it were not for the decline in participation? I've heard estimates as high as 10 to 11 percent. And could you put the labor market in that context?

CHAIRMAN BERNANKE. Certainly. So, I think there is a cyclical component to participation and in that respect, the unemployment rate understates the amount of sort of true unemployment if you will in the economy. But on the other hand, there is also a downward trend in participation in our economy which is arising from factors that have been going on for some time including an aging population, lower participation by prime-age males, fewer women in the labor force, other factors which aren't really related to this recession.

Over the last year, the unemployment rate has dropped by eight-tenths of a percentage point. The participation rate is dropped by three-tenths of a percentage point, which is pretty close to the trend. So in other words, I think it would be fair to say that most of the improvement in the unemployment rate, not all, but most of it in the last year is due to job creation rather than lower participation. I would also note that if you look at the broader measures of unemployment that the BLS publishes including part-time work, including discouraged workers and so on, you'll see that those rates have fallen about the same amount as the overall standard civilian unemployment rate. So, I think that there has been progress and it's obscure to some extent by the downward trend in participation. But I also would agree with you that the unemployment rate is, while perhaps the best single indicator of the state of labor market is not by itself a fully representative indicator.

also:

JON HILSENRATH. Jon Hilsenrath from the Wall Street Journal. Just to follow up on Binya's question, Mr. Chairman, you said that you could pullback the purchases possibly later this year. You sound a little bit less certain that it's going to happen later this year. So I'd like you--to ask you to talk a little bit more about your conviction about whether these are like--the pullback is likely to start this year, where you stand on that. And I also don't think I heard you mentioned that 7 percent unemployment number that you've talked--you talked about back in June. That was the rate that was--the unemployment rate that was supposed to prevail when the Fed was done doing this, is that no longer operative?

CHAIRMAN BERNANKE. So, there is no fixed calendar—a schedule, I really have to emphasize that. If the data confirm our basic outlook, if we gain more confidence in that outlook, and we believe that the three-part test that I mentioned is indeed coming to pass, then we could move later this year. We could begin later this year. But even if we do that, the subsequent steps will be dependent on continued progress in the economy. So we are tied to the data, we don't have a fixed calendar schedule, but we do have the same basic framework that I described in June.

The criterion for ending the asset purchases program is a substantial improvement in the outlook for the labor market. Last time, I gave a 7 percent as an indicative number to give you some sense of, you know, where that might be. But as my first answer suggested, the unemployment rate is not necessarily a great measure in all circumstances of the--of the state of the labor market overall. For example, just last month, the decline in unemployment rate came about more than entirely because declining participation, not because of increased jobs. So, what we will be looking at is the overall labor market situation, including the unemployment rate, but including other factors as well. But in particular, there is not any magic number that we are shooting for. We're looking for overall improvement in the labor market.

also:

ANNALYN KURTZ. Annalyn Kurtz with CNNMoney. This week marks five years since the financial crisis began, and Hank Paulson, who you worked very closely with, has said his biggest regret was that he wasn't able to convince the American people that what was done-- the bank bailouts--weren't from Wall Street, they were from Main Street. What is your biggest regret as you reflect on the five-year anniversary? And do you believe that the Fed, Congress, and the President have put the necessary measures in place to prevent another deep financial crisis?

CHAIRMAN BERNANKE. Well, on regrets, as Frank Sinatra says, I have many. I think my--you know, reasonably, the biggest regret I have is that we didn't forestall the crisis. I think once the crisis got going, it was extremely hard to prevent. You know, I think we did what we could, given the powers that we had, and I would agree with Hank that we were motivated entirely by the interest of the broader public, that our goal was to stabilize the financial system so that it would not bring the economy down, so that it would not create massive unemployment and economic hardship that was even more--that would be--would have been even more severe by many times than what we actually saw. So, I agree with him on that, and I guess, since you gave me the opportunity, I would mention that, of course, all the money that was used in those operations has been paid back with interest. And so, it hasn't been costly even from a fiscal point of view. Now, in terms of progress, that's a good question. I think we made a lot of progress. We had, of course, the Dodd-Frank law passed in 2010, and then we recently, you know, have come to agreement internationally on a number of measures, including Basel III and other agreements relating to the shadow banking system and other aspects of the financial system. I think that our-today, our large financial firms, for example, are better capitalized by far than they were certainly during the crisis and even before the crisis. Supervision is tougher. We do stress testing to make sure that firms can withstand not only normal shocks but very, very large shocks, similar to those they experienced in 2008. And very importantly, of course, we now have a tool that we didn't have in 2008--which would have made, I think, a significant difference if we had had it-which is the Orderly Liquidation Authority that the Dodd-Frank bill gave to the FDIC in collaboration with the Fed. Under the Orderly Liquidation Authority, the FDIC, with other agencies, has the ability to wind down a failing financial firm in a way that minimizes the direct impact on the financial markets and on the economy. Now, I should say, I don't want to overstate the case, I think there's a lot more work to be done. In the case of resolution regimes, for example, the United States has set the course internationally. Other countries and international bodies like the FSB are setting up standards for resolution regimes, which are very similar to those of the United States, which is going to make for better cooperation across borders. But we're still some distance from being fully geared up to work with foreign counterparts to successfully wind down international--multinational financial firm. And that's--we've made progress in that direction, but we need to do more, I think. So, I think there's more to be done. There's more to be done on derivatives, although a lot has been done to make them more transparent and to make the trading of derivative safer. But it's going to be probably some time before, you know, all of this stuff that has been undertaken, all of these measures are fully implemented. And we can assess, you know, the ultimate impact on the financial system.

also:

STEVE BECKNER. Steve Beckner of MNI. Mr. Chairman, a number of economists, and indeed, some of your Fed colleagues, have argued that the effectiveness of quantitative easing has greatly diminished, if not disappeared, and they point to the recent performance of the economy as proof of that. And there have been a number of people who have argued that there are regulatory and other impediments to growth beyond the reach of monetary policy. To what extent are these valid arguments? And if the economy does not speed up, that does not reach your objectives, how will you ever get out of quantitative easing?

CHAIRMAN BERNANKE. Well, on the effectiveness of our asset purchases, it's difficult to get a precise measure. There's a large academic literature on this subject, and they have a range of results, some suggesting that this is a quite powerful tool, some that it’s less powerful. My own assessment is that it has been effective. If you look at the recovery, you see that some of the strongest sectors, the leading sectors like housing and autos, have an interest sensitive sectors. And that these policies have been successful in strengthening financial conditions, lowering interest rates, and thereby promoting recovery. So I do think that they have been effective. You mentioned that there hasn't been any progress. There has been a lot of progress, as I said at the beginning. Labor market indicators, while still not where we'd like them to be, are much better today than they were when we began this latest program a year ago. And importantly, as actually is referenced in our FOMC statement, that happened notwithstanding a set of fiscal policies which the CBO said would cost between one and one and a half percentage points of real growth and hundreds of thousands of jobs. So, the fact that we have maintained improvements in the labor market that are as good or better than the previous year, notwithstanding this fiscal drag, is some indication that there is at least a partial offset from monetary policy. Now, just as you say, there are a lot of things in the economy that monetary policy can’t address. They include the effectiveness of regulation, they include fiscal policy, they include developments in the private sector. We do what we can do and what--if we can get help, we're delighted to have help from other policymakers and from the private sector and we hope that that will happen. The criterion for ending asset purchases is not, you know, some very high rate of growth. What it is, is the criterion--let me just remind you, the criterion is a substantial improvement in the outlook for the labor market and we have made significant improvement. Ultimately, we will reach that level of substantial improvement and at that point, we will be able to wind down the asset purchases. Again, you know, and I think people don't fully appreciate that we have two tools: We have asset purchases and we have rate policy and guidance about rates.

It's our view that the latter, the rate policy, is actually the stronger, more reliable tool. And when we get to the point where we can, you know, where we are close enough to full employment, that rate policy will be sufficient, I think that we will still be able to provide--even if asset purchases have reduced--we will still be able to provide a highly accommodative monetary background that will allow the economy to continue to grow and move towards full employment.

also:

PETER COOK. Peter Cook at Bloomberg Television. Mr. Chairman, one of my colleagues was remarking as we came in here, we don't often get surprises from the Federal Reserve. This was a surprise, you talked about--you hadn't telegraphed anything specifically, but you've seen the market reaction, I'm sure. My question for you is, were you intending a surprise today, and did you get the intended result judging from the market reaction? And related to that, by taking this action today, continuing the bond purchases going forward. At what point do you believe you're starting to complicate the exit strategy? Simply by continuing to keep the Fed's foot on the gas pedal, do you make life more complicated for the Federal Reserve down the road?

CHAIRMAN BERNANKE. Well, it's our intention to try to set policy as appropriate for the economy, as I said earlier. We are somewhat concerned. I won’t overstate it, but we do want to see the effects of higher interest rates on the economy, particularly in mortgage rates on housing. So to the extent that our policy makes conditions--our policy decision today makes conditions just a little bit easier, that's desirable. We want to make sure that the economy has adequate support and in particular, is less surprising the market or easing policy as it is avoiding a tightening until we can be comfortable that the economy is in fact growing, you know, the way we want it to be growing. So, this was a step--it was a step, a precautionary step if you will. It was a--the intention is to wait a bit longer and to try to get confirming evidence whether to these-to whether or not the economy is, in fact, conforming to this general outlook that we have. I don't think that we are complicating anything for future FOMCs. It's true that the assets that we've been buying add to the size of our balance sheet. But we have developed a variety of tools, and we think we have numerous tools that we--can be used to both manage interest rates and to ultimately unwind the balance sheet when the time comes. So I, you know, I'm--I feel quite comfortable that we can, in particular, that we can raise interest rates at the appropriate time, even if the balance sheet remains large for an extended period. And that will be true of course for, you know, future FOMCs as well.

also:

DON LEE. Don Lee, L.A. Times. As you may know, the Census Bureau reported yesterday that poverty rate and the median household income saw no improvement last year. And I wonder when you see median income is turning up significantly for most people, and in light of the fact that people in the middle and the bottom have seen very little of the gains relative to higher income households, how would you assess the--both quantitative easing and Fed policies?

CHAIRMAN BERNANKE. Sure. So that's certainly the case that there are too many people in poverty. There are a lot of complex issues involved. There are complex measurement issues, I would just have to mention that. There are a lot of issues that are really long-term issues as well. For example, it might seem a puzzle that U.S. economy gets richer and richer, and yet there are more poor people. And the explanation, of course, is that our economy is becoming more unequal. The more, very rich people and more people in the lower half who are not doing well, these are--there's a lot of reasons behind this trend, which have been going on for decades, and economists disagree about the relative importance of things like technology and international trade and unionization and other factors that have contributed to that. But I guess my first point is that these long run trends, it's important to address these trends but the Federal Reserve doesn't really have the tools to address these long run distributional trends. They can only be addressed really by Congress and by the Administration. And it's up to them, I think, to take those steps. The Federal Reserve is--we are doing our part to help the median family, the median American, because one of our principal goals, are--we have two principal goals, one is maximum employment, jobs; the best way to help families is to create employment opportunities. We're still not satisfied, obviously, with where the labor market, the job market is. We'll continue to try to provide support for that. And then the other goal is price stability, low inflation, which, of course, also helps make the economy work better for people in the middle and the lower parts of the distribution. So, we use the tools that we have. It would be better to have a mix of tools at work, not just monetary policy but fiscal policy and other policies as well. But the Federal Reserve, we can, you know, we only have a certain set of tools and those are the ones that we use. Again, our objective, our objectives of creating jobs and maintaining price stability, I think, are quite consistent with helping the average American, but there's limits to what we can do about long run trends and I think those are very important issues that Congress and the Administration, you know, need to look at and decide, you know, what needs to be done there.
_____

The Special Note summarizes my overall thoughts about our economic situation

SPX at 1714.23 as this post is written