On Wednesday, January 27, 2021 FOMC Chairman Jerome Powell gave his scheduled January 2021 FOMC Press Conference. (link of video and related materials)
Below are Jerome Powell’s comments I found most notable – although I don’t necessarily agree with them – in the order they appear in the transcript. These comments are excerpted from the “Transcript of Chairman Powell’s Press Conference“ (preliminary)(pdf) of January 27, 2021, with the accompanying “FOMC Statement.”
Excerpts from Chairman Powell’s opening comments:
CHAIR POWELL. Good afternoon. At the Federal Reserve, we are strongly committed to achieving the monetary policy goals that Congress has given us—maximum employment and price stability. Since the beginning of the pandemic, we have taken forceful actions to provide relief and stability, to ensure that the recovery will be as strong as possible, and to limit lasting damage to the economy. Today my colleagues on the FOMC and I kept interest rates near zero and maintained our sizable asset purchases. These measures, along with our strong guidance on interest rates and our balance sheet, will ensure that monetary policy will continue to deliver powerful support to the economy until the recovery is complete.
The path of the economy continues to depend significantly on the course of the virus. A resurgence in recent months in COVID-19 cases, hospitalizations, and deaths is causing great hardship for millions of Americans, and is weighing on economic activity and job creation. Following a sharp rebound in economic activity last summer, the pace of the recovery has moderated in recent months, with the weakness concentrated in the sectors of the economy most adversely affected by the resurgence of the virus and by greater social distancing. Household spending on services remains low, especially in sectors that typically require people to gather closely, including travel and hospitality. And household spending on goods has moderated following earlier large gains.
also:
The Fed’s response to this crisis has been guided by our mandate to promote maximum employment and stable prices for the American people, along with our responsibilities to promote the stability of the financial system. Today we unanimously reaffirmed our Statement on Longer-Run Goals and Monetary Policy Strategy, as we typically do each January. As we say in that statement, we view maximum employment as a “broad-based and inclusive goal.” Our ability to achieve maximum employment in the years ahead depends importantly on having longer-term inflation expectations well anchored at 2 percent. As the Committee reiterated in today’s policy statement, with inflation running persistently below 2 percent, we will aim to achieve inflation moderately above 2 percent for some time so that inflation averages 2 percent over time and longer-term inflation expectations remain well anchored at 2 percent. We expect to maintain an accommodative stance of monetary policy until these employment and inflation outcomes are achieved. With regard to interest rates, we continue to expect it will be appropriate to maintain the current 0 to ¼ percent target range for the federal funds rate until labor market conditions have reached levels consistent with the Committee’s assessment of maximum employment and inflation has risen to 2 percent and is on track to moderately exceed 2 percent for some time.
In addition, we will continue to increase our holdings of Treasury securities by at least $80 billion per month and of agency mortgage-backed securities by at least $40 billion per month until substantial further progress has been made toward our maximum-employment and price-stability goals. The increase in our balance sheet since last March has materially eased financial conditions and is providing substantial support to the economy. The economy is a long way from our employment and inflation goals, and it is likely to take some time for substantial further progress to be achieved.
Excerpts of Jerome Powell’s responses as indicated to various questions:
JAMES POLITI. Thank you so much, Michelle and Chair Powell. I had a question on fiscal policy. Last year, you consistently said that the economy needed more fiscal support. And I believe were pleased when the $900 billion package was approved in December. We now have new President and Congress. We have a weakening short-term outlook. Do you believe the economy still needs additional support on the fiscal side? And in what areas?
CHAIR POWELL. Thank you. So I guess I’d start by saying that the fiscal response that we’ve seen to this downturn has been strong. And I think we can say now that it’s been sustained, after the passage of the most recent act in late December. And that’s really a key reason why the recovery has been as strong as it’s been. Fiscal policy has been absolutely essential. When we look back on the history of this period, we’ll see a strong and sustained fiscal policy response. I would add that we’re, as I mentioned, a long way from a full recovery. Something like 9 million people remain unemployed as a consequence of the pandemic. That’s as many people as lost their jobs at the peak of the global financial crisis in the Great Recession. Many small businesses are under pressure, and there are other needs to be addressed, and the path ahead is still pretty uncertain. So all of that said, the judgment on how much to spend, and in what way is really one for Congress and the administration and not for the fed. And these discussions are going on right now. So there’s a discussion, as you know, right now around those precise questions, and that’s appropriate, but not for us to play a role in talking about specific policies.
MICHELLE SMITH. Thank you, Steve Liesman.
STEVE LIESMAN. Thank you, Mr. Chairman. I wonder if I could follow up on Gina’s question here. I understand that you do address issues of valuations through macroprudential policies in the first instance. But there’s a range of assets, and I know you do watch a range of assets. But from Bitcoin to corporate bonds to the stock market in general, to some of these more specific meteoric rises in stocks like GameStop. How do you address the concern that super easy monetary policy, asset purchases and zero interest rates are potentially fueling a bubble that could cause economic fallout should it burst?
CHAIR POWELL. Let me provide a little context. The shock from the pandemic was unprecedented both in its nature and in its size, and in the amount of unemployment that it created in the shock to economic activity. There’s nothing close to it in our modern economic history. So our response was really to that, and we’ve done what we could first to restore market function and to provide a bit of relief, then to support the recovery. And hopefully, we’ll be able to do the third thing, which is to avoid longer-run damage to the to the economy. Our role assigned by Congress is maximum employment and stable prices, and also look after financial stability. So in a world where almost a year later, we’re still 9 million jobs, at least — that’s one way of counting. It can actually be counted much higher than that — short of maximum employment, and people are out of the labor force who were in the labor force. The real unemployment rate is close to 10 percent if you include people that have left the labor force. It’s very much appropriate that monetary policy be highly accommodative to support maximum employment and price stability, which is getting inflation back to 2 percent and averaging 2 percent over time. So on matters of financial stability, we have a framework. We don’t look at one thing or two things. And we made that framework public after the financial crisis so that it can be criticized and understood and we could be held accountable. And you know, the things that we look at are — we do look at asset prices, we also look at leverage in the banking system. We look at leverage in the nonbanking system, which is to say corporates and households. And we look at also funding risk. And if you look at it across that range of readings, they’re each different, but we monitor them carefully. And I would say that financial stability vulnerabilities overall are moderate. Our overall goal is to assure that the financial system itself is resilient to shocks of all kinds, that it’s strong and resilient. And that includes not just the banks, but money market funds, and all different kinds of nonbank financial structures as well. So when we get to the nonfinancial sector, we don’t have jurisdiction over that. So I would just say that there are many things that go in, as you know, to sitting asset prices. So if you look at what’s really been driving asset prices really in the last couple of months, it isn’t monetary policy. It’s been expectations about vaccines. And it’s also financial — sorry, fiscal policy, those are those are the news items that have been driving asset purchases, sorry, asset values in recent months. So I know that monetary policy does play a role there. But that’s how we look at it. And I think, you know, I think that the connection between low interest rates and asset values is probably something that’s not as tight as people think, because a lot of different factors are driving asset prices at any given time.
STEVE LIESMAN. A follow up, Michelle, if you don’t mind. Mr. Chairman, do you rule out or see as one of your tools in the toolkit the idea of adjusting monetary policy to address asset values?
CHAIR POWELL. So, you know, that’s — as you know, that’s one of the very difficult questions in all of monetary policy. And we don’t rule it out as a theoretical matter. But we clearly look to macroprudential tools, regulatory tools, supervisory tools, other kinds of tools, rather than monetary policy in addressing financial stability issues. It’s not — you know, the monetary policy we know strengthens economic activity and job creation through fairly well understood channels. And a strong economy is actually a great supporter of financial stability. That will mean strong, you know, well capitalized institutions and households will be will be working. And so we know that. We don’t actually understand the trade-off between — the sense of it is, if you raise interest rates and thereby tighten financial conditions and reduce economic activity. Now, in order to address asset bubbles and things like that, will that even help? Will it actually cause more damage? Or will it help? So I think that’s unresolved. And I think it’s something we look at as not theoretically ruled out, but not something we’ve ever done. And not something we would plan to do. We would rely on macroprudential and other tools to deal with financial stability issues.
also:
MICHAEL MCKEE. I have a question that I was going to ask. But I need to follow up for a second on the questions about the markets and macroprudential. And that is, you have one tool you can use — would you be discussing, have you discussed raising margin requirements under regulation T? And if not, why not?
CHAIR POWELL. No, we haven’t done that. I mean, remember, we’re focused on maximum employment, price stability, financial stability, as I defined it, the broad financial sector. And, that’s, you know, over the years, we consult the fact that we have that authority. But no, it’s not something we’re looking at right now at all.
MICHAEL MCKEE. My follow up question is, a lot of people in the markets think that you’re basically stuck right now, because you can’t really go lower with the zero bound, rejecting negative interest rates. And you can’t really go higher because of the threat of a taper tantrum. Is the Fed locked into a very narrow corridor now? And if not, you did say you would signal any change in interest rates a long time ahead. But the New York Fed President Bill Dudley says there’s no way you can avoid a taper tantrum. So how do you do that?
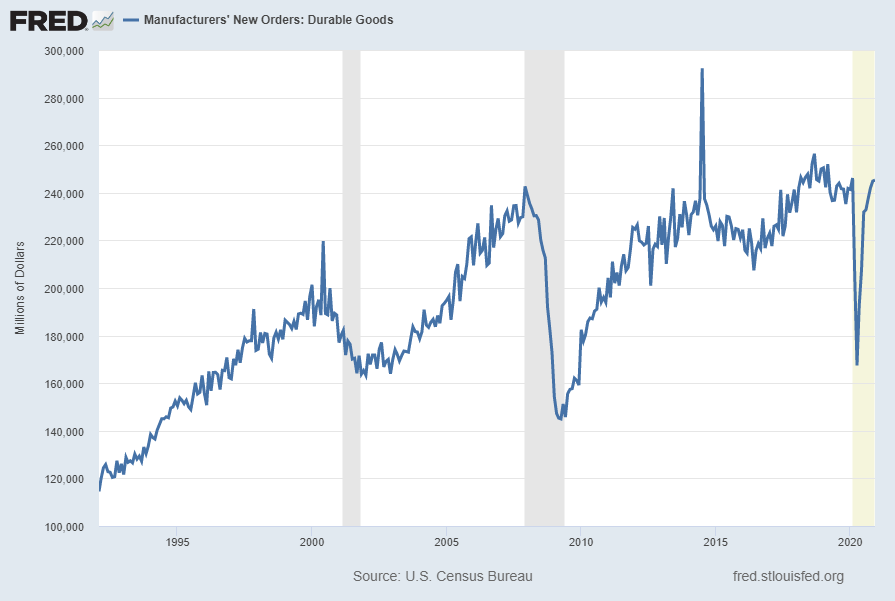
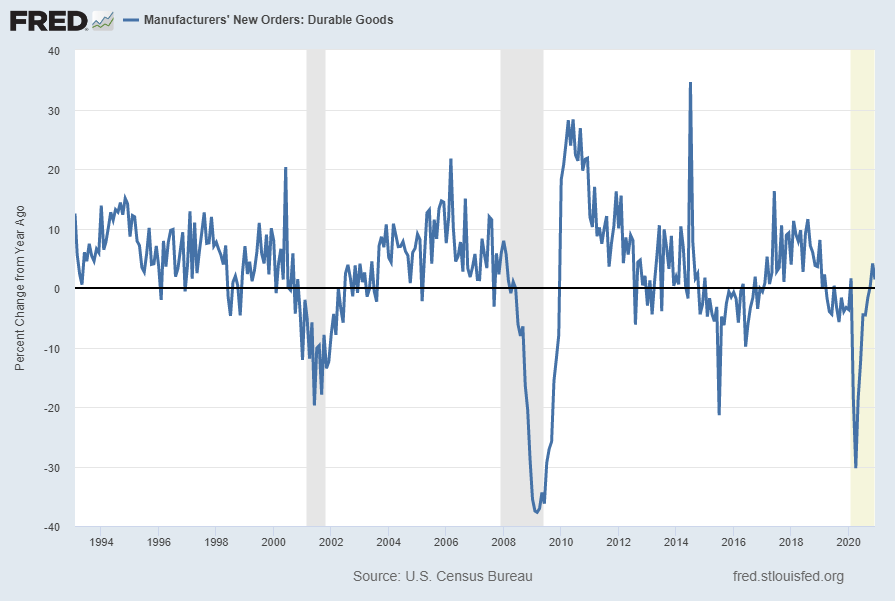
CHAIR POWELL. Well, first, we think our policy stance is just right. We think it’s providing significant support for economic activity and hiring. We, you know, we adopted a new monetary policy framework of flexible average inflation targeting in August. In September, we implemented rate guidance that was consistent with and based on that new framework. In December, we did the same for asset purchases. So we now have, you know, strong guidance on rates and on asset purchases, that’s providing very strong support for economic activity. If you look at the sectors of the economy that are interest sensitive, you will see very strong activity — housing, durable goods, automobile sales. So, you know, our policies are working. And we think that they are — we think our policy stance is right. That said, there’s clearly more that we can do. With asset purchases, for example, we could, you know, that’s a tool we can do more. We can strengthen our guidance too, if we were to think that were appropriate. What you see is an economy where what’s holding us back is not the lack of policy support from the Fed. It’s the pandemic, it’s the spread of the disease, and people’s reluctance or inability to partake in certain kinds of economic activities, which amount to a meaningful part of the economy. So that’s, what I would say. We certainly have things that we can do, but we think we’re in the right place. You know, in terms of tapering, it’s just premature. We just created the guidance. We said we’d want to see substantial further progress toward our goals before we modify our asset purchase guidance. It’s just too early to be talking about dates, which we should be focused on progress. We’ll need to see actual progress. And when we see ourselves getting to that point, we’ll communicate clearly about it to the public. So nobody will be surprised when the time comes. And we’ll do that well in advance of actually considering what will be a pretty gradual taper.
MICHAEL MCKEE. Well, if I might, your policies are working, and you can maybe do more. But the question is, can you stop doing it when it’s time?
CHAIR POWELL. Yeah, so you know, I was here — we had all the same questions back after the global financial crisis. We raised interest rates, we froze the balance sheet size, and then we shrank the balance sheet size. So there’s no reason why we won’t be able to do that again. In fact, we learned a lot from that experience. And, you know, we understand as we understood then, but even more so we understand that the that the way to do it is to communicate well in advance, to do predictable things, and to move gradually. And that’s what we’re going to do. We’re going to be very transparent. But honestly, you know, the whole focus on exit is premature if I may say. We’re focused on finishing the job we’re doing, which is to support the economy, to give the economy the support it needs. There are people out there who’ve lost their jobs. It’s essential that we get them back to work as quickly as possible, and we want to do everything we can to do that. And that is our primary focus right now. It’s too soon to be to be worried about that. You know, when we come to exit, we have an understanding of how to do that. And we’ll do it very carefully. But in the meantime, our focus is on giving the economy the support it needs.
also:
EDWARD LAWERENCE. Mr. Chairman, thank you for taking the question. I’m interested in the housing sector. Home prices are rising at 9 percent in some areas because of low interest rates. Are you concerned about a bubble forming there yet? And is there a price increase, you know, that you’re looking at where it might change the level of mortgage backed securities the Fed is buying? And as a continuation of that, is the bubble in the corporate debt cycle more concerning for you?
CHAIR POWELL. So on housing, you know, housing is now — the level of housing activity is at its highest level since before the global financial crisis in some measure. So we’ve had a very strong rebound in housing. Some of the tightness in housing markets — which has led to the significant price increases this year — we think is a passing phenomenon. There was a lot of pent up demand. There was a one-time thing happening with people who are spending all of their time in their house, and they’re thinking, either I need a bigger house, or I need another house and a different house, or a second house in some cases. So there’s a one-time shift in demand that we think will get satisfied, also that will call for supply. And we think we think that those price increases are unlikely to be sustained for all of those reasons.
So you asked about corporate debt, I guess.
EDWARD LAWRENCE. Yeah, I’m just concerned if that’s a bubble that you’re watching.
CHAIR POWELL. So we monitor pretty much all of the big financial markets pretty carefully. And you know, what’s happened in the corporate debt market beginning with the announcement of our corporate credit facility has been — you’ve seen lenders lending and borrowers borrowing. You’ve seen relatively, significantly fewer defaults than we expected. There were a lot of downgrades and some defaults at the beginning. And those have really slowed down. And by the way, the same is true for bank loans. Banks are not experiencing the kinds of defaults that we all were concerned about in the early months of the pandemic. It’s just not materializing. So they’re having to reverse some of their loss reserves, actually. Corporate debt spreads are tight. They’ve tightened. They were very wide, of course, during the acute phase of the pandemic. And you know, they’re now at the lower end of their typical range. And we do monitor that. You know, it’s not something we can control or operate on directly, but we do watch those things. And, you know, in a sense, it’s good that companies have been able to finance themselves during this period, because they’ve been able to stay in business, they’ve been able to keep their employees working. And you know, that’s a good thing. And that’s part of highly accommodative financial conditions.
_____
_____
The Special Note summarizes my overall thoughts about our economic situation
SPX at 3824.39 as this post is written

