On Wednesday, June 18, 2014 Janet Yellen gave her scheduled
press conference. (video and related materials)
From Janet Yellen’s opening comments:
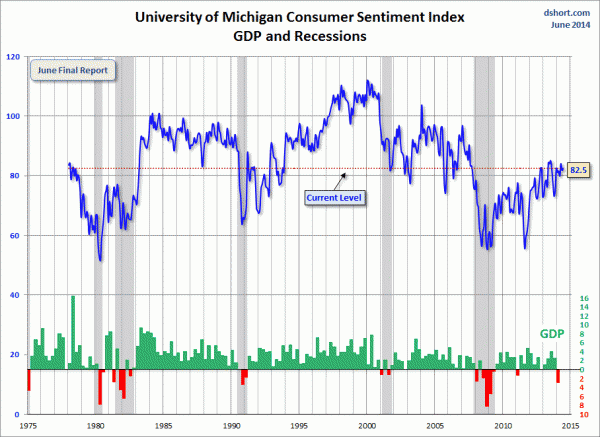
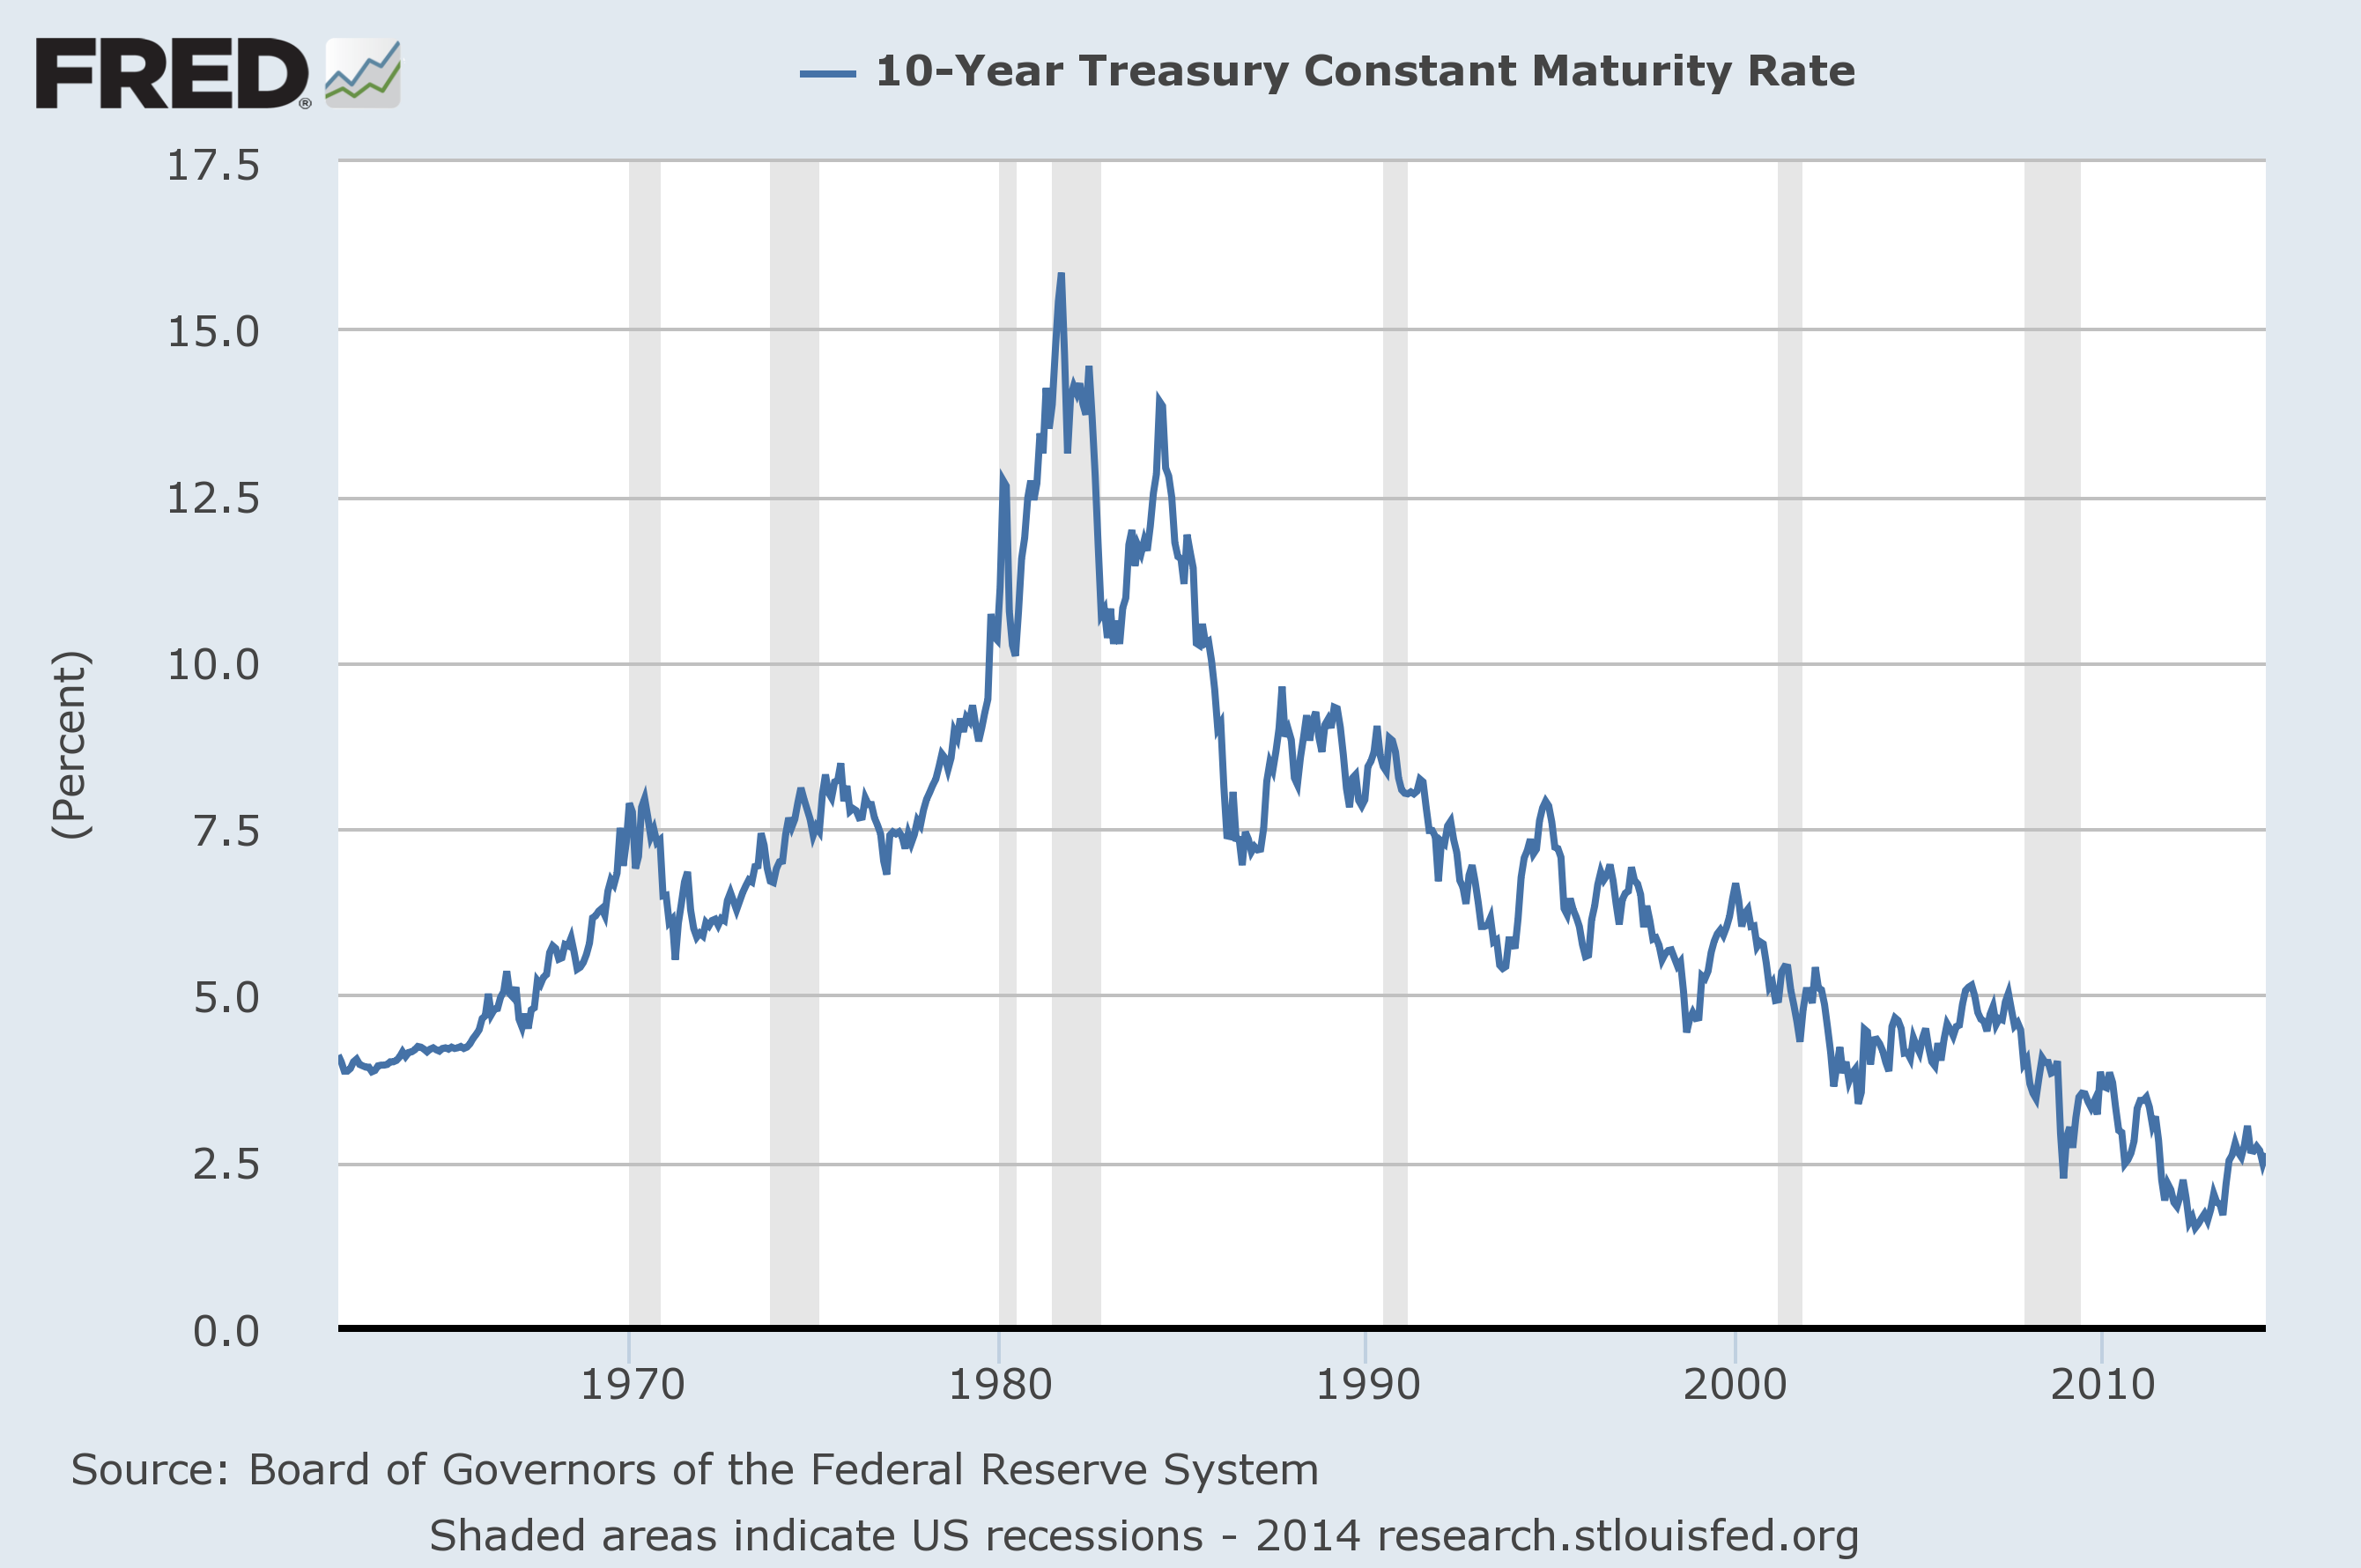
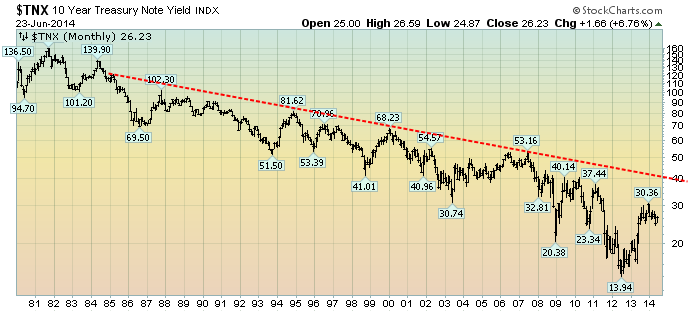
Today’s policy actions reflect the Committee’s assessment that the economy is continuing to make progress toward our objectives of maximum employment and price stability. In the labor market, conditions have improved further. The unemployment rate, at 6.3 percent, is four-tenths lower than at the time of our March meeting, and the broader U-6 measure—which includes marginally attached workers and those working part time but preferring full-time work—has fallen by a similar amount. Even given these declines, however, unemployment remains elevated, and a broader assessment of indicators suggests that underutilization in the labor market remains significant.
Although real GDP declined in the first quarter, this decline appears to have resulted mainly from transitory factors. Private domestic final demand—that is, spending by domestic households and businesses—continued to expand in the first quarter, and the limited set of indicators of spending and production in the second quarter have picked up. The Committee thus believes that economic activity is rebounding in the current quarter and will continue to expand at a moderate pace thereafter. Overall, the Committee continues to see sufficient underlying strength in the economy to support ongoing improvement in the labor market.
Janet Yellen’s responses as indicated to the various questions:
YLAN MUI. Hi. Ylan from the Washington Post. My question is sort of the flip side of Steve's and it's about your outlook for unemployment. Your predecessor has said that the Fed has been consistently too pessimistic about the level of the unemployment rate, and today, you guys lowered your outlook again. Can you tell me a little bit about how you see the unemployment rate evolving to meet your forecast? Why you believe the rate of decline will start to level off?
And what an unexpected drop might mean for the first-rate hike.
CHAIR YELLEN. So, it's true that unemployment has declined by more than the committee expected and you do see a small downward revision in the committee's projections, at least the central tendency for the unemployment rate. Now, first of all, I mean, the labor market I think has continued to broadly improve. We have seen continued job growth at a pace that is certainly sufficient to be diminishing labor market slack over time. Over the last three months for example, payroll employment has been rising around 230,000 jobs per month and we're running close to 200,000 over the last year. So, it's no way surprising to see it decline in the unemployment rate. That said, many of my colleagues and I would see a portion of the decline in the unemployment rate as perhaps not representing a diminution of slack in the labor market. We have seen labor force participation rate decline. And while I think most of us would agree that there has been and will continue to be secular decline in the labor force participation rate for demographic reasons, I think a portion of the decline we've seen in the unemployment rate probably reflects a kind of shadow unemployment or discouragement, a cyclical part of labor force participation. Now, if that's correct, we may see that as the economy picks up steam and we see further recovery in the labor market, that those, let's call them discouraged workers, will return either to unemployment or to employment. And as labor force participation begins to stabilize, the unemployment rate will come down less quickly. And I think for a number of people, that's a component of the forecast. You asked about implications, for the path of policy and I would just say, the guidance that we've given, our forward guidance states that the timing of liftoff will depend on actual progress we see and the progress we expect to see going forward in terms of achieving both of our goals, namely maximum employment and our 2 percent inflation objective. So, we're not going to look at any single indicator like the unemployment rate to assess how we're doing on meeting our employment goal, we will look at broad range of indicators. That said, as I try to emphasize in my opening statement, there is uncertainty about monetary policy. The appropriate path of policy, the timing in pace of, interest rate increases, ought to and I believe will respond to unfolding economic developments. If those were to prove faster than the committee expects, it would be logical to expect a more rapid increase in the fed funds rate. But the opposite also holds true. If we don't see the improvement that's projected in the baseline outlook, that the opposite would be true and the pace of the timing pace of interest rate increases would be later and more gradual.
also:
JASON LANGE. Good afternoon, Jason Lange with Reuters. Chair Yellen, the Fed has slashed its growth projections for this year and you've gone to pains to explain that there is uncertainty in the path of interest rates in the economy and yet, the Fed central tendency projections for 2015 and 2016 remain quite strong. Are you confident that the U.S. economy has entered a period of sustained above trend economic growth? Thank you.
CHAIR YELLEN. Well, when you say confident, I suppose the answer is no because there is uncertainty, but I think there are many good reasons why we should see a period of sustained growth in excess of the economy's potential. We have a highly accommodative monetary policy. We have diminishing fiscal drag. We have easing credit conditions. We have households who are becoming more comfortable with their debt levels and more able to service that debt, an improving job market. We have rising home prices and rising equity prices and an improving global economy at least in my estimation. So, I think all of those things ought to be working to produce above trend growth and I think that's what's reflected in the forecast. But nevertheless as I said, of course there is uncertainty around that projection. You know, nevertheless, the labor market has continued to improve, and over a number of years in which admittedly growth has come in at a disappointing level, we've still seen the labor market broadly improve and I expect that to continue.
also:
PEDRO DA COSTA. Hi, I'm Pedro da Costa from Dow Jones Newswires. Thank you very much. Since we are currently having a World Cup, I thought it would be valid to ask a question about the world. And I'm surprised--a little surprised at the optimism of your forecast given some, you know, the darkening outlook overseas. You've got conflict in the Ukraine, escalation of war in Iraq with implications for oil prices that potentially have global economic impact. You have--excuse me--a European recovery that's still fairly weak, and emerging markets that are slowing down sharply. Do you think the U.S. can be a lone engine of economic recovery globally? And if I could just follow up very quickly on Greg's question, because you talked about the two sides of the mandate, but you didn't quite answer the financial stability part. Do you think--is financial stability currently preventing the Fed from being more accommodative than it would like? And if not, when do you expect that to happen if at all? Thank you.
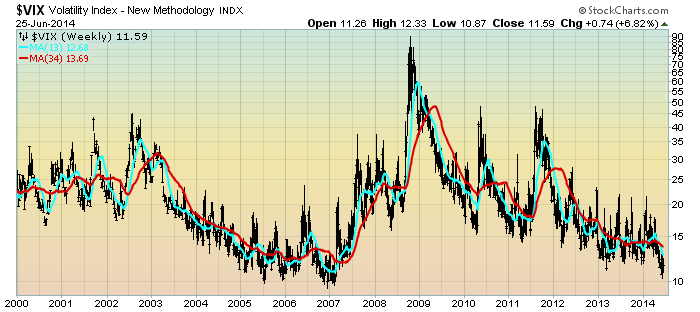
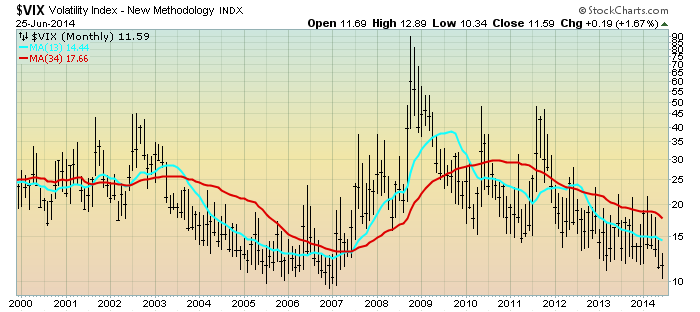
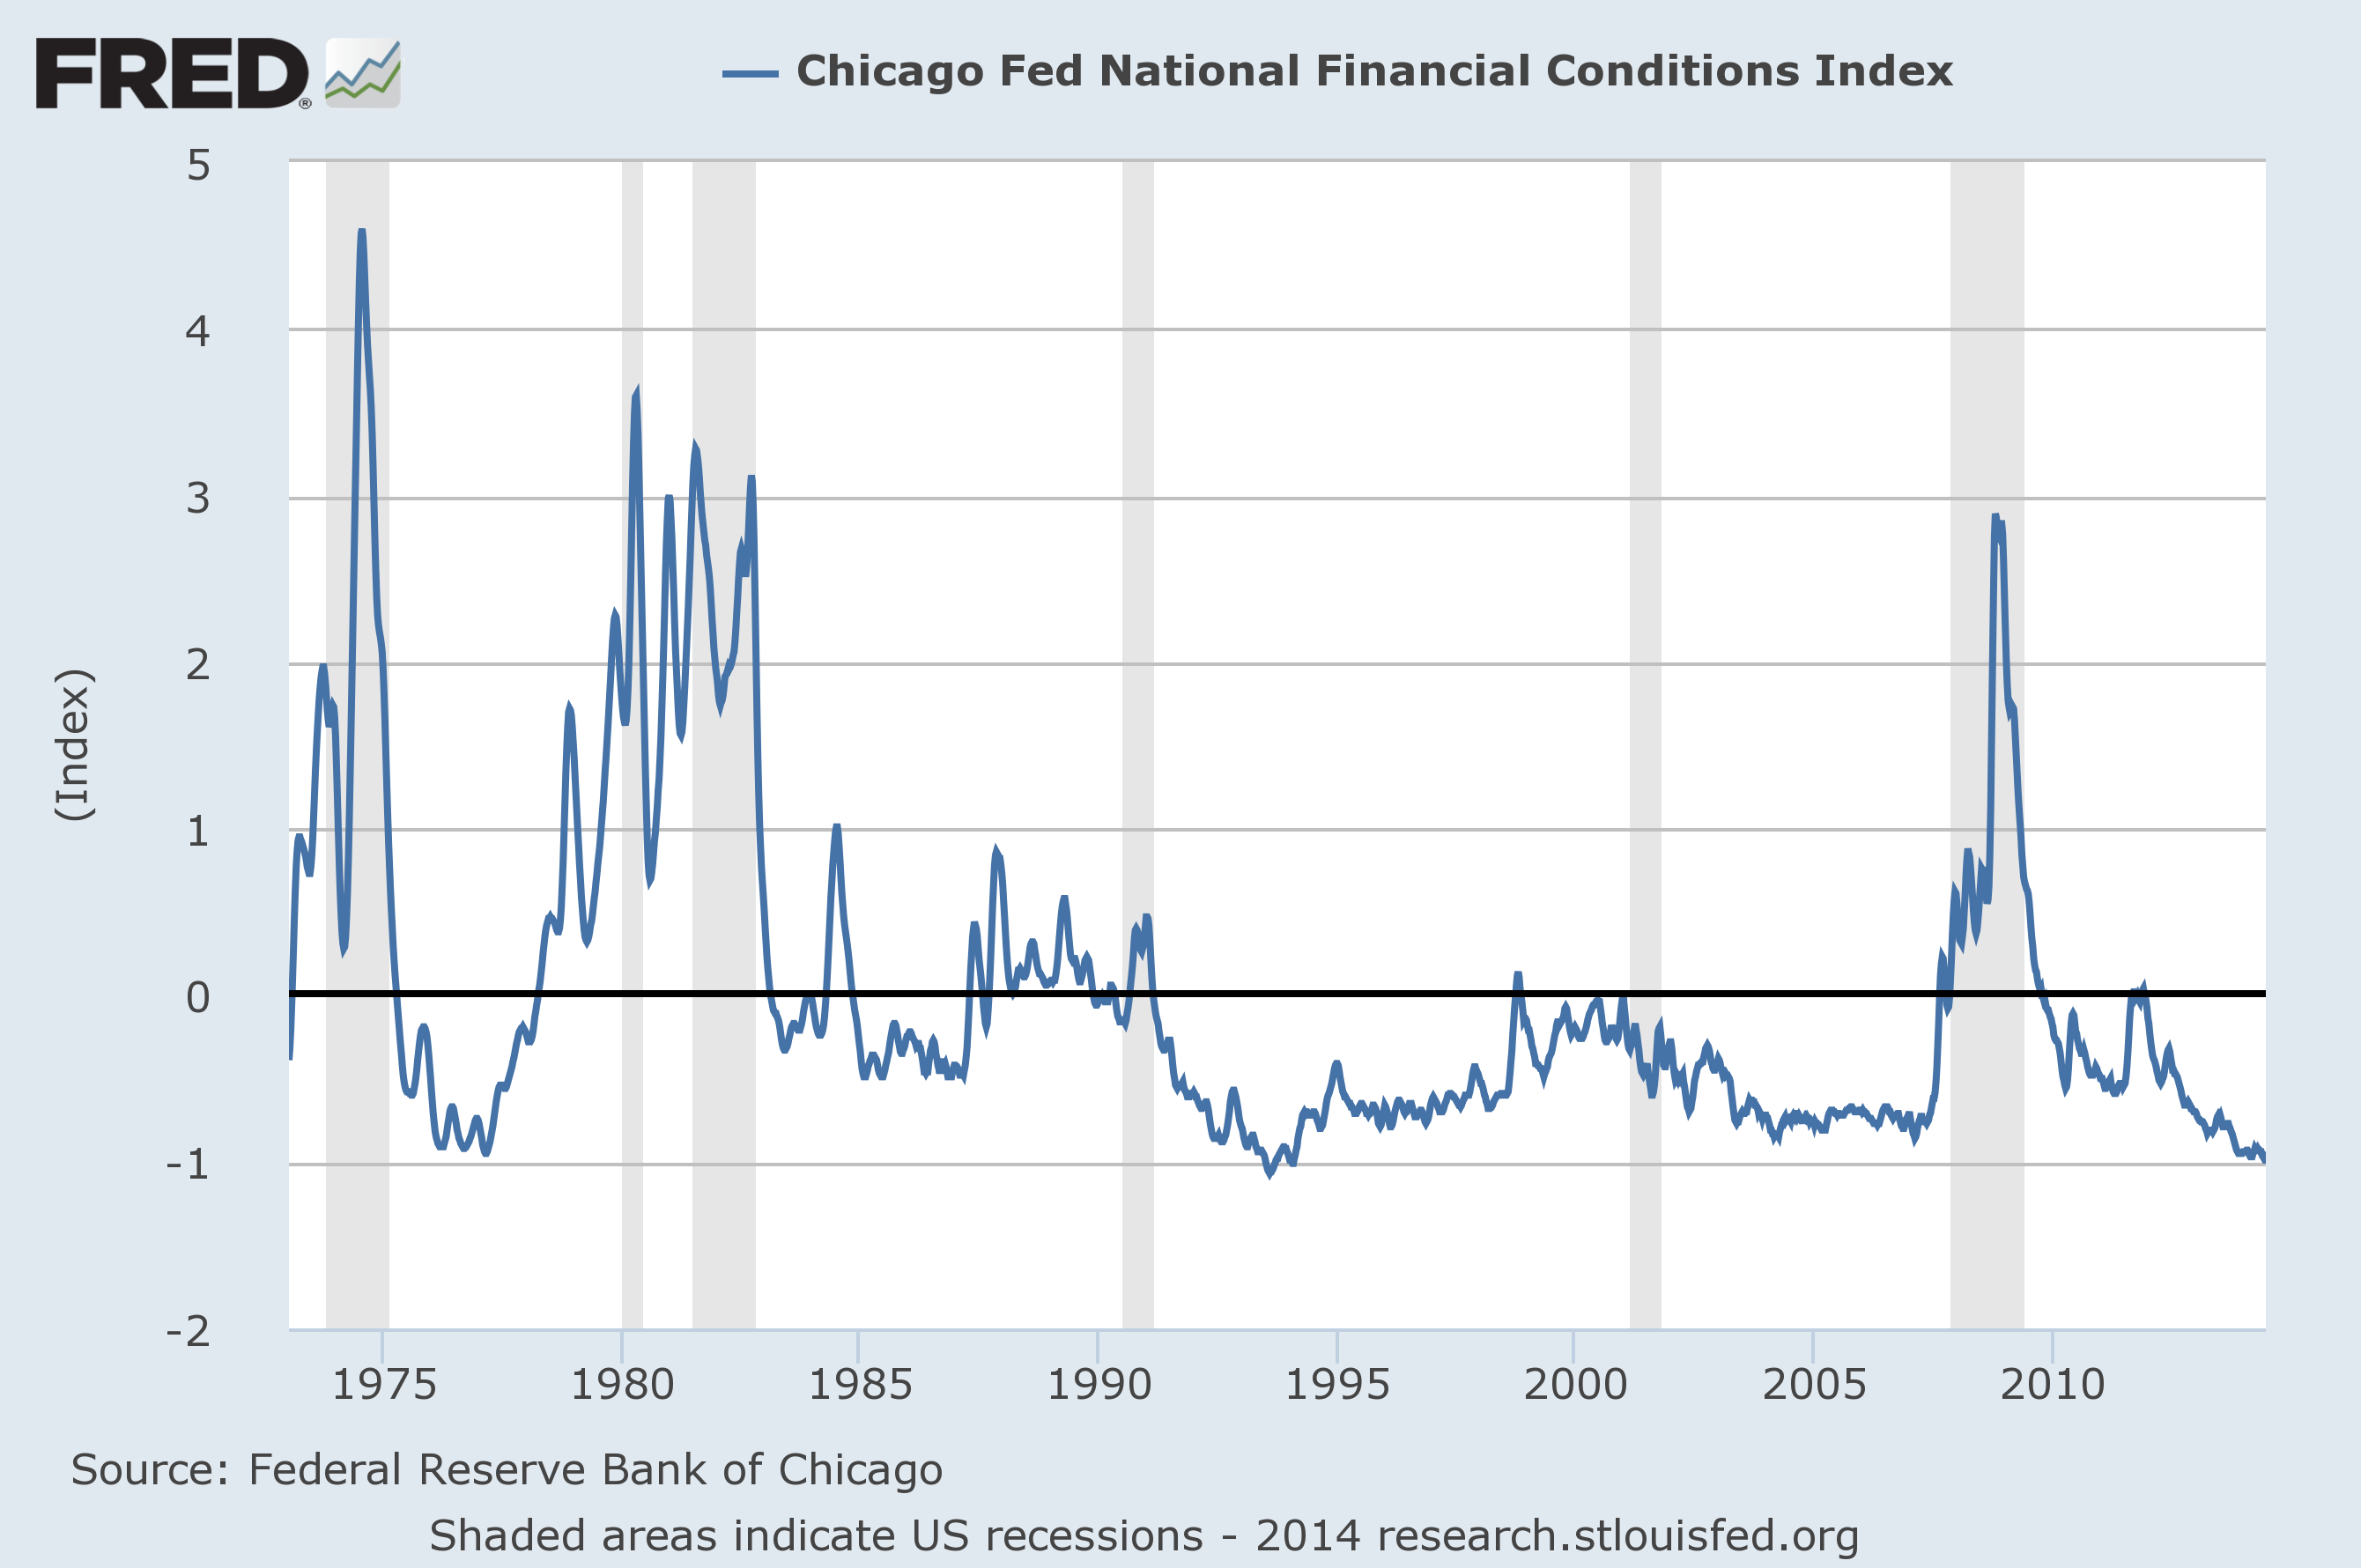
CHAIR YELLEN. So, let me--I'm sorry I didn't answer the last part of Greg's question and the last part of yours. Let me start there. With respect to financial stability, we monitor potential threats to financial stability very carefully, and we have spoken about some--I've spoken in recent congressional testimonies and speeches about some threats to financial stability that are on our radar screen that we are monitoring. Trends in leverage lending in the underwriting standards there, diminished risk spreads in lower-grade corporate bonds, high-yield bonds have certainly caught our attention. There is some evidence of reach for yield behavior. That's one of the reasons I mentioned that this environment of low volatility is very much on my radar screen and would be a concern to me if it prompted an increase in leverage or other kinds of risk-taking behavior that could unwind in a sharp way and provoke a sharp, for example, jump in interest rates. And we've seen what effect that can have on the global economy, and I think it's something that it's important to avoid. But broadly speaking, if the question is: To what extent is monetary policy at this time being driven by financial stability concerns? I would say that--well, I would never take off the table that monetary policy should--could in some circumstances respond. I don't see them shaping monetary policy in an important way right now. I don't see a broad-based increase in leverage, rapid increase in credit growth or maturity transformation, the kinds of broad trends that would suggest to me that the level of financial stability risks has risen above a moderate level. And we are using supervisory tools and regulations both to make the financial system more robust and to pay particular attention to areas where we've spotted concerns like leverage lending, which is very much a focus of our supervision.
Now, let's see. There was a first part to your question, and the first part was about global risks, and we always pay attention to global risks and the likely evolution of the global economy. You expressed a lot of pessimism about emerging markets, and I see it more likely that we'll see moderate growth and a pickup there. Of course, there are geopolitical risks, the Middle East developments in Iraq, of course. They're not only a humanitarian concern; they are a concern with respect potentially to energy supplies and prices, and so I would certainly list that as something in the category of risks to the outlook.
also:
PETER BARNES. Peter Barnes with Fox Business, ma'am. Can I--just to follow up a little bit on what Pedro asked about. Specifically, what about equity markets? I mean, right now, today, the S&P 500 is on track to close at a--another record high. You have said that you have not seen any evidence of bubbles in equity markets, and that they have been trading within historic norms. Is that still the case today? Thank you.
CHAIR YELLEN. So I don't have a sense--the committee doesn't try to gauge what is the right level of equity prices. But we do certainly monitor a number of different metrics that give us a feeling for where valuations are relative to things like earnings or dividends, and look at where these metrics stand in comparison with previous history to get a sense of whether or not we're moving to valuation levels that are outside of historical norms, and I still don't see that. I still don't see that for equity prices broadly.
_____
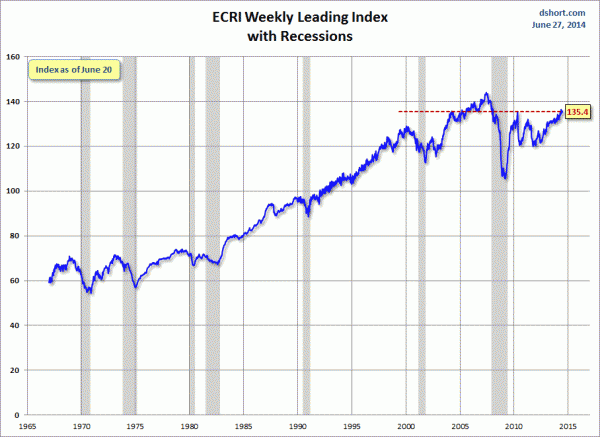
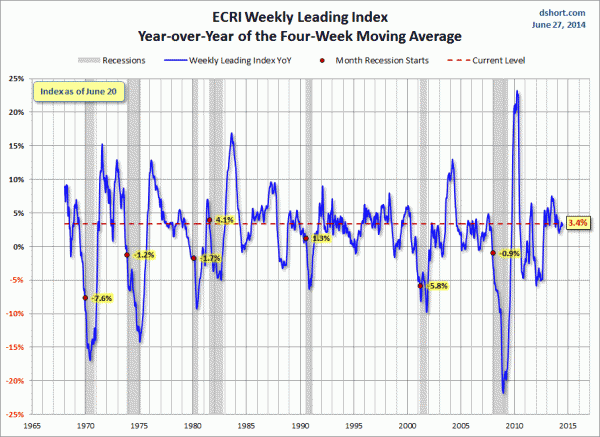
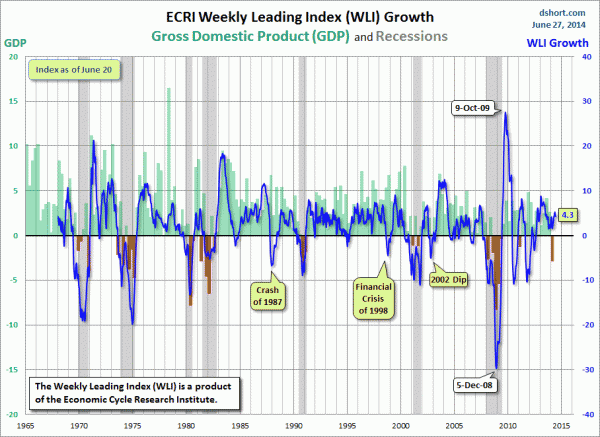
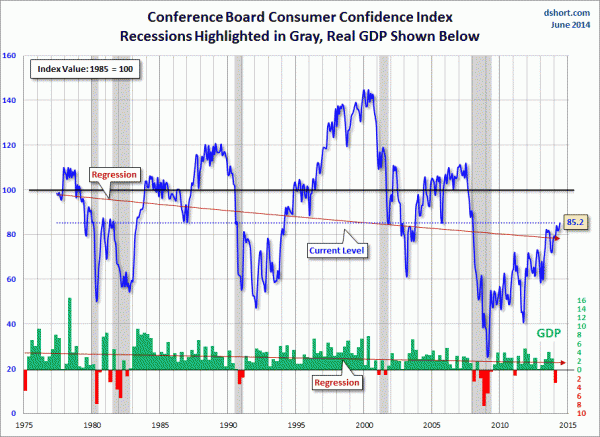
The Special Note summarizes my overall thoughts about our economic situation
SPX at 1959.48 as this post is written