Thursday, October 31, 2019

Jerome Powell’s October 30, 2019 Press Conference – Notable Aspects

On Wednesday, October 30, 2019 FOMC Chairman Jerome Powell gave his scheduled October 2019 FOMC Press Conference. (link of video and related materials)
Below are Jerome Powell’s comments I found most notable – although I don’t necessarily agree with them – in the order they appear in the transcript.  These comments are excerpted from the “Transcript of Chairman Powell’s Press Conference“ (preliminary)(pdf) of October 30, 2019, with the accompanying “FOMC Statement.”
From Chairman Powell’s opening comments:
CHAIR POWELL.  Good afternoon and welcome. 
My colleagues at the Federal Reserve and I are dedicated to serving the American people.  We do this by steadfastly pursuing the goals that Congress has given us—maximum employment and stable prices.  We are committed to making the best decisions we can, based on facts and objective analysis.  Today, we decided to lower the interest rates for the third time this year.  We took this step to help keep the U.S. economy strong in the face of global developments and to provide some insurance against ongoing risks.  As I will explain shortly, the policy adjustments we have made since last year are providing—and will continue to provide—meaningful support to the economy.  We believe that monetary policy is in a good place. 
The U.S. economy is in its 11th year of expansion, and the baseline outlook remains favorable.  The overall economy is growing at a moderate rate.  Household spending continues to be strong—supported by a healthy job market, rising incomes, and solid consumer confidence.  In contrast, business investment and exports remain weak, and manufacturing output has declined over the past year.  Sluggish growth abroad and trade developments have been weighing on those sectors.  Looking ahead, we continue to expect the economy to expand at a moderate rate, reflecting solid household spending and supportive financial conditions.
Jerome Powell’s responses as indicated to the various questions:
HEATHER LONG.  Hi, Heather Long from the Washington Post.  You just said that the risk to the outlook are moving in a positive direction. I’m wondering if you could specify is that on trade or are there other matters?  This morning, we obviously learned that we’ve now had two quarters of contracting business investment which would seem to be moving the outlook in the other direction.
CHAIR POWELL.  So, in terms of risks, what I was referring to there, the principal risks that we’ve been monitoring have been really slowing global growth and trade policy developments.  As well as muted inflation pressure.  So, I was really referring there to trade developments.  We have that phase one potential agreement with China, which if signed and put into effect could have the effect of reducing trade tensions and producing uncertainty and that would bode well, we think, for business confidence and perhaps activity over time.  So, that has the potential for being an improvement in the risk picture.  Brexit, I would say as well, it appears that the risk of a no deal Brexit seems to have materially declined.  I think on both situations there’s plenty of risk left, but I’d have to say that the risks seem to have subsided. 
You ask about business investment, and that’s right.  Business investment has been weakened.  Today’s reading was weak as well, and it was broad across equipment and other parts of, parts of business fixed investment were weak.  That’s consistent with what we’ve seen, but that’s the economy we’ve had this year.  What we’ve had is an economy where the consumer is really driving growth and, you know, personal consumption expenditures were almost 3 percent in this quarter, in this first reading for the quarter.  So, overall, we see the economy as having been resilient to the, you know, the winds that have been blowing this year. 
also:
JEAN YUNG.  Hi.  Jean Yung from Market News.  I wanted to ask about financial stability risk.  Recently, the IMF and some other global policy makers have been expressing concerns over the high level of risk in corporate debt.  So, as rates get lower in the U.S. and around the world, are you more worried about financial stability reach for yield? 
CHAIR POWELL.  So, we monitor financial stability risks very carefully all of the time.  It’s what we do since the financial crisis, as I’ve mentioned before.  Currently, we don’t see large imbalances.  This long expansion is notable for the lack of large financial imbalances like the ones we’ve seen certainly before the crisis happened.  So, we have a four-part framework, I’ll quickly mention.  The first is leverage in the financial system which is low by historical standards.  The second is funding risk which is the risk of runnable funding, and that risk is also quite low for banks but also for, you know, the nonbanking financial sector.  If you look at asset prices, we see some high asset prices, but not broadly across a range.  We don’t see bubbles in that kind of thing.  And, that leaves the fourth which is leverage in the nonfinancial sector and that’s households and businesses.  So, with households, again, we don’t see leverage.  We see them actually getting in very good shape financially in the aggregate.  Obviously, plenty of households are not in great shape financially, but in the aggregate, the household sector’s in a very good place.  That leaves businesses which is where the issue has been.  Leverage among corporations and other forms of business, private businesses, is historically high.  We’ve been monitoring it carefully and taking appropriate steps.  That’s what I would say, but it’s corporate debt is one part of a larger part of our framework, and it is something that we’re paying quite a bit of attention to, and it’s been part of the last couple of shared national credit exams, and we’ve been monitoring it carefully and taking appropriate action.
_____
_____
The Special Note summarizes my overall thoughts about our economic situation
SPX at 3027.39 as this post is written
Employment Cost Index (ECI) – Third Quarter 2019

While the concept of Americans’ incomes can be defined in a number of ways, many prominent measures continue to show disconcerting trends.
One prominent measure is the Employment Cost Index (ECI).
Here is a description from the BLS document titled “The Employment Cost Index:  what is it?“:
The Employment Cost Index (ECI) is a quarterly measure of the change in the price of labor, defined as compensation per employee hour worked. Closely watched by many economists, the ECI is an indicator of cost pressures within companies that could lead to price inflation for finished goods and services. The index measures changes in the cost of compensation not only for wages and salaries, but also for an extensive list of benefits. As a fixed-weight, or Laspeyres, index, the ECI controls for changes occurring over time in the industrial-occupational composition of employment.
On October 31, 2019, the ECI for the third quarter was released.  Here are two excerpts from the BLS release titled “Employment Cost Index – September 2019“:
Compensation costs for civilian workers increased 0.7 percent, seasonally adjusted, for the 3-month period ending in September 2019, the U.S. Bureau of Labor Statistics reported today. Wages and salaries increased 0.9 percent and benefit costs increased 0.6 percent from June 2019. (See tables A, 1, 2, and 3.)
also:
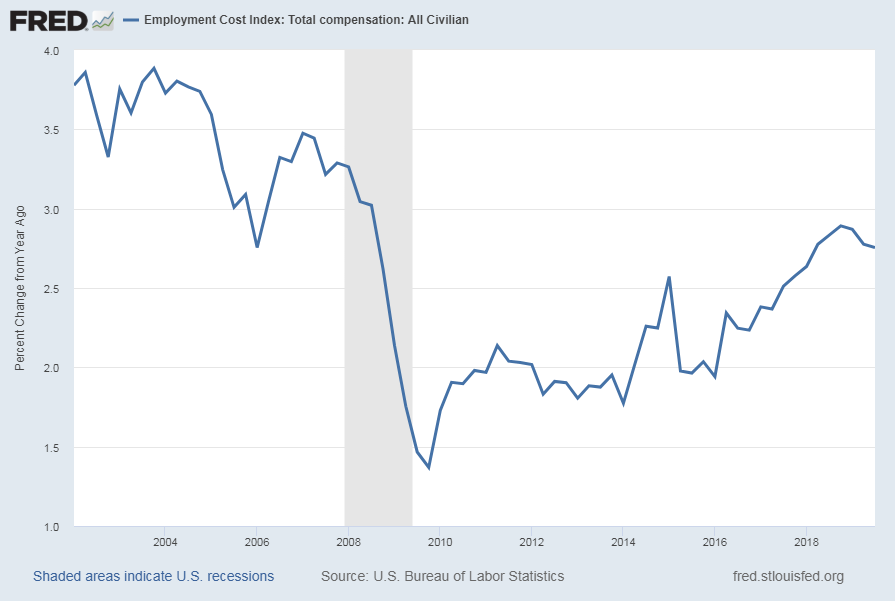
Compensation costs for civilian workers increased 2.8 percent for the 12-month period ending in September 2019, the same as in September 2018. Wages and salaries increased 2.9 percent for the 12-month period ending in September 2019 and also increased 2.9 percent for the 12-month period ending in September 2018. Benefit costs increased 2.3 percent for the 12-month period ending in September 2019. In September 2018, the increase was 2.6 percent. (See tables A, 4, 8, and 12.)
Below are three charts, updated on October 31, 2019 that depict various aspects of the ECI, which is seasonally adjusted (SA):
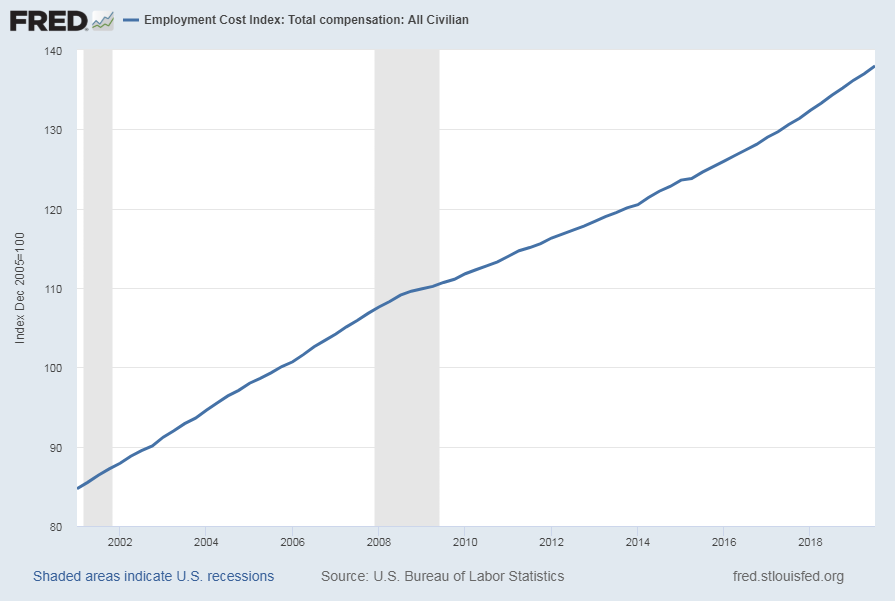
The first depicts the ECI, with a value of 138.0:
ECIALLCIV
source: US. Bureau of Labor Statistics, Employment Cost Index: Total compensation: All Civilian[ECIALLCIV], retrieved from FRED, Federal Reserve Bank of St. Louis, accessed October 31, 2019:
https://research.stlouisfed.org/fred2/series/ECIALLCIV/
The second chart depicts the ECI on a “Percent Change from Year Ago” basis, with a value of 2.8%:
ECIALLCIV Percent Change From Year Ago
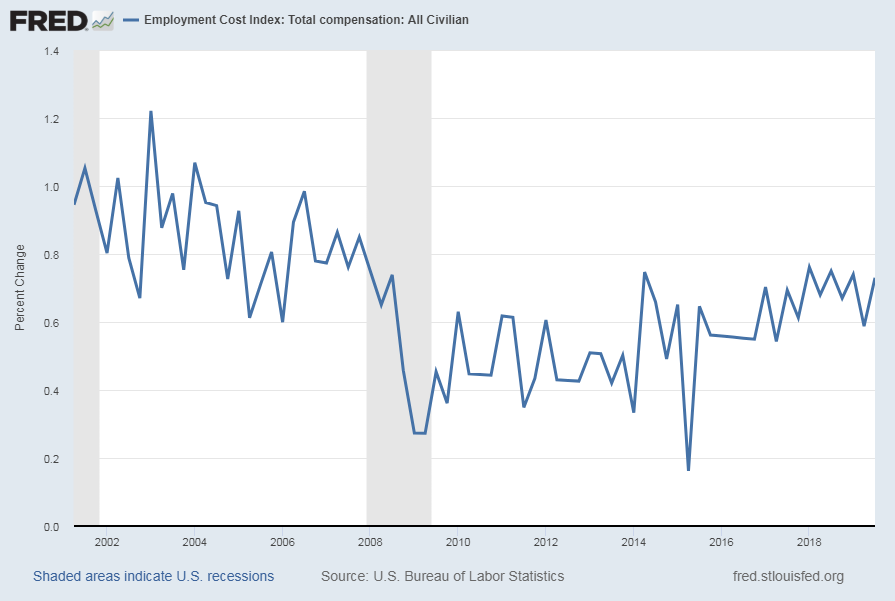
The third chart depicts the ECI on a “Percent Change” (from last quarter) basis, with a value of .7%:
ECIALLCIV Percent Change
_________
I post various indicators and indices because I believe they should be carefully monitored.  However, as those familiar with this site are aware, I do not necessarily agree with what they depict or imply.
_____
The Special Note summarizes my overall thoughts about our economic situation
SPX at 3030.05 as this post is written

Velocity Of Money – Charts Updated Through October 30, 2019

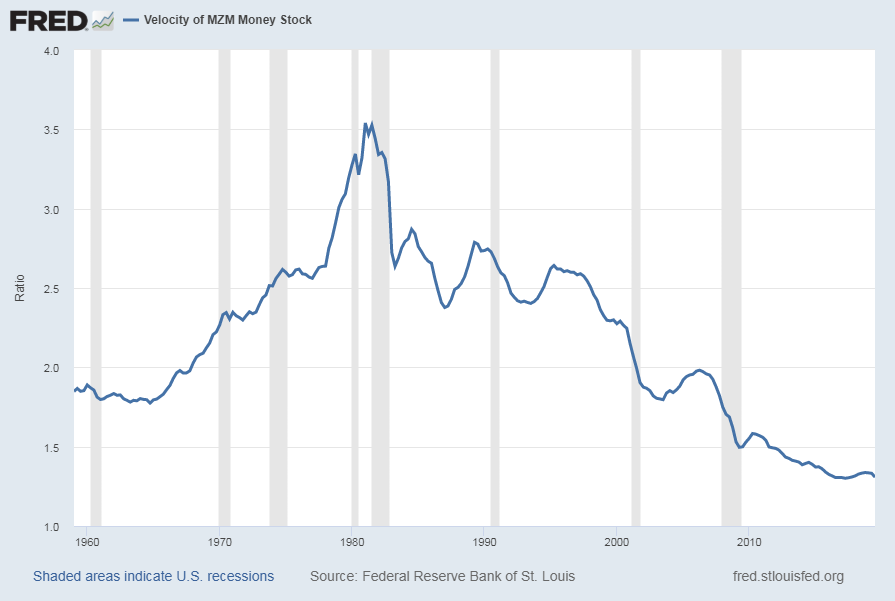
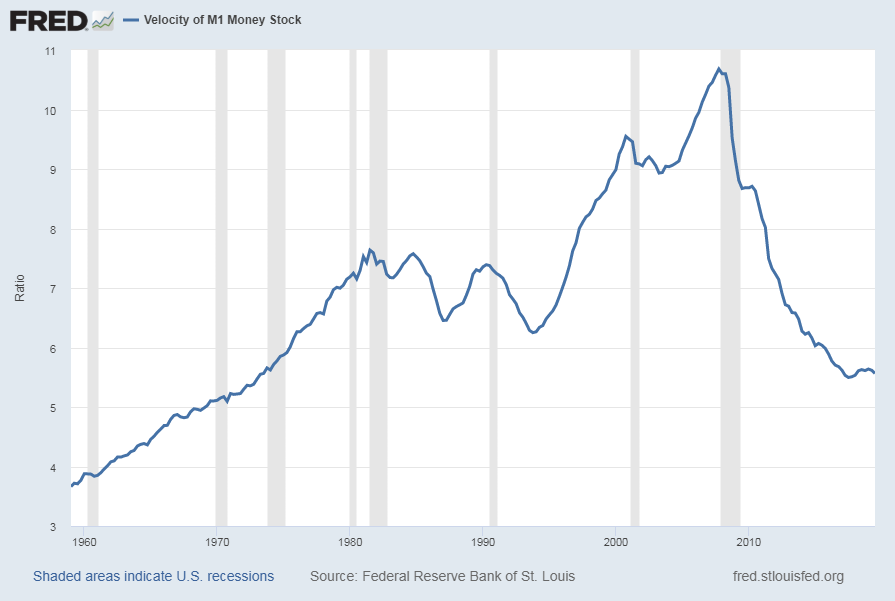
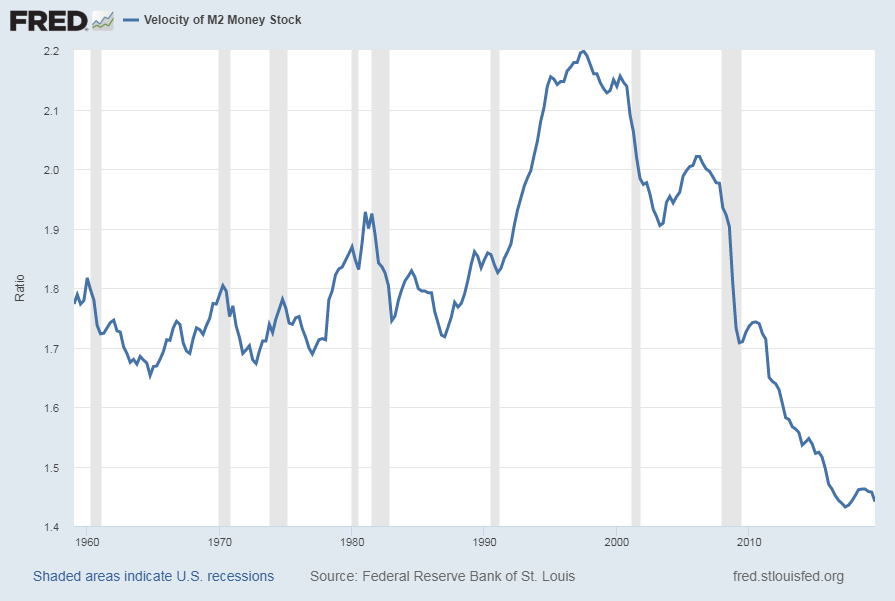
Here are three charts from the St. Louis Fed depicting the velocity of money in terms of the MZM, M1 and M2 money supply measures.
All charts reflect quarterly data through the 3rd quarter of 2019, and were last updated as of October 30, 2019.
Velocity of MZM Money Stock, current value = 1.308:
MZMV
Data Source: FRED, Federal Reserve Economic Data, Federal Reserve Bank of St. Louis; accessed October 30, 2019:
http://research.stlouisfed.org/fred2/series/MZMV
Velocity of M1 Money Stock, current value = 5.565:
M1V
Data Source: FRED, Federal Reserve Economic Data, Federal Reserve Bank of St. Louis; accessed October 30, 2019:
http://research.stlouisfed.org/fred2/series/M1V
Velocity of M2 Money Stock, current value = 1.441:
M2V
Data Source: FRED, Federal Reserve Economic Data, Federal Reserve Bank of St. Louis; accessed October 30, 2019:
http://research.stlouisfed.org/fred2/series/M2V
_________
I post various indicators and indices because I believe they should be carefully monitored.  However, as those familiar with this site are aware, I do not necessarily agree with what they depict or imply.
_____
The Special Note summarizes my overall thoughts about our economic situation
SPX at 3027.17 as this post is written

Wednesday, October 30, 2019

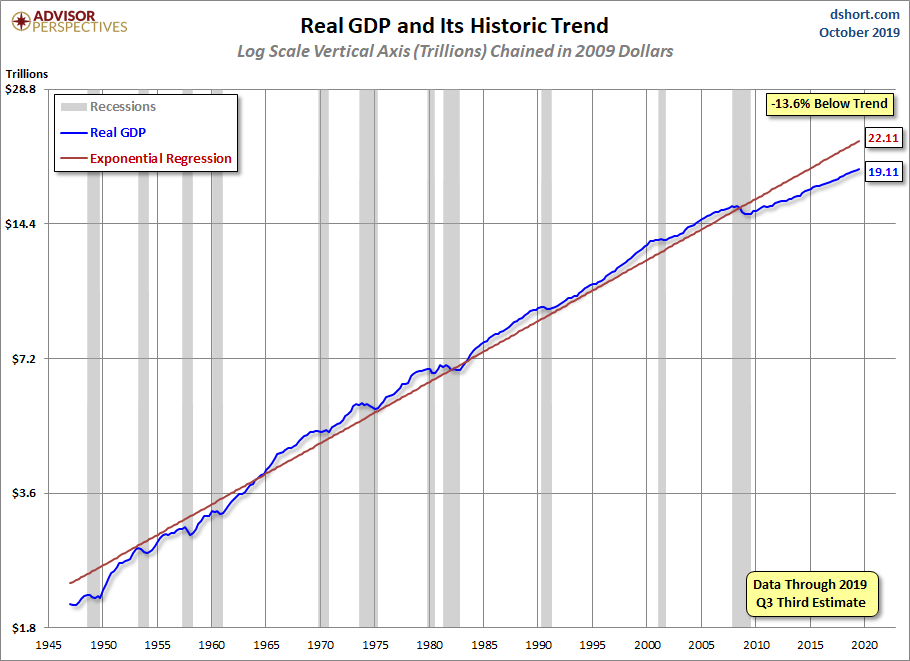
Real GDP Chart Since 1947 With Trendline – 3rd Quarter 2019

For reference purposes, below is a chart from the Doug Short site post of October 30, 2019 titled “Q3 GDP Advance Estimate: Real GDP at 1.9%” reflecting Real GDP, with a trendline, as depicted.  This chart incorporates the Gross Domestic Product, Third Quarter 2019 (Advance Estimate) (pdf) of October 30, 2019:
U.S. Real GDP through Q3 2019 Advance Estimate
_________
I post various indicators and indices because I believe they should be carefully monitored.  However, as those familiar with this site are aware, I do not necessarily agree with what they depict or imply.
_____
The Special Note summarizes my overall thoughts about our economic situation
SPX at 3036.41 as this post is written

Chicago Fed National Financial Conditions Index (NFCI)

The St. Louis Fed’s Financial Stress Index (STLFSI) is one index that is supposed to measure stress in the financial system.  Its reading as of the October 24, 2019 update (reflecting data through October 18, 2019) is -1.215.
Of course, there are a variety of other measures and indices that are supposed to measure financial stress and other related issues, both from the Federal Reserve as well as from private sources.
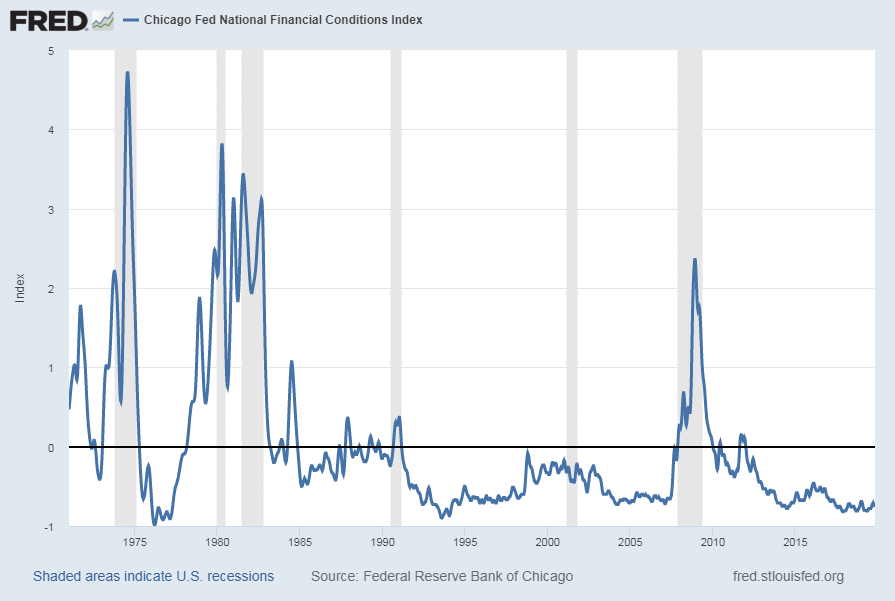
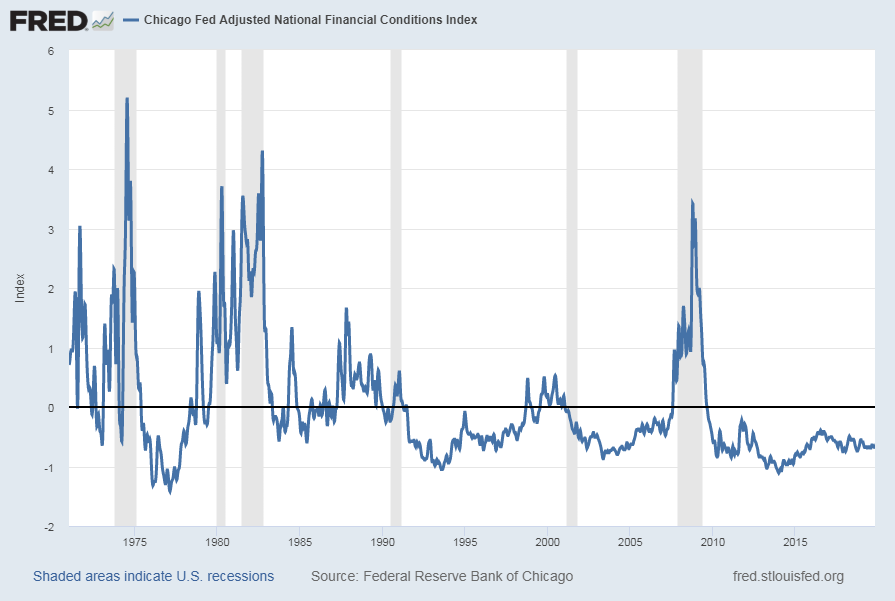
Two other indices that I regularly monitor include the Chicago Fed National Financial Conditions Index (NFCI) as well as the Chicago Fed Adjusted National Financial Conditions Index (ANFCI).
Here are summary descriptions of each, as seen in FRED:
The National Financial Conditions Index (NFCI) measures risk, liquidity and leverage in money markets and debt and equity markets as well as in the traditional and “shadow” banking systems. Positive values of the NFCI indicate financial conditions that are tighter than average, while negative values indicate financial conditions that are looser than average.
The adjusted NFCI (ANFCI). This index isolates a component of financial conditions uncorrelated with economic conditions to provide an update on how financial conditions compare with current economic conditions.
For further information, please visit the Federal Reserve Bank of Chicago’s web site:
Below are the most recently updated charts of the NFCI and ANFCI, respectively.
The NFCI chart below was last updated on October 30, 2019 incorporating data from January 8, 1971 through October 25, 2019, on a weekly basis.  The October 25 value is -.76:
NFCI -.76
Data Source: FRED, Federal Reserve Economic Data, Federal Reserve Bank of St. Louis; accessed October 30, 2019: 
http://research.stlouisfed.org/fred2/series/NFCI
The ANFCI chart below was last updated on October 30, 2019 incorporating data from January 8, 1971 through October 25, 2019, on a weekly basis.  The October 25 value is -.70:
ANFCI -.70
Data Source: FRED, Federal Reserve Economic Data, Federal Reserve Bank of St. Louis; accessed October 30, 2019: 
http://research.stlouisfed.org/fred2/series/ANFCI
_________
I post various indicators and indices because I believe they should be carefully monitored.  However, as those familiar with this site are aware, I do not necessarily agree with what they depict or imply.
_____
The Special Note summarizes my overall thoughts about our economic situation
SPX at 3036.86 as this post is written

Monday, October 28, 2019

Updates Of Economic Indicators October 2019

Here is an update of various indicators that are supposed to predict and/or depict economic activity. These indicators have been discussed in previous blog posts:
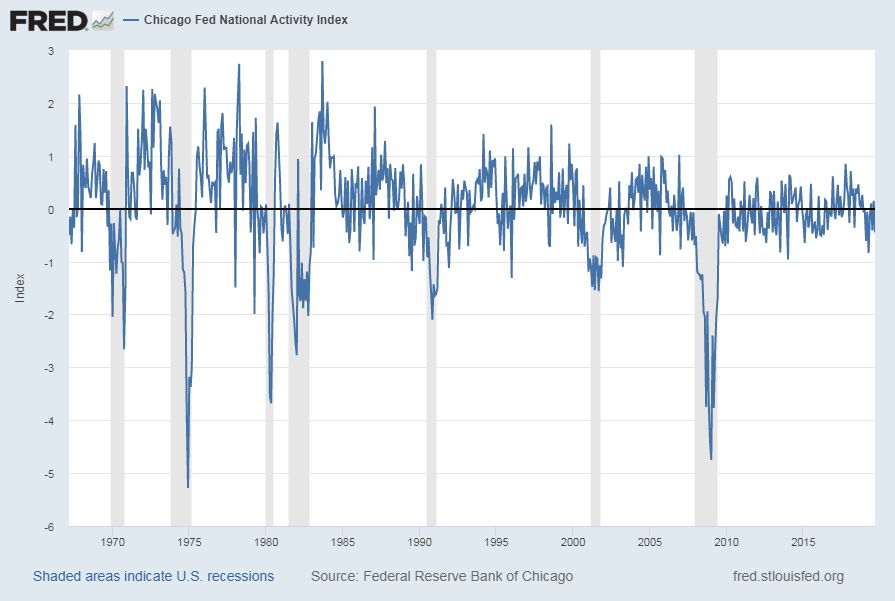
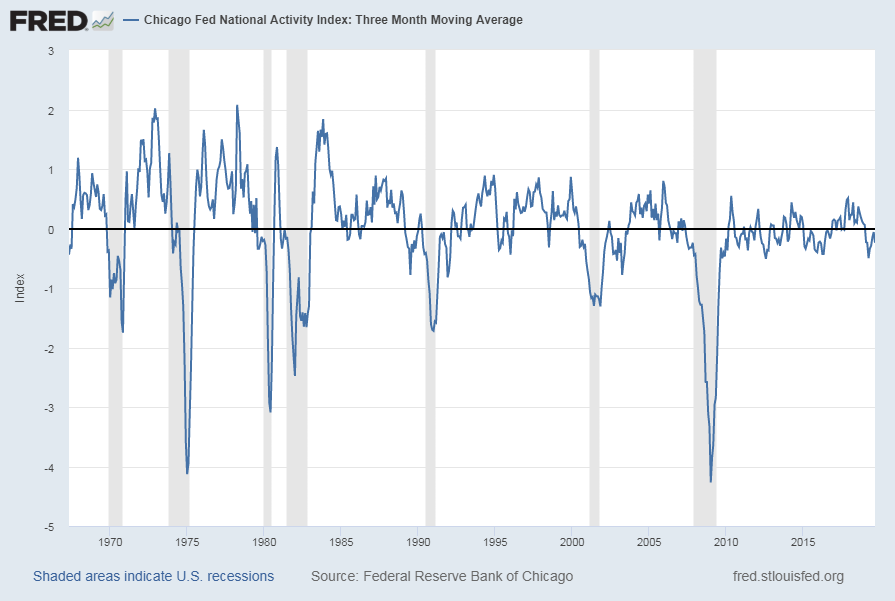
The October 2019 Chicago Fed National Activity Index (CFNAI) updated as of October 28, 2019:
The CFNAI, with current reading of -.45:

CFNAI -.45 as of 10-28-19

source:  Federal Reserve Bank of Chicago, Chicago Fed National Activity Index [CFNAI], retrieved from FRED, Federal Reserve Bank of St. Louis, October 28, 2019;
https://fred.stlouisfed.org/series/CFNAI
The CFNAI-MA3, with current reading of -.24:

CFNAIMA3 -.24 as of 10-28-19

source:  Federal Reserve Bank of Chicago, Chicago Fed National Activity Index: Three Month Moving Average [CFNAIMA3], retrieved from FRED, Federal Reserve Bank of St. Louis, October 28, 2019;
https://fred.stlouisfed.org/series/CFNAIMA3
As of October 25, 2019 (incorporating data through October 18, 2019) the WLI was at 144.8 and the WLI, Gr. was at -.2%.
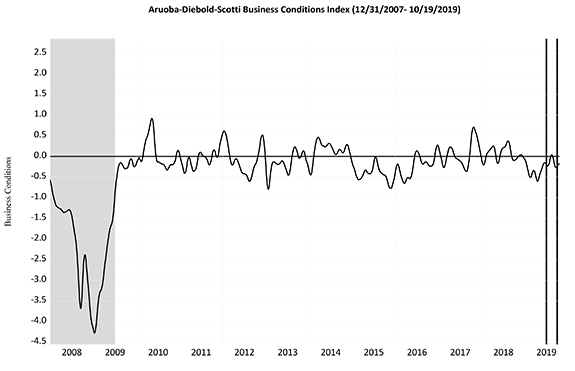
Here is the latest chart, depicting the ADS Index from December 31, 2007 through October 19, 2019:


The Conference Board Leading (LEI), Coincident (CEI) Economic Indexes, and Lagging Economic Indicator (LAG):
As per the October 18, 2019 press release, titled “The Conference Board Leading Economic Index (LEI) for the U.S. Declined Slightly” (pdf) the LEI was at 111.9, the CEI was at 106.4, and the LAG was 108.3 in September.
An excerpt from the release:
“The US LEI declined in September because of weaknesses in the manufacturing sector and the interest rate spread which were only partially offset by rising stock prices and a positive contribution from the Leading Credit Index,” said Ataman Ozyildirim, Senior Director of Economic Research at The Conference Board. “The LEI reflects uncertainty in the outlook and falling business expectations, brought on by the downturn in the industrial sector and trade disputes. Looking ahead, the LEI is consistent with an economy that is still growing, albeit more slowly, through the end of the year and into 2020.”
_________
I post various indicators and indices because I believe they should be carefully monitored.  However, as those familiar with this site are aware, I do not necessarily agree with what they depict or imply.
_____
The Special Note summarizes my overall thoughts about our economic situation
SPX at 3040.39 as this post is written
Friday, October 25, 2019

Charts Indicating Economic Weakness – October 2019

U.S. Economic Indicators

Throughout this site there are many discussions of economic indicators.  At this time, the readings of various indicators are especially notable.  This post is the latest in a series of posts indicating U.S. economic weakness or a notably low growth rate.
While many U.S. economic indicators – including GDP – are indicating economic growth, others depict (or imply) various degrees of weak growth or economic contraction.  As seen in the October 2019 Wall Street Journal Economic Forecast Survey the consensus (average estimate) among various economists is for 2.2% GDP growth in 2019 and 1.6% GDP growth in 2020.  However, there are other broad-based economic indicators that seem to imply a weaker growth rate.
As well, it should be remembered that GDP figures can be (substantially) revised.

Charts Indicating U.S. Economic Weakness

Below are a small sampling of charts that depict weak growth or contraction, and a brief comment for each:
__

The Aruoba-Diebold-Scotti Business Conditions Index (ADS Index)

Various broad-based economic indicators that seem to imply a weaker growth rate than GDP.
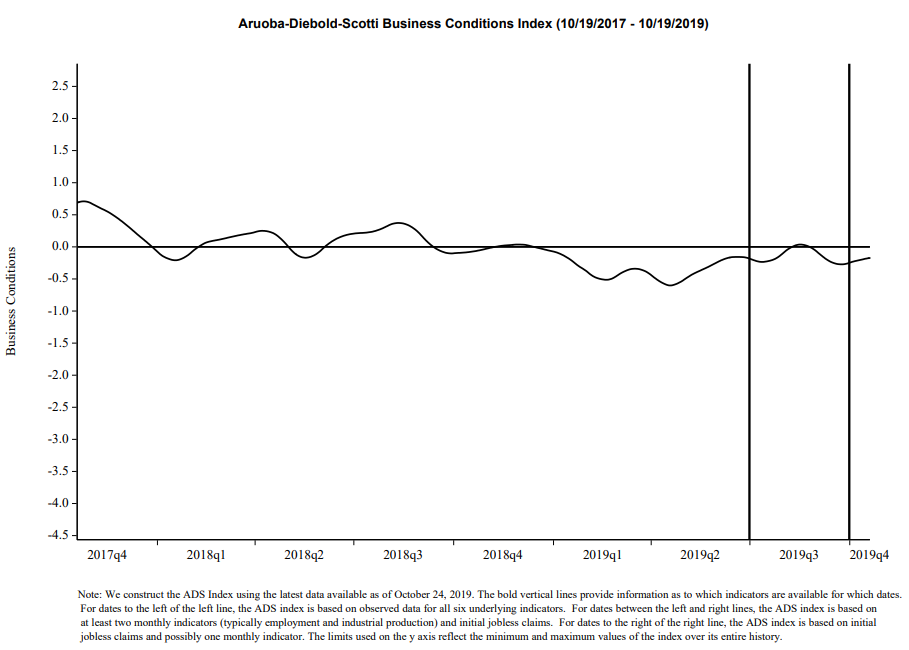
Among the broad-based economic indicators that seem to imply subdued growth or decline is that of the Aruoba-Diebold-Scotti Business Conditions Index (ADS Index.)  Below is a chart of the index from October 19, 2017 through October 19, 2019, with a value of -.1745, as of the October 24 update:
ADS Index -.1745 on 10-19-19 as of the 10-24-19 update
source:  Federal Reserve Bank of Philadelphia, Aruoba-Diebold-Scotti Business Conditions Index (ADS Index)
__

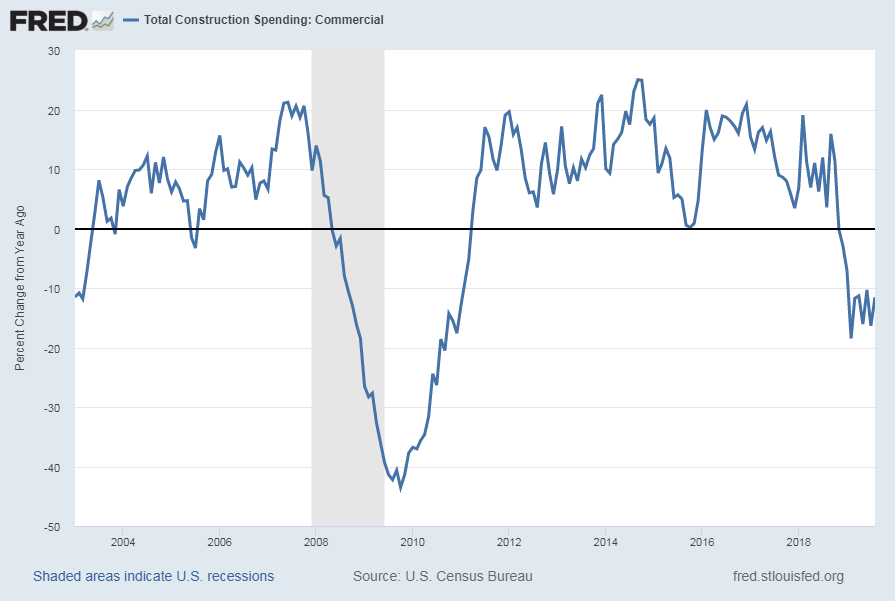
Total Construction Spending:  Commercial

Various measures of construction spending continue to exhibit weakness. “Total Construction Spending: Commercial” is a measure of construction exhibiting a contraction on a “Percent Change From Year Ago” basis.   This measure through August had a last value of $80,247 Million.  Shown below is the measure displayed on a “Percent Change From Year Ago” basis with a value of -11.6%, last updated October 1, 2019:
Total Construction Spending:  Commercial Percent Change From Year Ago
source:  U.S. Bureau of the Census, Total Construction Spending: Commercial [TLCOMCONS], retrieved from FRED, Federal Reserve Bank of St. Louis, accessed October 8, 2019: https://fred.stlouisfed.org/series/TLCOMCONS
__

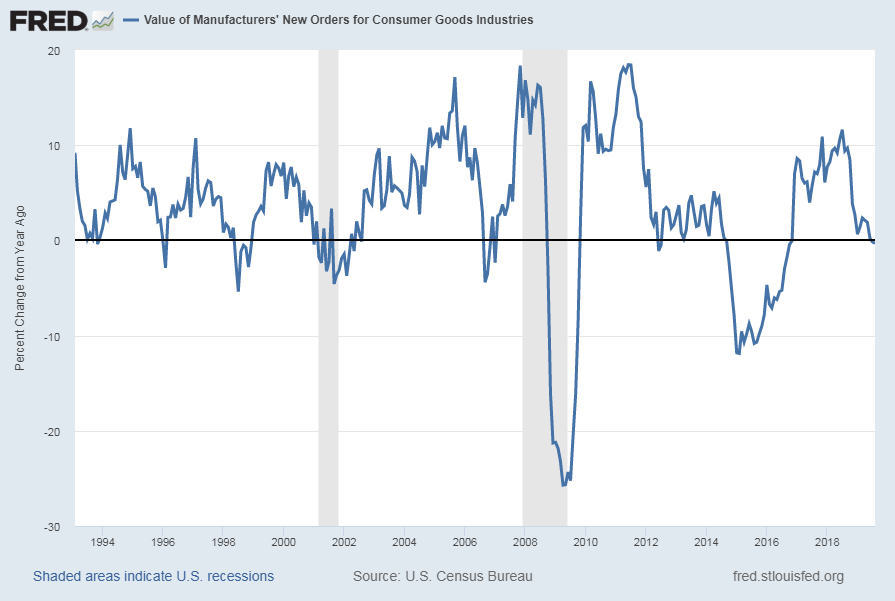
Value of Manufacturers’ New Orders for Consumer Goods Industries (ACOGNO)

A measure for consumer goods exhibiting a weakening (on a YoY basis) growth trend is the “Value of Manufacturers’ New Orders for Consumer Goods Industries” (ACOGNO). Shown below is this measure (with last value of $212,301 Million through August) displayed on a “Percent Change From Year Ago” basis with value -.3%, last updated October 3, 2019:
Value of Manufacturers’ New Orders for Consumer Goods Industries” (ACOGNO) Percent Change From Year Ago
source:  U.S. Census Bureau, Value of Manufacturers’ New Orders for Consumer Goods Industries [ACOGNO], retrieved from FRED, Federal Reserve Bank of St. Louis; accessed October 8, 2019:  https://fred.stlouisfed.org/series/ACOGNO
__

Average Weekly Overtime Hours of Production and Nonsupervisory Employees: Manufacturing (AWOTMAN)

Various U.S. manufacturing measures continue to indicate either a significant weakening in growth or a decline in various aspects of activity. Another indication of weakening manufacturing activity is overtime hours. Shown below is the “Average Weekly Overtime Hours of Production and Nonsupervisory Employees: Manufacturing” measure (with last value of 4.2 hours through August) displayed on a “Percent Change From Year Ago” basis with value -6.7%, last updated October 4, 2019:
Average Weekly Overtime Hours of Production and Nonsupervisory Employees: Manufacturing [AWOTMAN] Percent Change From A Year Ago
source: U.S. Bureau of Labor Statistics, Average Weekly Overtime Hours of Production and Nonsupervisory Employees: Manufacturing [AWOTMAN], retrieved from FRED, Federal Reserve Bank of St. Louis; accessed October 8, 2019: https://fred.stlouisfed.org/series/AWOTMAN

__

Rail Freight Carloads

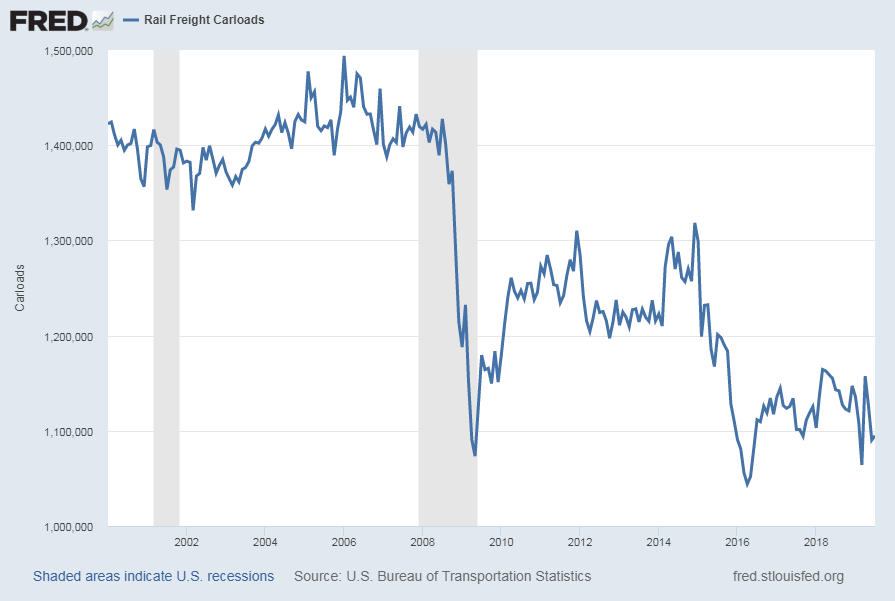
“Rail Freight Carloads” continues to show a generally downward progression from a longer-term perspective.  Shown below is a chart with data through July (last value of 1,094,904 updated September 23, 2019):
Rail Freight Carloads
source:  U.S. Bureau of Transportation Statistics, Rail Freight Carloads [RAILFRTCARLOADSD11], retrieved from FRED, Federal Reserve Bank of St. Louis;  accessed October 9, 2019: https://fred.stlouisfed.org/series/RAILFRTCARLOADSD11
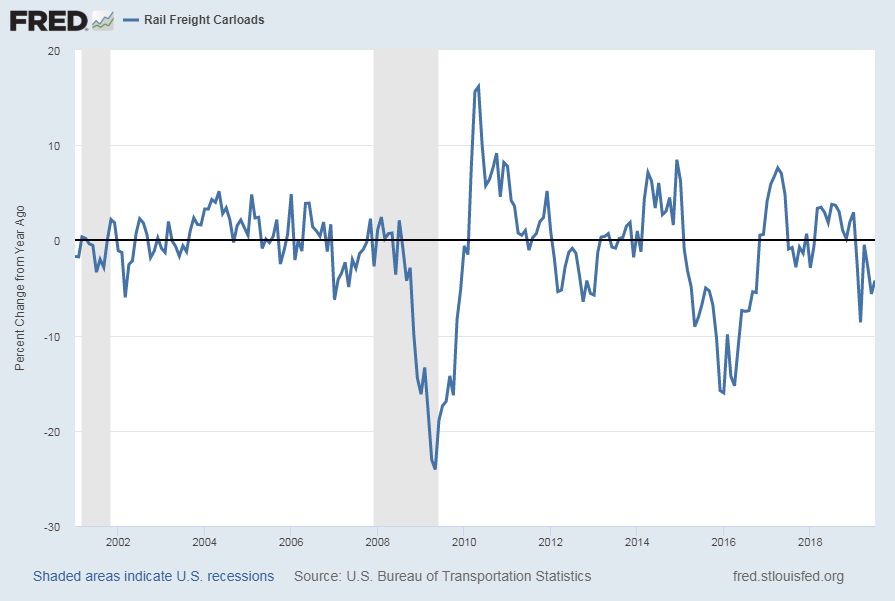
Here is the same measure on a “Percent Change From Year Ago” basis, with value -4.2%:
Rail Freight Carloads Percent Change From Year Ago
__

Other Indicators

As mentioned previously, many other indicators discussed on this site indicate economic weakness or economic contraction, if not outright (gravely) problematical economic conditions.
_____
The Special Note summarizes my overall thoughts about our economic situation
SPX at 3010.29 as this post is written