Saturday, February 29, 2020

Markets During Periods Of Federal Reserve Intervention – February 29, 2020 Update

In the August 9, 2011 post (“QE3 – Various Thoughts“) I posted a chart that depicted the movements of the S&P500, 10-Year Treasury Yield and the Fed Funds rate spanning the periods of various Federal Reserve interventions since 2007.
For reference purposes, here is an updated chart (through February 28, 2020) from the Doug Short site post of February 28 (“Treasury Snapshot:  10-Year Note at 1.13%“):

The S&P500 and Federal Reserve Intervention

_____
The Special Note summarizes my overall thoughts about our economic situation
SPX at 2954.22 as this post is written

Friday, February 28, 2020

Broad-Based Indicators Of Economic Activity

The Chicago Fed National Activity Index (CFNAI) and the Aruoba-Diebold-Scotti Business Conditions Index (ADS Index) are two broad-based economic indicators that I regularly feature in this site.
The short-term and long-term trends of each continue to be notable.
The post on the Doug Short site of February 28, 2020, titled “The Philly Fed ADS Index Business Conditions Index Update” displays both the CFNAI MA-3 (3-month Moving Average) and ADS Index (91-Day Moving Average) from a variety of perspectives.
Of particular note, two of the charts, shown below, denote where the current levels of each reading is relative to the beginning of past recessionary periods, as depicted by the red dots.
The CFNAI MA-3:
(click on charts to enlarge images)
Chicago Fed National Activity Index
The ADS Index, 91-Day MA:
ADS Index
Also shown in the aforementioned post is a chart of each with a long-term trendline (linear regression) as well as a chart depicting GDP for comparison purposes.
_________
I post various indicators and indices because I believe they should be carefully monitored.  However, as those familiar with this site are aware, I do not necessarily agree with what they depict or imply.
_____
The Special Note summarizes my overall thoughts about our economic situation
SPX at 2896.54 as this post is written

Thursday, February 27, 2020

Durable Goods New Orders – Long-Term Charts Through January 2020

Many people place emphasis on Durable Goods New Orders as a prominent economic indicator and/or leading economic indicator.
For reference, below are two charts depicting this measure.
First, from the St. Louis Fed site (FRED), a chart through January 2020, updated on February 27, 2020. This value is $246,199 ($ Millions):
(click on charts to enlarge images)
Durable Goods New Orders
Second, here is the chart depicting this measure on a “Percentage Change from a Year Ago” basis, with a last value of -3.9%:
Durable Goods New Orders Percent Change From Year Ago
Data Source: FRED, Federal Reserve Economic Data, Federal Reserve Bank of St. Louis: Manufacturers’ New Orders:  Durable Goods [DGORDER]; U.S. Department of Commerce: Census Bureau; accessed February 27, 2020;
http://research.stlouisfed.org/fred2/series/DGORDER
_________
I post various indicators and indices because I believe they should be carefully monitored.  However, as those familiar with this site are aware, I do not necessarily agree with what they depict or imply.
_____
The Special Note summarizes my overall thoughts about our economic situation
SPX at 3079.51 as this post is written

Wednesday, February 26, 2020

Chicago Fed National Financial Conditions Index (NFCI)

The St. Louis Fed’s Financial Stress Index (STLFSI) is one index that is supposed to measure stress in the financial system.  Its reading as of the February 20, 2020 update (reflecting data through February 14, 2020) is -1.604.
Of course, there are a variety of other measures and indices that are supposed to measure financial stress and other related issues, both from the Federal Reserve as well as from private sources.
Two other indices that I regularly monitor include the Chicago Fed National Financial Conditions Index (NFCI) as well as the Chicago Fed Adjusted National Financial Conditions Index (ANFCI).
Here are summary descriptions of each, as seen in FRED:
The National Financial Conditions Index (NFCI) measures risk, liquidity and leverage in money markets and debt and equity markets as well as in the traditional and “shadow” banking systems. Positive values of the NFCI indicate financial conditions that are tighter than average, while negative values indicate financial conditions that are looser than average.
The adjusted NFCI (ANFCI). This index isolates a component of financial conditions uncorrelated with economic conditions to provide an update on how financial conditions compare with current economic conditions.
For further information, please visit the Federal Reserve Bank of Chicago’s web site:
Below are the most recently updated charts of the NFCI and ANFCI, respectively.
The NFCI chart below was last updated on February 26, 2020 incorporating data from January 8, 1971 through February 21, 2020, on a weekly basis.  The February 21 value is -.84:
NFCI
Data Source: FRED, Federal Reserve Economic Data, Federal Reserve Bank of St. Louis; accessed February 26, 2020: 
http://research.stlouisfed.org/fred2/series/NFCI
The ANFCI chart below was last updated on February 26, 2020 incorporating data from January 8, 1971 through February 21, 2020, on a weekly basis.  The February 21 value is -.73:
ANFCI
Data Source: FRED, Federal Reserve Economic Data, Federal Reserve Bank of St. Louis; accessed February 26, 2020: 
http://research.stlouisfed.org/fred2/series/ANFCI
_________
I post various indicators and indices because I believe they should be carefully monitored.  However, as those familiar with this site are aware, I do not necessarily agree with what they depict or imply.
_____
The Special Note summarizes my overall thoughts about our economic situation
SPX at 3128.21 as this post is written

Monday, February 24, 2020

Discussion Concerning The Stock Market Bubble And Characteristics

My latest writing concerning the U.S. stock market as being an exceedingly large asset bubble can be found on “The Immense Stock Market Bubble And Future Economic Consequences” page.
The existence and future consequences of a bubble of this size are highly noteworthy and vastly problematical. The effects this asset bubble has had – and will have – on the American economic future is rather profound.
_____
The Special Note summarizes my overall thoughts about our economic situation
SPX at 3225.89 as this post is written

Updates Of Economic Indicators February 2020

The following is an update of various indicators that are supposed to predict and/or depict economic activity. These indicators have been discussed in previous blog posts:
The February 2020 Chicago Fed National Activity Index (CFNAI) updated as of February 24, 2020:
The CFNAI, with current reading of -.25:

CFNAI

source:  Federal Reserve Bank of Chicago, Chicago Fed National Activity Index [CFNAI], retrieved from FRED, Federal Reserve Bank of St. Louis, February 24, 2020;
https://fred.stlouisfed.org/series/CFNAI
The CFNAI-MA3, with current reading of -.09:

CFNAIMA3

source:  Federal Reserve Bank of Chicago, Chicago Fed National Activity Index: Three Month Moving Average [CFNAIMA3], retrieved from FRED, Federal Reserve Bank of St. Louis, February 24, 2020;
https://fred.stlouisfed.org/series/CFNAIMA3
As of February 21, 2020 (incorporating data through February 14, 2020) the WLI was at 147.7 and the WLI, Gr. was at 3.8%.
A chart of the WLI,Gr., from the Doug Short site’s ECRI update post of February 21, 2020:

ECRI WLI,Gr. chart

Below is the latest chart, depicting the ADS Index from December 31, 2007 through February 15, 2020:

ADS Index

The Conference Board Leading (LEI), Coincident (CEI) Economic Indexes, and Lagging Economic Indicator (LAG):
As per the February 20, 2020 Conference Board press release, titled “The Conference Board Leading Economic Index (LEI) for the U.S. Increased in January” the LEI was at 112.1, the CEI was at 107.3, and the LAG was 108.7 in January.
An excerpt from the release:
“The strong pickup in the January US LEI was driven by a sharp drop in initial unemployment insurance claims, increasing housing permits, consumers’ outlook on the economy and financial indicators,” said Ataman Ozyildirim, Senior Director of Economic Research at The Conference Board. “The LEI’s six-month growth rate has returned to positive territory, suggesting that the current economic expansion – at about 2 percent – will continue through early 2020. While weakness in manufacturing appears to show signs of softening, the COVID-19 outbreak may impact manufacturing supply chains in the US in the coming months.”
Here is a chart of the LEI from the Doug Short site Conference Board Leading Economic Index update of February 20, 2020:

Conference Board Leading Economic Index

_________
I post various indicators and indices because I believe they should be carefully monitored.  However, as those familiar with this site are aware, I do not necessarily agree with what they depict or imply.
_____
The Special Note summarizes my overall thoughts about our economic situation
SPX at 3234.52 as this post is written

The U.S. Economic Situation – February 24, 2020 Update

Perhaps the main reason that I write of our economic situation is that I continue to believe, based upon various analyses, that our economic situation is in many ways misunderstood.  While no one likes to contemplate a future rife with economic adversity, current and future economic problems must be properly recognized and rectified if high-quality, sustainable long-term economic vitality is to be realized.
There are an array of indications and other “warning signs” – many readily apparent – that current economic activity and financial market performance is accompanied by exceedingly perilous dynamics.
I have written extensively about this peril, including in the following:
Building Financial Danger” (ongoing updates)
My analyses continues to indicate that the growing level of financial danger will lead to the next stock market crash that will also involve (as seen in 2008) various other markets as well.  Key attributes of this next crash is its outsized magnitude (when viewed from an ultra-long term historical perspective) and the resulting economic impact.  This next financial crash is of tremendous concern, as my analyses indicate it will lead to a Super Depression – i.e. an economy characterized by deeply embedded, highly complex, and difficult-to-solve problems.
For long-term reference purposes, here is a chart of the Dow Jones Industrial Average since 1900, depicted on a monthly basis using a LOG scale (updated through February 21, 2020, with a last value of 28992.41):
(click on chart to enlarge image)(chart courtesy of StockCharts.com)
DJIA Since 1900
_____
The Special Note summarizes my overall thoughts about our economic situation
SPX at 3337.75 as this post is written

Friday, February 21, 2020

Money Supply Charts Through January 2020

For reference purposes, below are two sets of charts depicting growth in the money supply.
The first shows the MZM (Money Zero Maturity), defined in FRED as the following:
M2 less small-denomination time deposits plus institutional money funds.
Money Zero Maturity is calculated by the Federal Reserve Bank of St. Louis.
Here is the “MZM Money Stock” (seasonally adjusted) chart, updated on February 20, 2020 depicting data through January 2020, with a value of $17,122.5 Billion:
MZMSL
Here is the “MZM Money Stock” chart on a “Percent Change From Year Ago” basis, with a current value of 8.6%:
MZMSL Percent Change From Year Ago
Data Source: FRED, Federal Reserve Economic Data, Federal Reserve Bank of St. Louis; accessed February 21, 2020;
https://research.stlouisfed.org/fred2/series/MZMSL
The second set shows M2, defined in FRED as the following:
M2 includes a broader set of financial assets held principally by households. M2 consists of M1 plus: (1) savings deposits (which include money market deposit accounts, or MMDAs); (2) small-denomination time deposits (time deposits in amounts of less than $100,000); and (3) balances in retail money market mutual funds (MMMFs). Seasonally adjusted M2 is computed by summing savings deposits, small-denomination time deposits, and retail MMMFs, each seasonally adjusted separately, and adding this result to seasonally adjusted M1.
Here is the “M2 Money Stock” (seasonally adjusted) chart, updated on February 20, 2020, depicting data through January 2020, with a value of $15,438.1 Billion:
M2SL
Here is the “M2 Money Stock” chart on a “Percent Change From Year Ago” basis, with a current value of 7.0%:
M2SL Percent Change From Year Ago
Data Source: FRED, Federal Reserve Economic Data, Federal Reserve Bank of St. Louis; accessed February 21, 2020;
https://research.stlouisfed.org/fred2/series/M2SL
_____
The Special Note summarizes my overall thoughts about our economic situation
SPX at 3335.78 as this post is written

Thursday, February 20, 2020

Trends Of S&P500 Earnings Forecasts

S&P500 earnings trends and estimates are a notably important topic, for a variety of reasons, at this point in time.
FactSet publishes a report titled “Earnings Insight” that contains a variety of information including the trends and expectations of S&P500 earnings.
For reference purposes, here are two charts as seen in the “Earnings Insight” report of February 14, 2020:
from page 32:
(click on charts to enlarge images)
S&P500 EPS estimates 2020 & 2021
from page 33:
S&P500 Annual EPS 2010-2021
_____
I post various economic forecasts because I believe they should be carefully monitored.  However, as those familiar with this site are aware, I do not agree with many of the consensus estimates and much of the commentary in these forecast surveys.
_____
The Special Note summarizes my overall thoughts about our economic situation
SPX at 3386.15 as this post is written

Wednesday, February 19, 2020

S&P500 EPS Estimates 2019 Through 2021 And Recent EPS

As many are aware, Refinitiv publishes earnings estimates for the S&P500.  (My other posts concerning S&P earnings estimates can be found under the S&P500 Earnings label)

The following estimates are from Exhibit 24 of the “S&P500 Earnings Scorecard” (pdf) of February 19, 2020, and represent an aggregation of individual S&P500 component “bottom up” analyst forecasts.  For reference, the Year 2014 value is $118.78/share; the Year 2015 value is $117.46; the Year 2016 value is $118.10/share; the Year 2017 value is $132.00/share; and the Year 2018 value is $161.93:
Year 2019 estimate:
$162.83/share
Year 2020 estimate:
$175.91/share
Year 2021 estimate:
$195.70/share
_____
I post various economic forecasts because I believe they should be carefully monitored.  However, as those familiar with this site are aware, I do not agree with many of the consensus estimates and much of the commentary in these forecast surveys.
_____
The Special Note summarizes my overall thoughts about our economic situation
SPX at 3390.15 as this post is written

Standard & Poor’s S&P500 EPS Estimates 2019, 2020, & 2021 – February 14, 2020

As many are aware, Standard & Poor’s publishes earnings estimates for the S&P500.  (My posts concerning their estimates can be found under the S&P500 Earnings label)

For reference purposes, the most current estimates are reflected below, and are as of February 14, 2020:
Year 2019 estimates add to the following:
-From a “bottom up” perspective, operating earnings of $155.78/share
-From a “top down” perspective, operating earnings of N/A
-From a “bottom up” perspective, “as reported” earnings of $138.91/share
Year 2020 estimates add to the following:
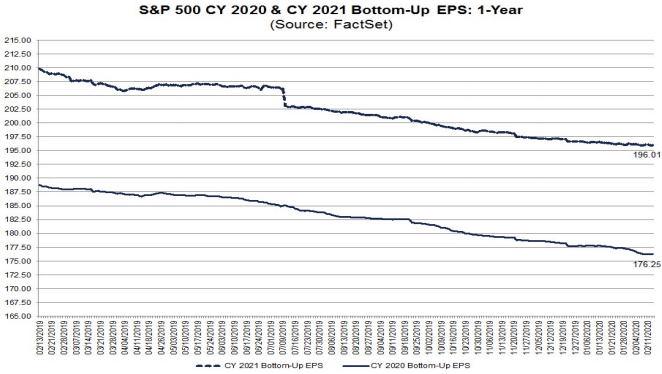
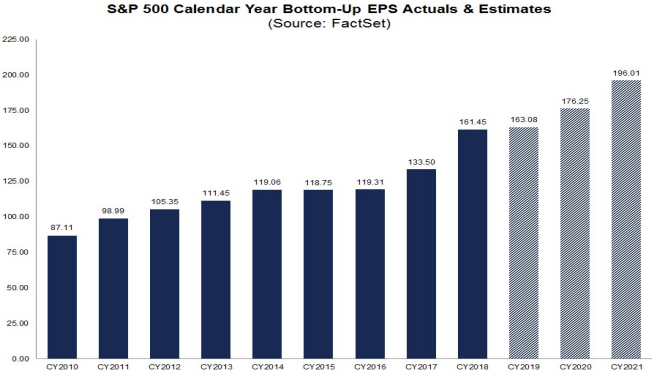
-From a “bottom up” perspective, operating earnings of $173.91/share
-From a “top down” perspective, operating earnings of N/A
-From a “bottom up” perspective, “as reported” earnings of $161.22/share
Year 2021 estimates add to the following:
-From a “bottom up” perspective, operating earnings of $194.65/share
-From a “top down” perspective, operating earnings of N/A
-From a “bottom up” perspective, “as reported” earnings of $176.20/share
_____
I post various economic forecasts because I believe they should be carefully monitored.  However, as those familiar with this site are aware, I do not agree with many of the consensus estimates and much of the commentary in these forecast surveys.
_____
The Special Note summarizes my overall thoughts about our economic situation
SPX at 3383.25 as this post is written