Asset Bubbles
I have written extensively about the stock market bubble, due to its magnitude, duration, and future financial and economic implications. My analyses (as this is written on February 23, 2020, with the S&P500 at 3337.75) indicate that the stock market bubble is simply enormous in size, by far the largest stock market bubble ever experienced in the United States. It may even be the largest bubble of any type in history. Of note, as I have mentioned frequently, there are many other immensely large asset bubbles currently in existence, perhaps most notably the bond market bubble.
Among the comments I have written about the stock market bubble are those seen in the February 17, 2015 post titled “The Stock Market Bubble – February 2015 Update.”
An excerpt from that post:
One of the problems in identifying an asset bubble is that there is no standard definition of one, and many – if not most – bubbles are identified “after the fact.” As there is no standard definition of an asset bubble, there is no definitive measures to “prove” or “disprove” of one’s existence.However, there are many underlying financial conditions that historically have led to asset bubbles. While the list is extensive, among the more notable conditions are (ultra) easy monetary policy and the accompanying ultra-low interest rate environment, both of which have been extant for a number of years now.
There are various characteristics of asset bubbles. One characteristic is that prices reach extreme levels that are unsustainable, i.e. the prices often fall back dramatically after the bubble “pops.” Another characteristic is that, as the bubble progresses, there are many signs of excessive sentiment or “froth.”
While a thorough discussion of the stock market bubble, its causes, and current and future implications would be extensively lengthy and at times (very) complex, below is discussion of various notable factors, including earnings and valuations; excessive sentiment and froth; and economic consequences arising from asset bubbles.
Earnings And Valuations
There are many ways and methods in determining stock market earnings, commonly denoted in EPS. Various stock market earnings and earnings estimate trends can be found under the posts in the “S&P500 Earnings” label. For reference, FactSet Earnings Insight indicates (as of the February 14, 2020 update) a projected CY2020 S&P500 EPS (Bottom-Up) of $163.08, vs. the actual 2019 EPS of $161.45. As stated in their commentary:
Valuation: The forward 12-month P/E ratio for the S&P 500 is 18.9. This P/E ratio is above the 5-year average (16.7) and above the 10-year average (15.0).
Many other “conventional” P/E ratios generally indicate the same – that the stock market P/E is somewhat high. However, other measures of the P/E ratio indicate a higher valuation from a historical perspective.
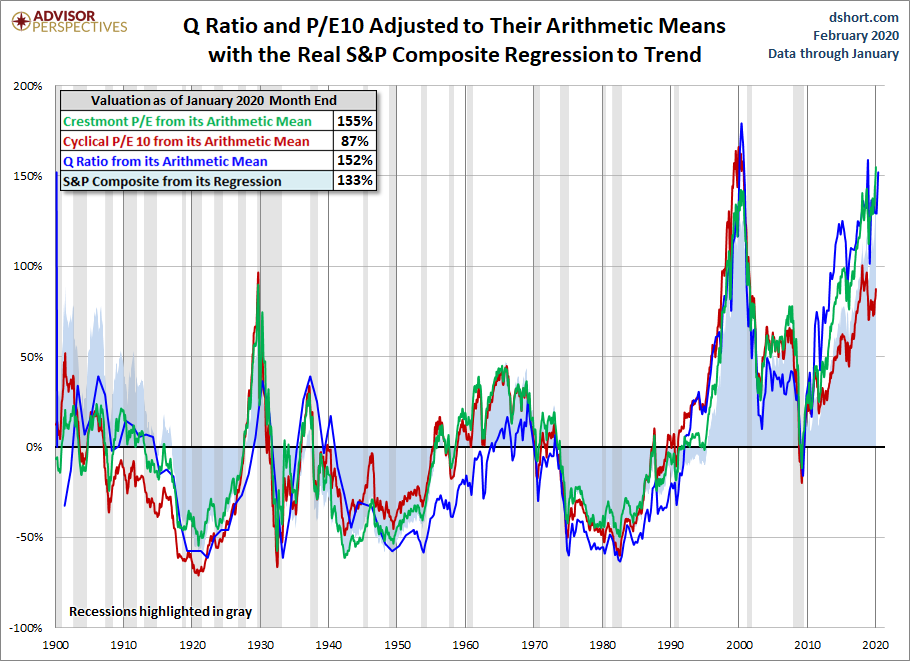
A couple of P/E measures are seen in the Doug Short site’s “Market Remains Overvalued” post of February 6, 2020. A chart from that post:
An issue of paramount importance regarding stock market earnings is to what extent such current-era earnings are being influenced by special factors. I discussed some of these factors in the aforementioned February 17, 2015 post.
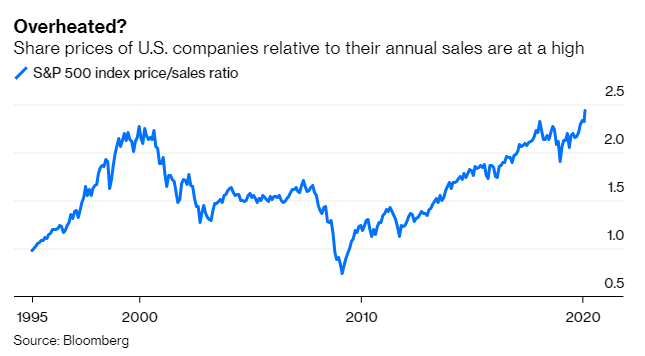
Another measure of valuations is comparing the aggregate market capitalization of the S&P500 to the sales level, commonly referred to as “Price-To-Sales.” Using this measure, one can see a very high “Price-To-Sales Ratio.” A chart of the S&P500 “Price-To-Sales Ratio,” from the Bloomberg article of February 18, 2020 titled “Stock Rally Is Threatened by Two Big Warning Signs“:
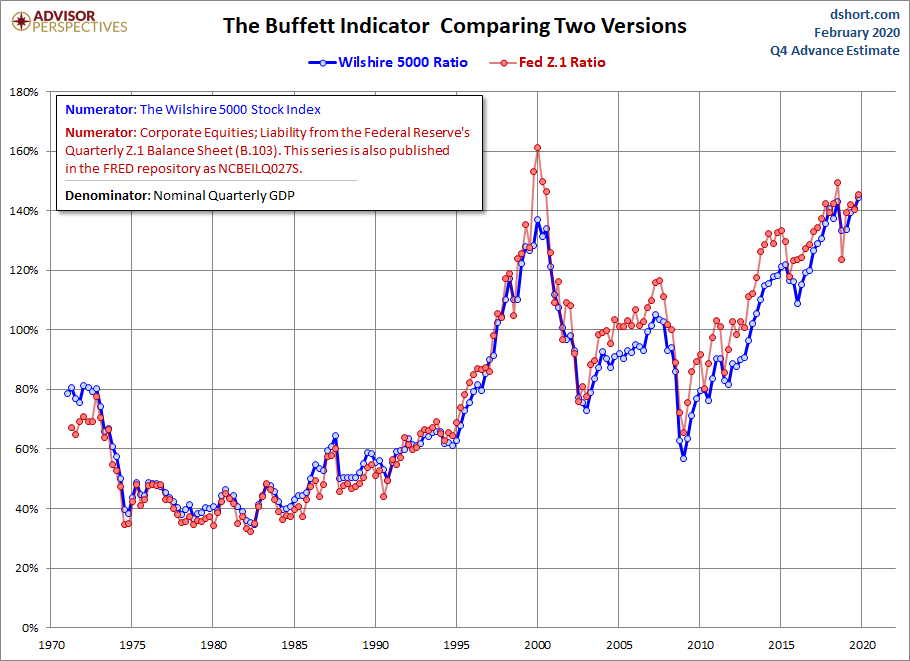
Another measure that indicates a (very) high stock market valuation from a long-term perspective is the Market Capitalization to GDP ratio. A chart of this measure, comparing two readings, from the Dshort site update of February 6, 2020:
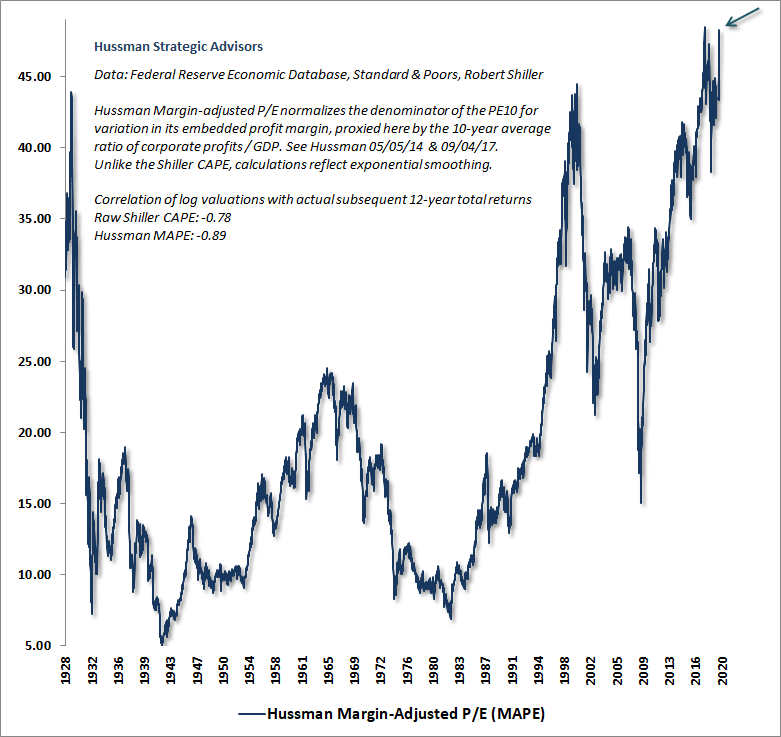
As well, there are other measures showing, from a long-term historical perspective, (very) high levels of current stock market valuation. Another such measure can be seen in the Hussman Market Comment of February 2020, showing the Hussman Margin-Adjusted P/E (MAPE) currently above the peaks of both 1929 and 2000:
Overall, while many valuation measures show the stock market to be (very) overvalued, my analyses indicate that it is even far more overvalued than indicated by the various measures. As such, it is more vulnerable to severe decline than would be reasonably expected.
Excessive Sentiment, Froth And Technical Measures
Asset bubbles often experience excessive sentiment and “froth.” This excessive sentiment and “froth” can occur throughout the duration of the asset bubble; however, it often peaks slightly before the bursting of the bubble. Various technical measures can measure notable and/or abnormal price movements.
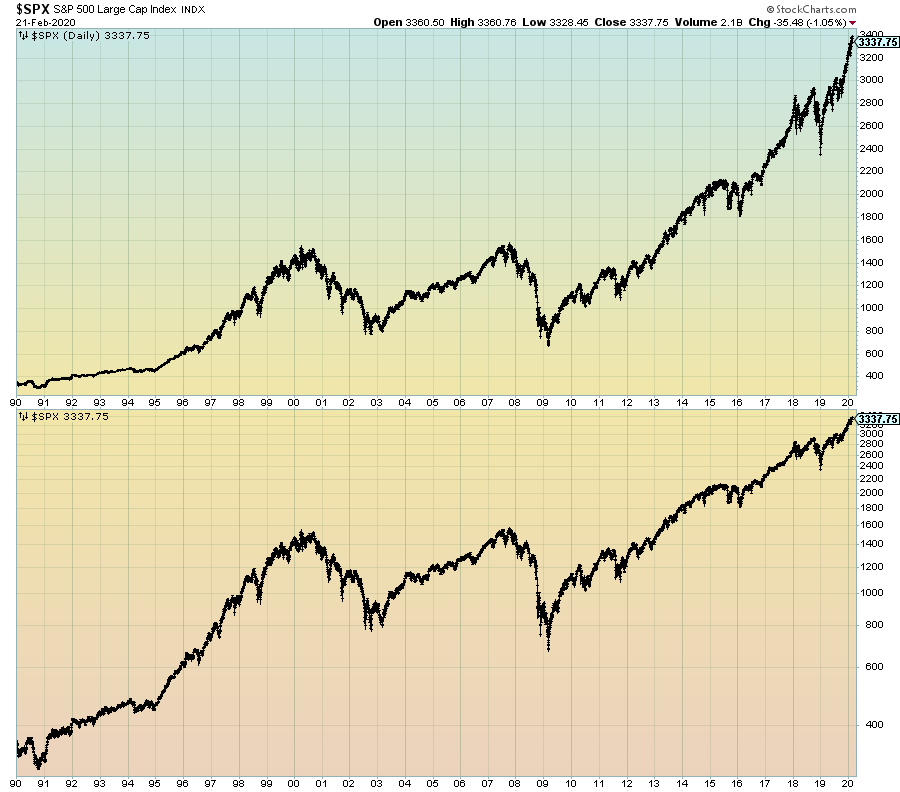
During this current stock market bubble there have been many indications of excessive sentiment. Perhaps the most notable aspect of this excessive sentiment has been the tremendous increase seen in the S&P500 price, especially since October 2019. Shown below is the S&P500 daily chart since 1990, with prices displayed on a linear scale on the top plot and a LOG scale on the bottom plot:
(click on charts to enlarge images)(charts courtesy of StockCharts.com; chart creation and annotation by the author)
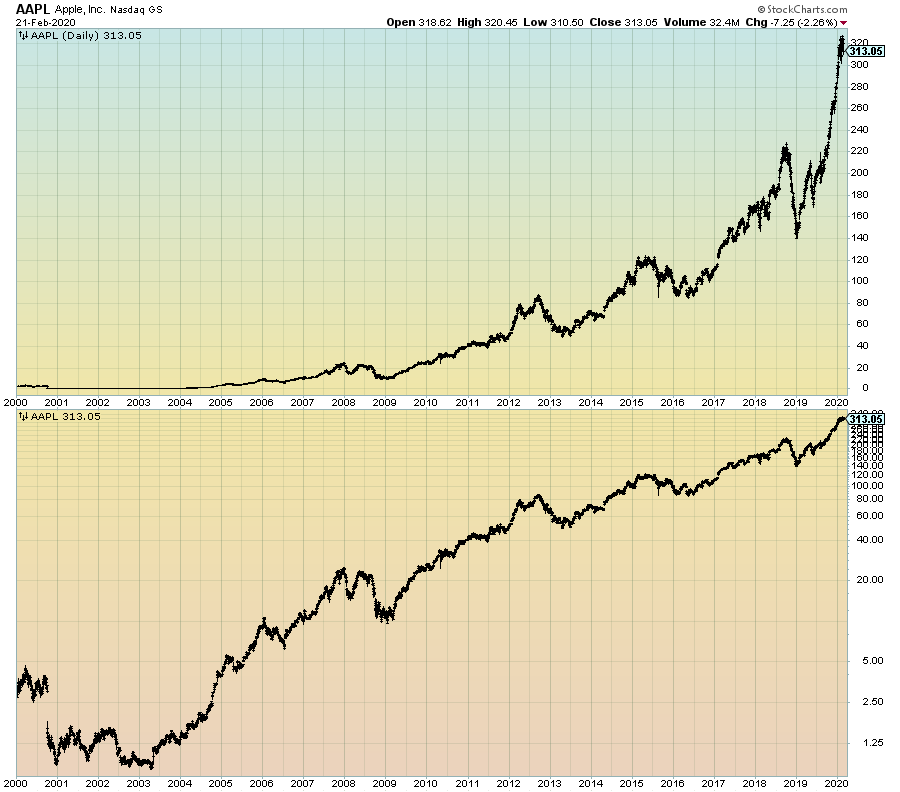
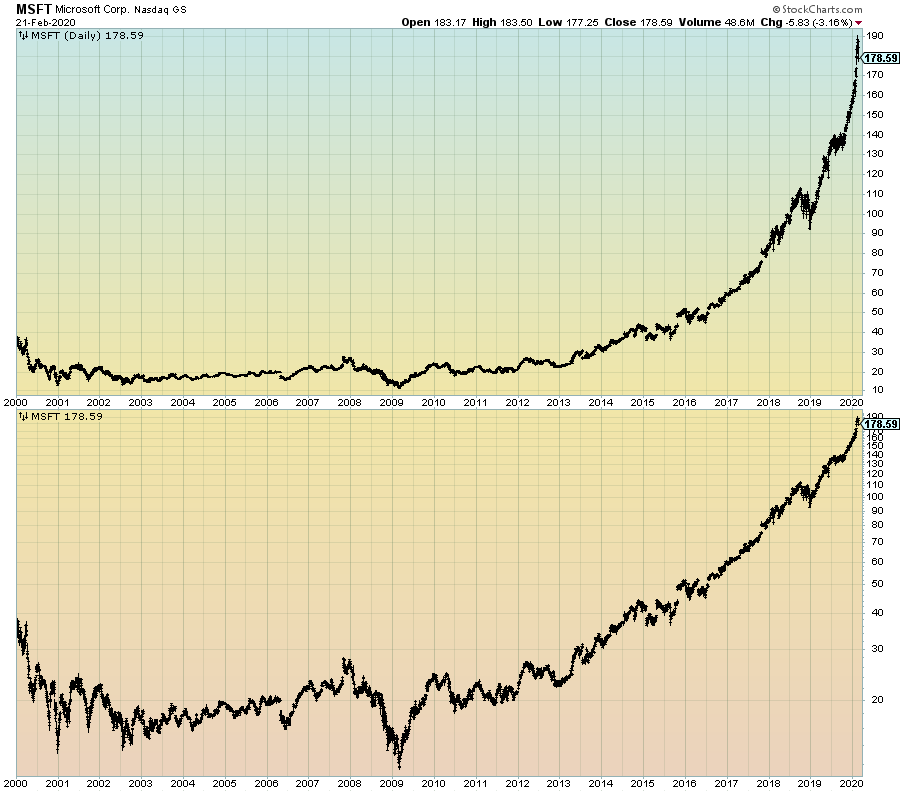
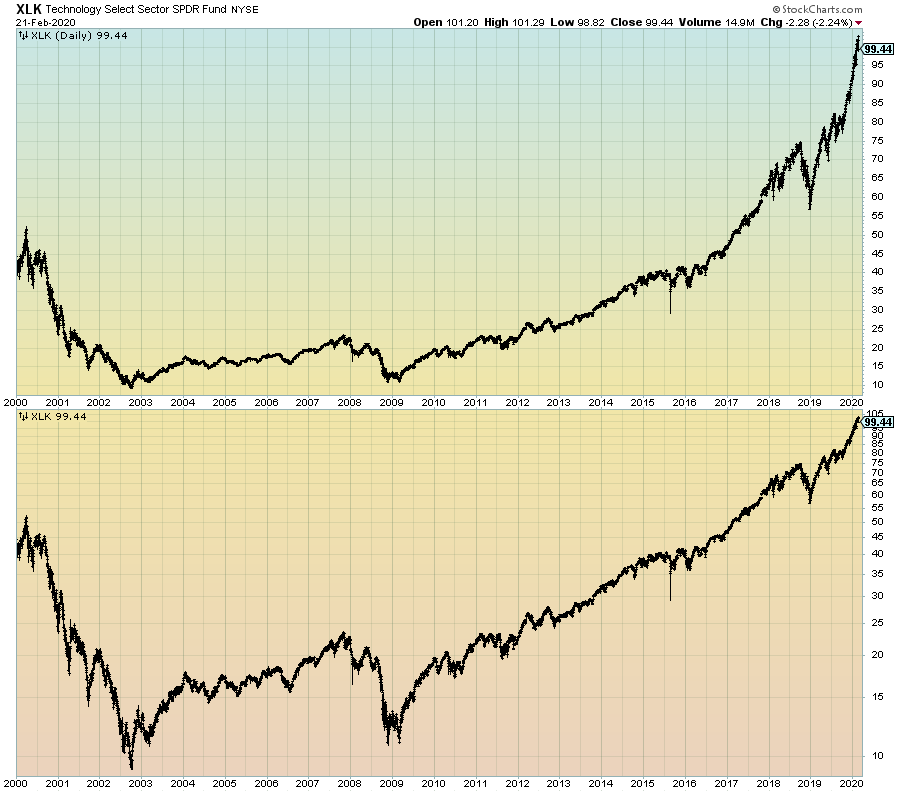
In addition to this rise in the index, there have been many stocks – especially technology stocks – that have experienced tremendous price increases. One can say that many of these stocks have gone “parabolic.” Among those stocks are Apple (AAPL) and Microsoft (MSFT). The same can be said of the XLK (technology) ETF. These charts are seen below, each shown on a linear price scale (top plot) and a LOG scale (bottom plot):
–
–
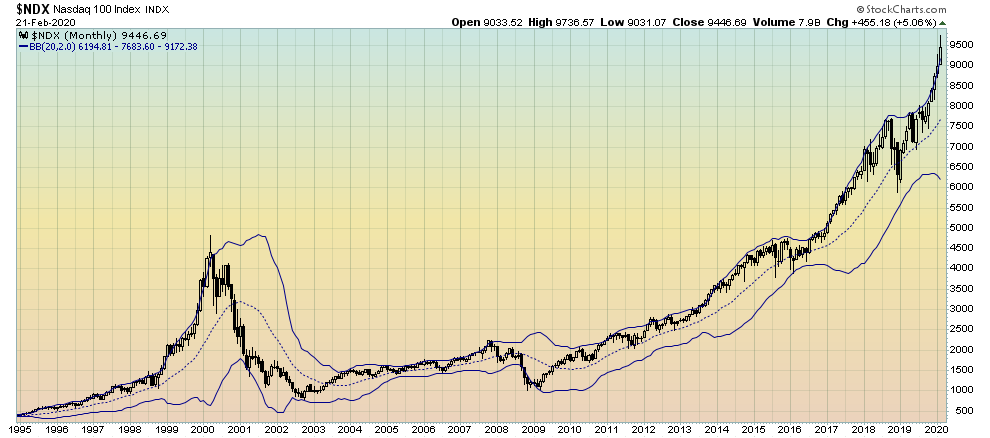
From a technical perspective, many indicators show highly unique readings. Among these are the Bollinger Bands seen in the Nasdaq 100, demonstrating the outsized velocity of recent price increases. As seen in the monthly chart below, the price has been consistently “hugging” and exceeding the upper Bollinger Band since mid-2016, much like it did leading up to 2000:
Aside from price action, there are many sentiment measurements showing distension. Many have been showing extreme (from a long-term historical perspective) readings at various times throughout this stock market bubble. However, the readings have been especially notable in this post-October 2019 period.
Overall, my analyses indicate this stock market bubble has frequently exhibited many “mania”-type characteristics, and as such, from an “all things considered” basis can be classified as such.
Future Economic Consequences
There have been many periods of intense speculative activity and asset bubbles in the United States. Bubbles that have formed in the United States, once they burst, seem to have had various degrees of economic consequences.
For instance, the exceedingly strong bull market in stocks and formation of the “Internet Bubble” in the late ’90s led to the decline in stocks and the decimation of the “Internet Bubble” in the 2001-2003 period. Although a recession occurred in 2001, this recession appeared to be relatively mild and its effects relatively transitory in nature.
The “housing bubble” which peaked around 2006 is widely credited with causing or greatly contributing to the “Financial Crisis” and the accompanying so-called “Great Recession.” [Of note, this Financial Crisis and accompanying recession was not anticipated by the vast majority of economic forecasters and policy makers, as discussed on the “Predictions” page.]
There are many indications that the “Great Recession,” although not necessarily lengthy, inflicted sharp damage. Furthermore, it appears to have changed many aspects of the U.S. economy in a detrimental fashion. Many aspects of this change are still being felt to this day, despite what is officially considered to be the longest economic expansion in U.S. history.
I have written extensively about the damage the “popping” or “bursting” of this current stock market bubble will cause. My analyses indicate that severe economic weakness will accompany the demise of the bubble. There are many reasons for this conclusion. One reason is that due to the exorbitant size of this stock market bubble, any significant, lasting drop in stock prices will result in a decline in many trillions of dollars in assets. Such a large decline in assets, via the (inverse) wealth effect, will have a marked economic impact in spending and confidence. As well, the stock market bubble has had many other notable direct and indirect effects. The demise of the bubble will have many other problematical impacts, including those on cost of capital and capital availability.
Also, as extensively discussed on this site, there are many current signs of economic weakness (weak economic growth or economic contraction) as well as outright (gravely) problematical economic conditions. Given such conditions, any pronounced economic or financial “shock” will have an outsized economic impact given the current economic state.
(posted February 24, 2020)