Friday, July 28, 2023

U.S. Deflation Probability Chart Through July 2023

For reference, below is a chart of the St. Louis Fed Price Pressures Measures – Deflation Probability [FRED STLPPMDEF] through July 2023.

While I do not necessarily agree with the current readings of the measure, I view this as a proxy of U.S. deflation probability.

A description of this measure, as seen in FRED:

This series measures the probability that the personal consumption expenditures price index (PCEPI) inflation rate (12-month changes) over the next 12 months will fall below zero.

The chart, on a monthly basis from January 1990 – July 2023, with a last reading of .00052, last updated on July 28, 2023:

Deflation Probability

Here is this same U.S. deflation probability measure since 2008:

Deflation Probability

source:  Federal Reserve Bank of St. Louis, Deflation Probability [STLPPMDEF], retrieved from FRED, Federal Reserve Bank of St. Louis; accessed July 28, 2023: https://fred.stlouisfed.org/series/STLPPMDEF

_________

I post various economic indicators and indices because I believe they should be carefully monitored.  However, as those familiar with this site are aware, I do not necessarily agree with what they depict or imply.

_____

The Special Note summarizes my overall thoughts about our economic situation

SPX at 4569.88 as this post is written

Durable Goods New Orders – Long-Term Charts Through June 2023

Many people place emphasis on Durable Goods New Orders as a prominent economic indicator and/or leading economic indicator.

For reference, below are two charts depicting this measure.

First, from the St. Louis Fed site (FRED), a chart through June 2023, updated on July 27, 2023. This value is $302,489 ($ Millions):

(click on charts to enlarge images)

DGORDER

Second, here is the chart depicting this measure on a “Percent Change from a Year Ago” basis, with a last value of 8.9%:

DGORDER Percent Change From Year Ago

Data Source: FRED, Federal Reserve Economic Data, Federal Reserve Bank of St. Louis: Manufacturers’ New Orders:  Durable Goods [DGORDER]; U.S. Department of Commerce: Census Bureau; accessed July 27, 2023; 
http://research.stlouisfed.org/fred2/series/DGORDER

_________

I post various indicators and indices because I believe they should be carefully monitored.  However, as those familiar with this site are aware, I do not necessarily agree with what they depict or imply.

_____

The Special Note summarizes my overall thoughts about our economic situation

SPX at 4585.15 as this post is written

Consumer Confidence Surveys – As Of July 28, 2023

Advisor Perspectives had a post of July 28, 2023 (“Michigan Consumer Sentiment Soars to Highest Level Since October 2021“) that displays the latest Conference Board Consumer Confidence and University of Michigan Consumer Sentiment Index charts.  They are presented below:

(click on charts to enlarge images)

Conference Board Consumer Confidence 117.0

University of Michigan Consumer Sentiment Index 71.6

While I don’t believe that confidence surveys should be overemphasized, I find these readings and trends to be notable, especially in light of a variety of other highly disconcerting measures highlighted throughout this site.

_____

The Special Note summarizes my overall thoughts about our economic situation

SPX at 4587.92 as this post is written

Employment Cost Index (ECI) – June 2023

While the concept of Americans’ incomes can be defined in a number of ways, many prominent measures continue to show disconcerting trends.

One prominent measure is the Employment Cost Index (ECI).

Here is a description from the BLS document titled “The Employment Cost Index:  what is it?“:

The Employment Cost Index (ECI) is a quarterly measure of the change in the price of labor, defined as compensation per employee hour worked. Closely watched by many economists, the ECI is an indicator of cost pressures within companies that could lead to price inflation for finished goods and services. The index measures changes in the cost of compensation not only for wages and salaries, but also for an extensive list of benefits. As a fixed-weight, or Laspeyres, index, the ECI controls for changes occurring over time in the industrial-occupational composition of employment.

On July 28, 2023, the latest ECI report was released.  Here are two excerpts from the BLS release titled “Employment Cost Index – June 2023“:

Compensation costs for civilian workers increased 1.0 percent, seasonally adjusted, for the 3-month period ending in June 2023, the U.S. Bureau of Labor Statistics reported today. Wages and salaries increased 1.0 percent and benefit costs increased 0.9 percent from March 2023. (See tables A, 1, 2, and 3.)

also:

Compensation costs for civilian workers increased 4.5 percent for the 12-month period ending in June 2023 and increased 5.1 percent in June 2022. Wages and salaries increased 4.6 percent for the 12-month period ending in June 2023 and increased 5.3 percent for the 12-month period ending in June 2022. Benefit costs increased 4.2 percent over the year and increased 4.8 percent for the 12-month period ending in June 2022. (See tables A, 4, 8, and 12.)

Below are three charts, updated on July 28, 2023 that depict various aspects of the ECI, which is seasonally adjusted (SA):

The first depicts the ECI, with a value of 159.0:

ECI 159.0

source: US. Bureau of Labor Statistics, Employment Cost Index: Total compensation: All Civilian [ECIALLCIV], retrieved from FRED, Federal Reserve Bank of St. Louis, accessed July 28, 2023: 
https://research.stlouisfed.org/fred2/series/ECIALLCIV/

The second chart depicts the ECI on a “Percent Change from Year Ago” basis, with a value of 4.5%:

ECIALLCIV 4.5 Percent Change From Year Ago

The third chart depicts the ECI on a “Percent Change” (from last quarter) basis, with a value of 1.0%:

ECIALLCIV 1.0 Percent Change

_________

I post various indicators and indices because I believe they should be carefully monitored.  However, as those familiar with this site are aware, I do not necessarily agree with what they depict or imply.

_____

The Special Note summarizes my overall thoughts about our economic situation

SPX at 4567.28 as this post is written

Another Recession Probability Indicator – Through Q1 2023

Each month I have been highlighting various estimates of U.S. recession probabilities.  The latest update was that of July 10, 2023, titled “Recession Probability Models – July 2023.”

While I don’t agree with the methodologies employed or the probabilities of impending economic weakness as depicted by these and other estimates, I do believe that the results of these models and estimates should be monitored.

Another probability of recession is provided by James Hamilton, and it is titled “GDP-Based Recession Indicator Index.”  A description of this index, as seen in FRED:

This index measures the probability that the U.S. economy was in a recession during the indicated quarter. It is based on a mathematical description of the way that recessions differ from expansions. The index corresponds to the probability (measured in percent) that the underlying true economic regime is one of recession based on the available data. Whereas the NBER business cycle dates are based on a subjective assessment of a variety of indicators that may not be released until several years after the event , this index is entirely mechanical, is based solely on currently available GDP data and is reported every quarter. Due to the possibility of data revisions and the challenges in accurately identifying the business cycle phase, the index is calculated for the quarter just preceding the most recently available GDP numbers. Once the index is calculated for that quarter, it is never subsequently revised. The value at every date was inferred using only data that were available one quarter after that date and as those data were reported at the time.

If the value of the index rises above 67% that is a historically reliable indicator that the economy has entered a recession. Once this threshold has been passed, if it falls below 33% that is a reliable indicator that the recession is over.

Additional reference sources for this index and its construction can be seen in the Econbrowser post of February 14, 2016 titled “Recession probabilities” as well as on the “The Econbrowser Recession Indicator Index” page.

Below is a chart depicting the most recent value of 4.90000% for the first quarter of 2023, last updated on July 27, 2023 (after the July 27, 2023 Gross Domestic Product, Second Quarter 2023 (Advance Estimate)):

GDP-Based Recession Indicator Index

source:  Hamilton, James, GDP-Based Recession Indicator Index [JHGDPBRINDX], retrieved from FRED, Federal Reserve Bank of St. Louis; accessed July 28, 2023: 
https://research.stlouisfed.org/fred2/series/JHGDPBRINDX

_________

I post various indicators and indices because I believe they should be carefully monitored.  However, as those familiar with this site are aware, I do not necessarily agree with what they depict or imply.

_____

The Special Note summarizes my overall thoughts about our economic situation

SPX at 4537.41 as this post is written

Thursday, July 27, 2023

Jerome Powell’s July 26, 2023 Press Conference – Notable Aspects

On Wednesday, July 26, 2023 FOMC Chair Jerome Powell gave his scheduled July 2023 FOMC Press Conference. (link of video and related materials)

Below are Jerome Powell’s comments I found most notable – although I don’t necessarily agree with them – in the order they appear in the transcript.  These comments are excerpted from the “Transcript of Chairman Powell’s Press Conference“ (preliminary)(pdf) of July 26, 2023, with the accompanying “FOMC Statement.”

Excerpts from Chairman Powell’s opening comments:

The Fed’s monetary policy actions are guided by our mandate to promote maximum employment and stable prices for the American people.  My colleagues and I are acutely aware that high inflation imposes significant hardship as it erodes purchasing power, especially for those least able to meet the higher costs of essentials like food, housing, and transportation.  We are highly attentive to the risks that high inflation poses to both sides of our mandate, and we are strongly committed to returning inflation to our 2 percent objective.  

At today’s meeting the Committee raised the target range for the federal funds rate by 1/4 percentage point, bringing the target range to 5-1/4 to 5-1/2 percent.  We are also continuing the process of significantly reducing our securities holdings.

With today’s action, we have raised our policy rate by 5-1/4 percentage points since early last year.  We have been seeing the effects of our policy tightening on demand in the most interest-rate-sensitive sectors of the economy, particularly housing and investment.  It will take time, however, for the full effects of our ongoing monetary restraint to be realized, especially on inflation.  In addition, the economy is facing headwinds from tighter credit conditions for households and businesses, which are likely to weigh on economic activity, hiring, and inflation.  

Excerpts of Jerome Powell’s responses as indicated to various questions:

JEANNA SMIALEK.  Thank you. Thanks for taking our questions, Chair Powell. Obviously, you updated the language around growth in the statement today, you know, we’ve seen the Barbie movie numbers, we’ve seen everyone going to Taylor Swift concerts this summer. It seems like the American consumers are in pretty good shape and it does seem like growth is sort of picking back up a little bit, or at least doing well. And I wonder from your perspective if that continues, if we see growth not just stabilizing but doing, you know, performing well this summer, is that a problem because it’s inflationary or is it good news because it suggests that a soft landing is more likely? Just how are you thinking about that sort of trajectory? 

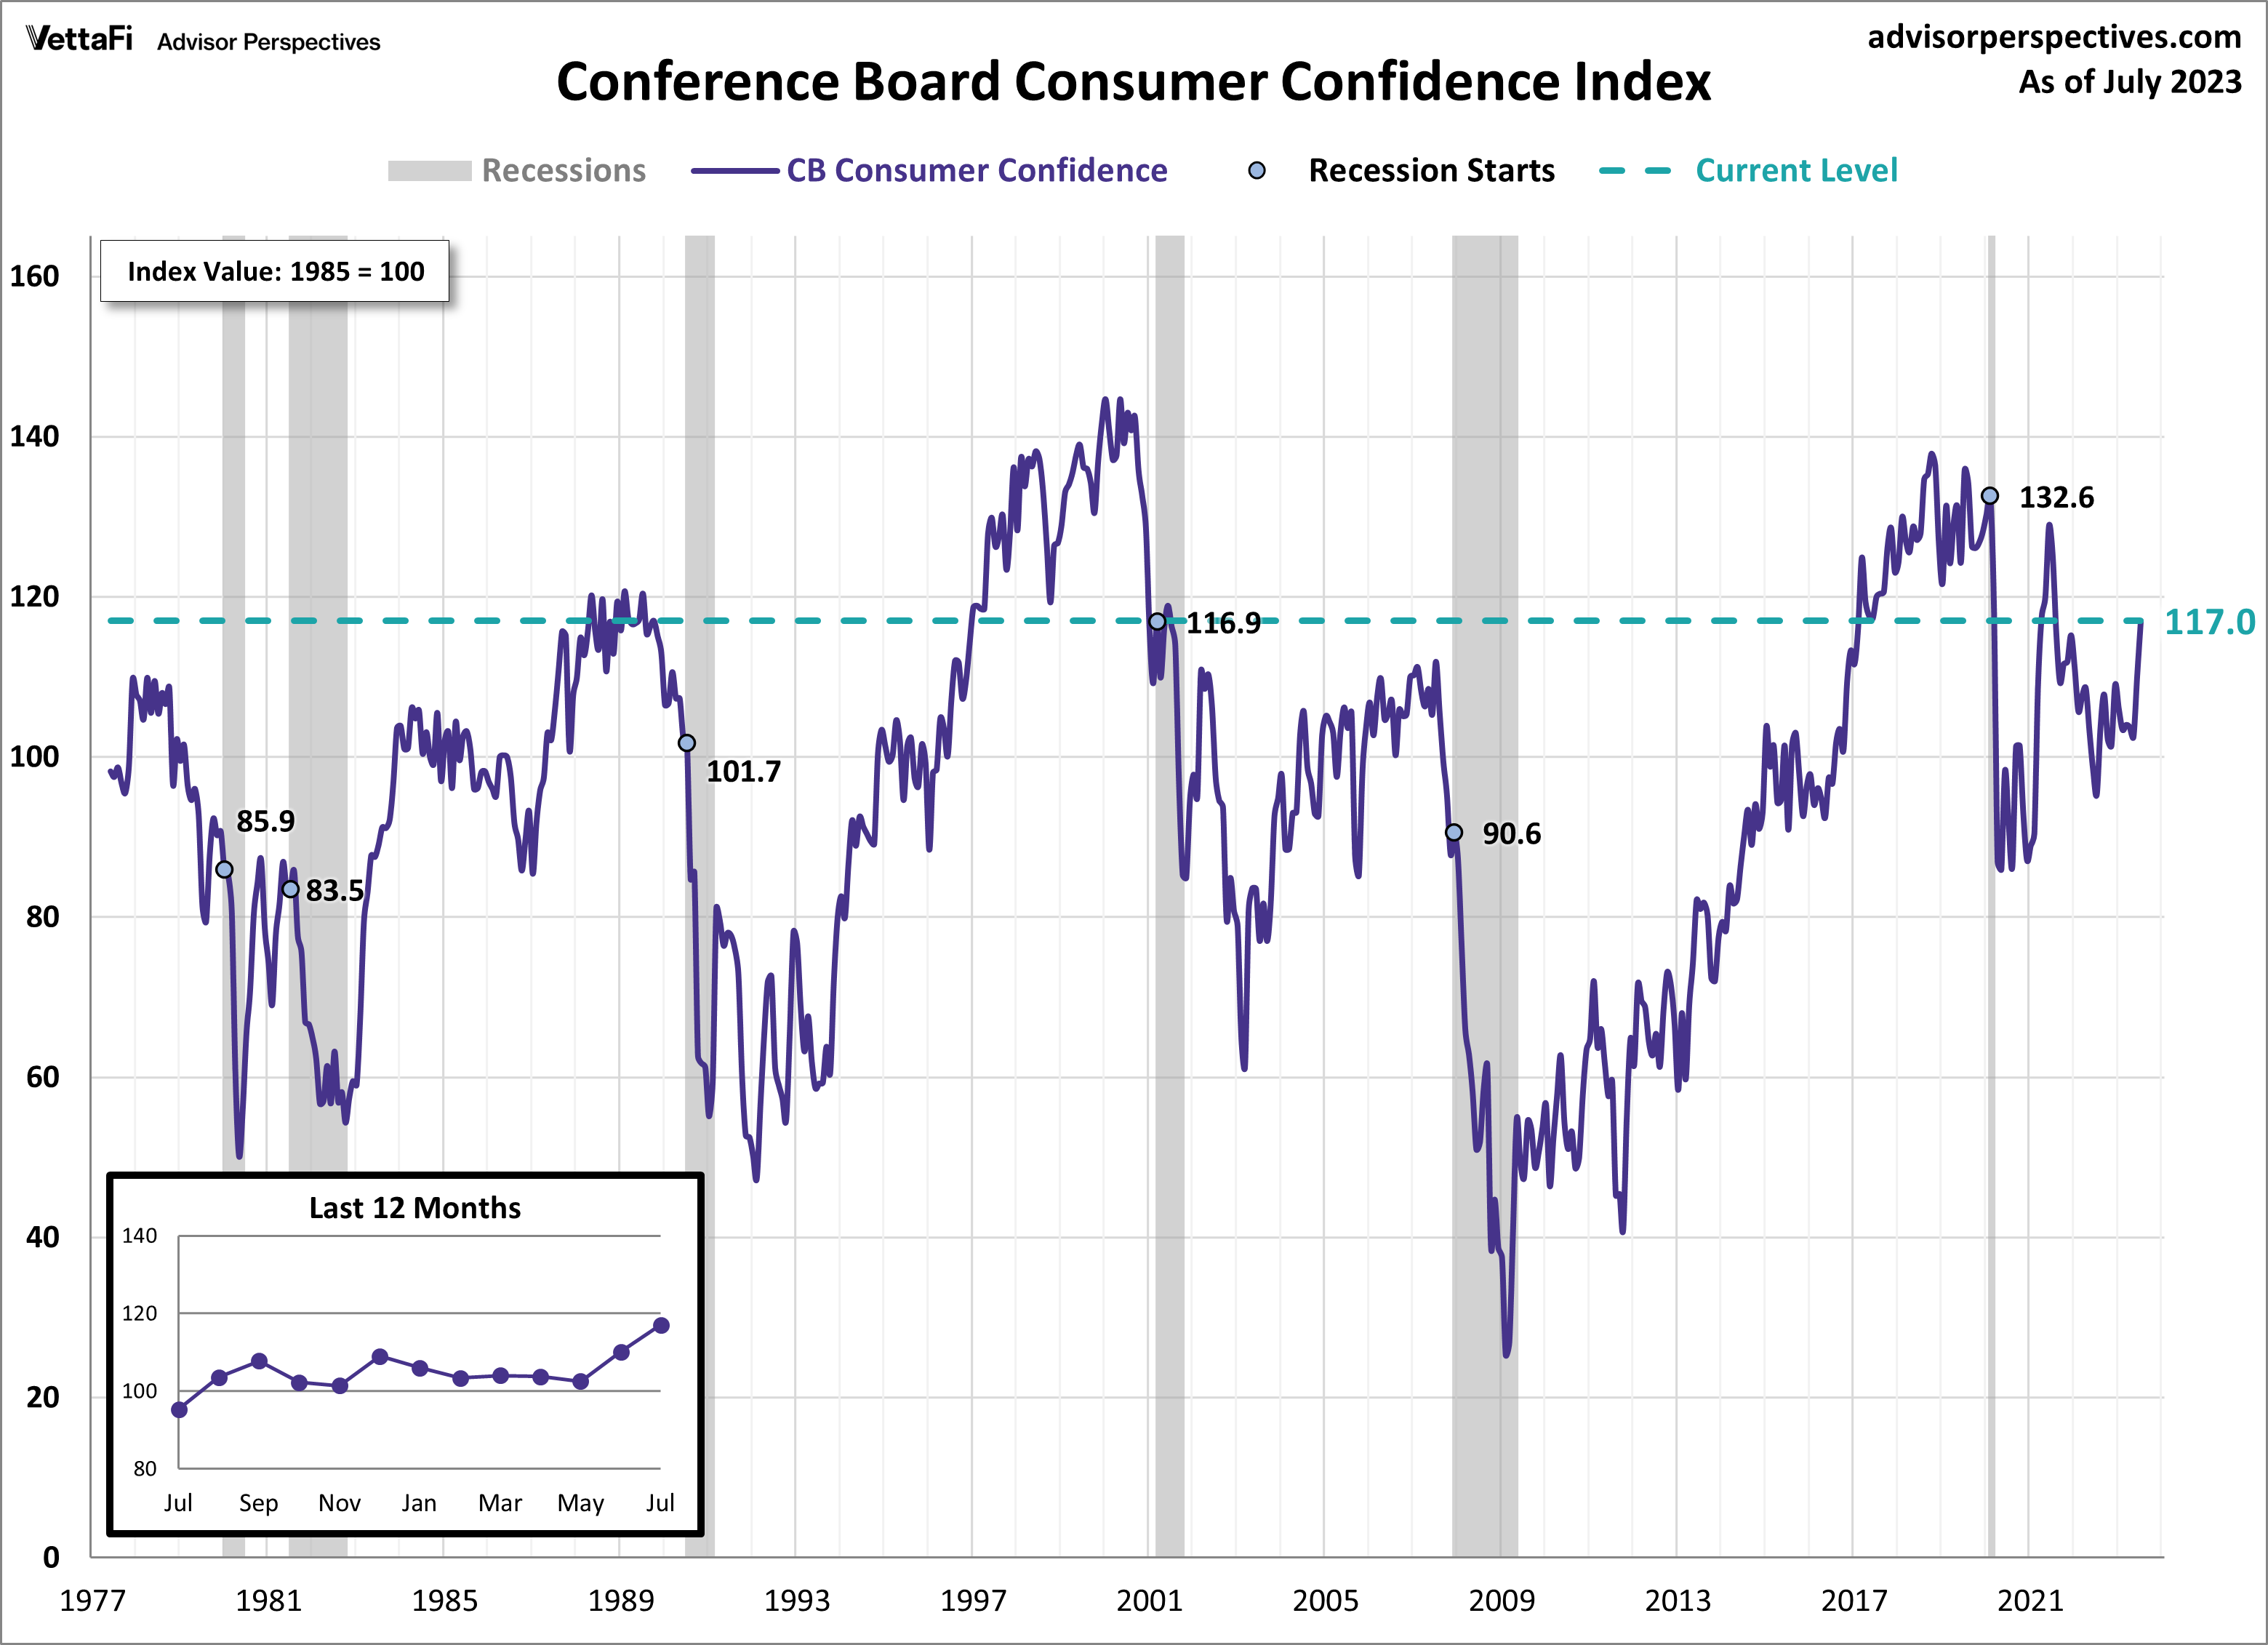
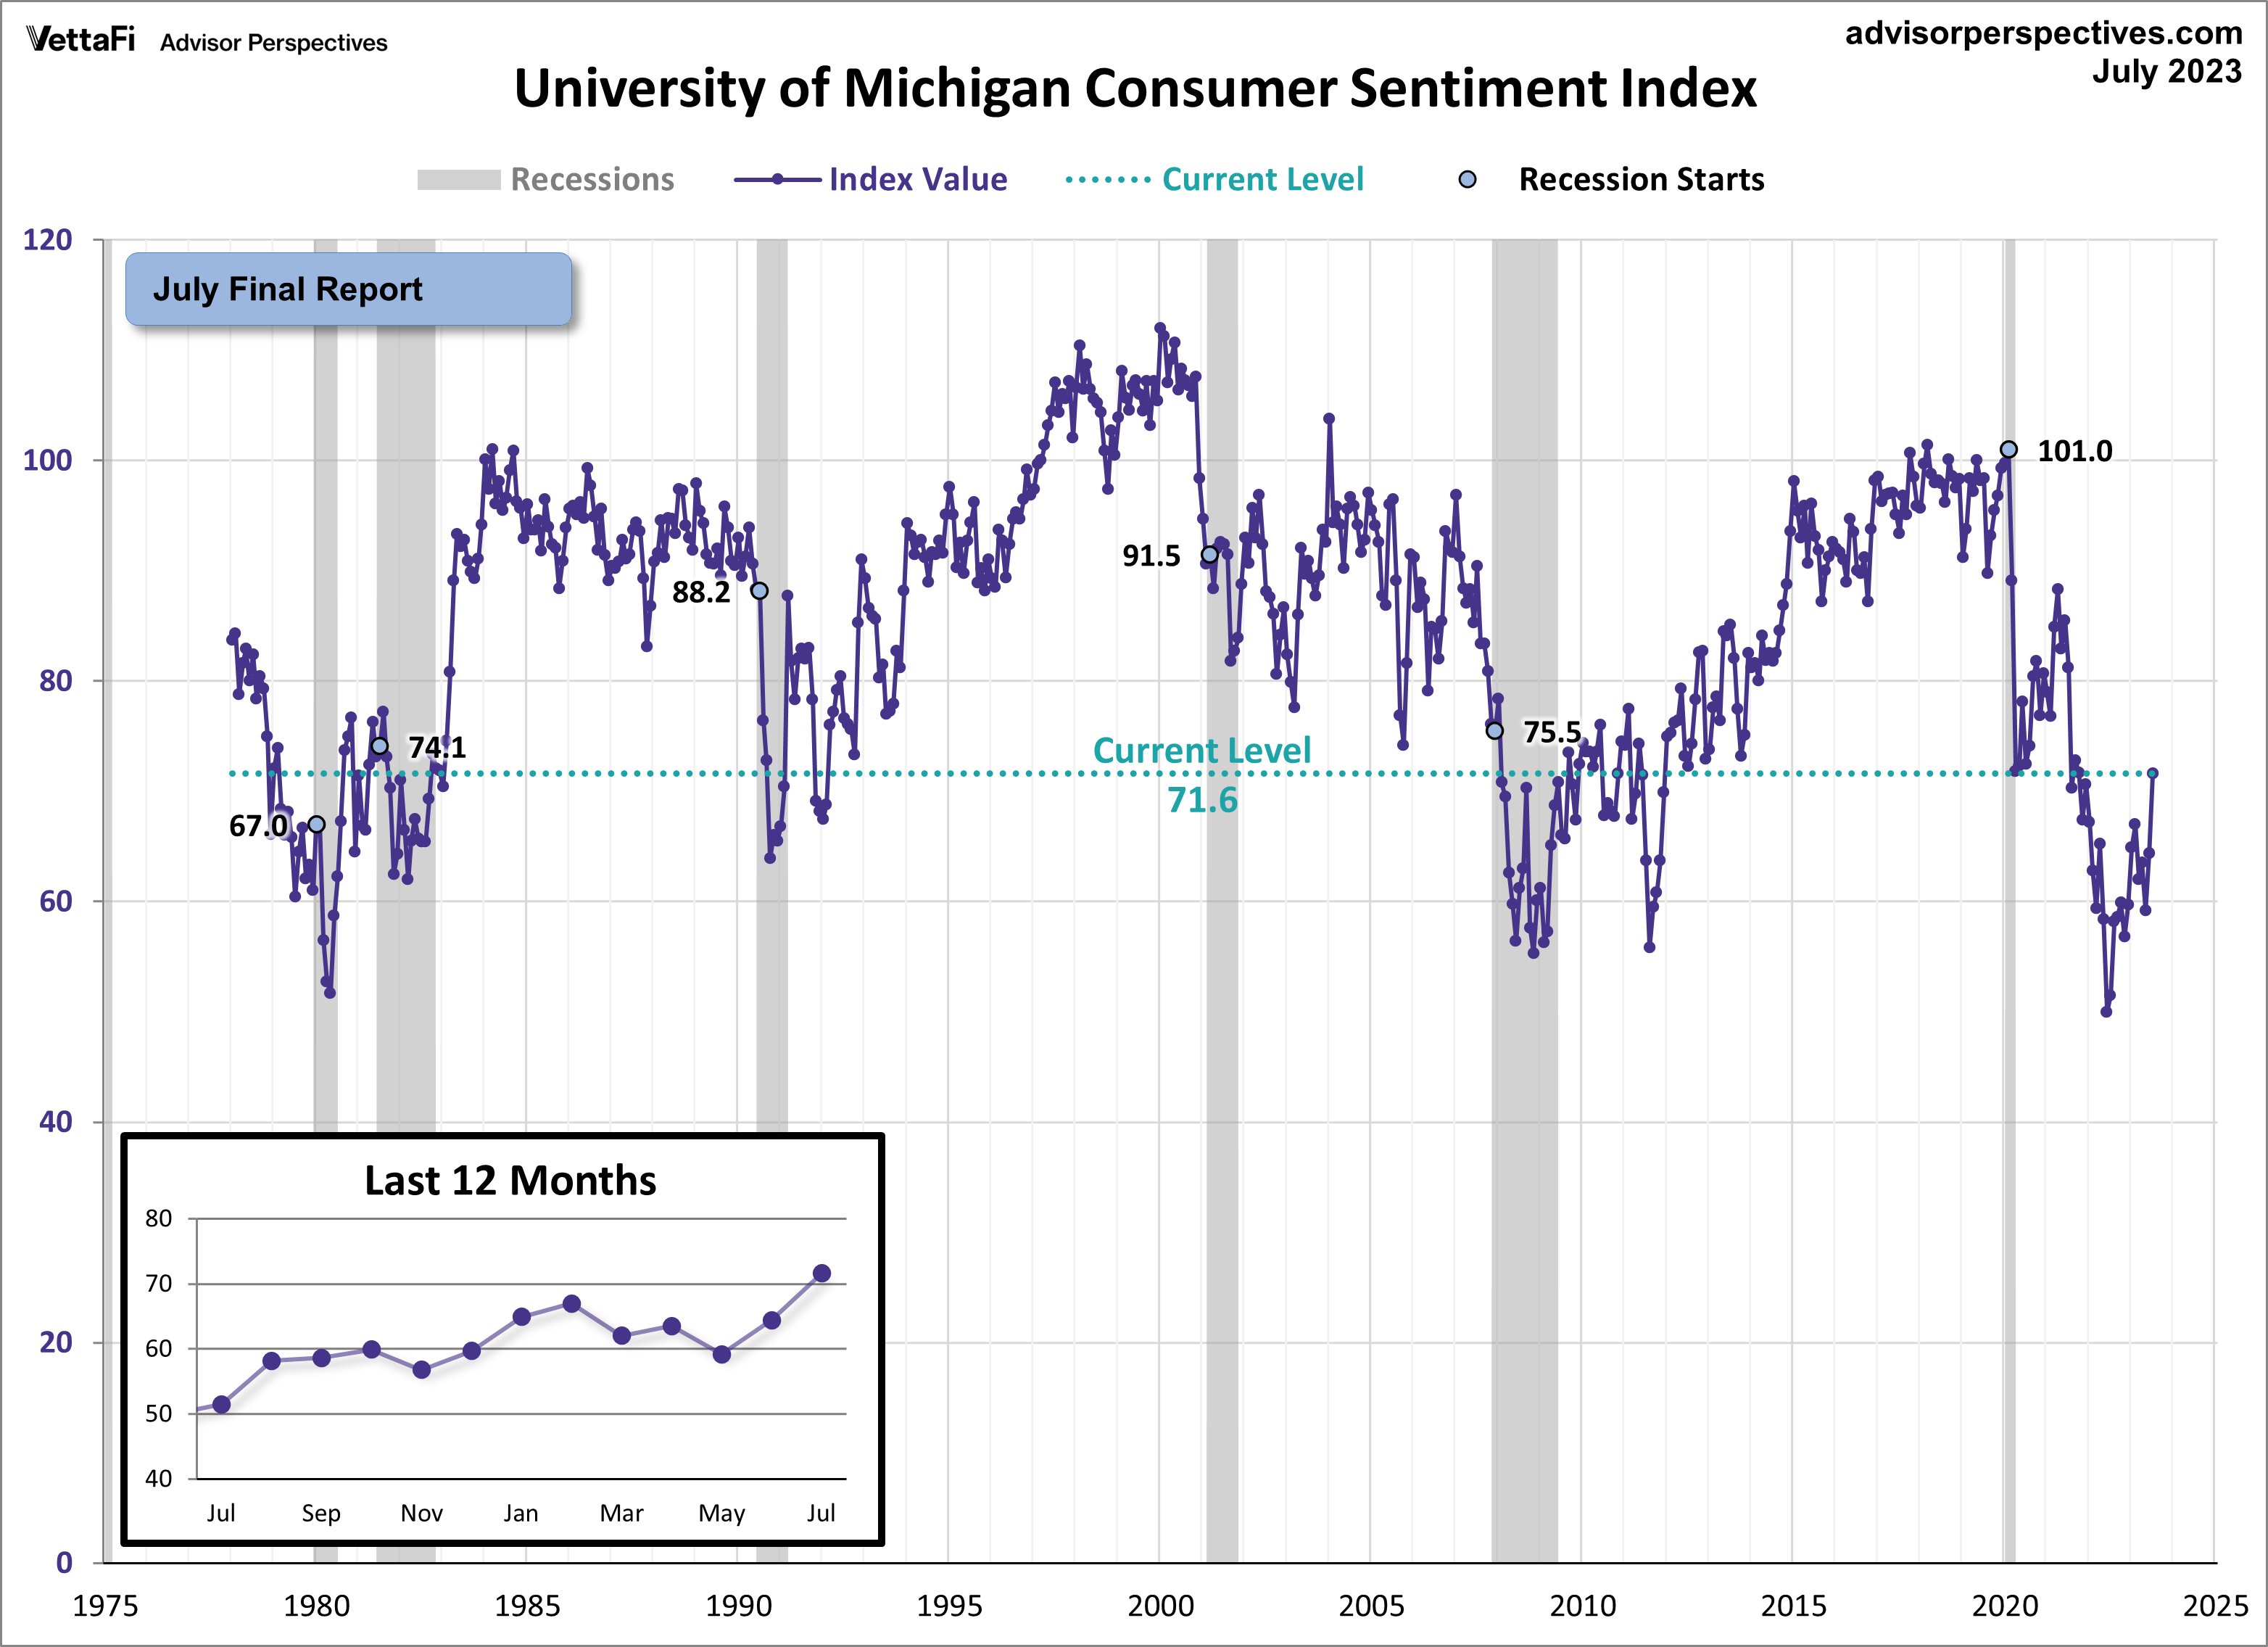
CHAIR POWELL.  Yeah, so I would say it this way; the overall resilience of the economy, the fact that we’ve been able to achieve disinflation so far without any meaningful negative impact on the labor market, the strength of the economy overall, that’s a good thing. It’s good to see that, of course. It’s also you see consumer confidence coming up and things like that, that will support activity going forward. But you’re right though, at the margin, stronger growth could lead, over time, to higher inflation and that would require an appropriate response for monetary policy. So we’ll be watching that carefully and seeing how it evolves over time. 

also:

MICHAEL MCKEE.  At this point you say the policy is restrictive but all year long we have seen growth surprise to the upside, unemployment to the downside, and inflation lately, to the downside. So I’m wondering by definition, should you be restrictive enough right now under these conditions, do you think you might need to do more because I’m curious about what you see as inflation dynamics now. Is the economy still moving in a direction where it creates more inflation? People talk about base effects and higher energy costs, and now we have some large labor settlements. Or, is the economy disinflating and you’re just, you’re able to go back to the old Fed policy of opportunistic disinflation? 

CHAIR POWELL.  So, I’ll just say again, the broader picture of what we want to see is we want to see easing of supply constraints and normalization of pandemic related distortions to demand and supply, we want to see economic growth running at moderate or modest levels to help ease inflationary pressures, we want to see continued restoration of supply and demand balance, particularly in the labor market, and all of that should lead to declining inflationary pressures. What we see is we see those pieces of the puzzle coming together and we’re seeing evidence of those things now, but I would say that what our eyes are telling us is that policy has not been restrictive enough for long enough to have its full desired effects. So we intend, again, to keep policy restrictive until we’re confident that inflation is coming down sustainably to our 2 percent target, and we’re prepared to further tighten if that is appropriate. And we think the process, you know, still probably has a long way to go. 

MICHAEL MCKEE.  Well do you think under current conditions you are restrictive enough unless something changes? 

CHAIR POWELL.  Well, I think, we think you know, today’s rate hike was appropriate and I think we’re going to be looking at the incoming data to inform our decision at the next meeting about is the incoming data telling us that we need to do more and if it does tell us that, collectively if that’s our view, then we will do more. 

also:

HOWARD SCHNEIDER. Thanks. Howard Schneider with Reuters. So, among your colleagues, there have been people who have said they feel that very little transmission has taken place so far from monetary policy into the economy and there are those who feel, they say, it’s happened very fast this time and it’s kind of up to date. Where are you on that continuum? 

CHAIR POWELL.  So, there’s a long running debate about the lags between changes in financial conditions and the response to those changes from economic activity and inflation, right? So we know that in the modern era, financial conditions move the anticipation of our decisions and that has clearly been the case in this cycle. So in a sense, the clock starts earlier than it used to. But that doesn’t necessarily change the process and from that point on and it’s not clear that it has. We also, this is– I’ll tell you what we know and then what we don’t know. We know that financial conditions affect economic activity and inflation with a lag that can be long and variable, or lags plural, that can be long and variable. A lot of uncertainty around the length of the lags and by the way, that’s just one component of the broader uncertainty that we face. So, I’ll tell you how I think about this, first, the first thing to say is, we’re determined to bring inflation down to 2 percent over time and we will use our tools to do that, no one should doubt that. I would look at it this way though, the real federal funds rate is now in meaningfully positive territory. If you take the nominal federal funds rate, subtract the mainstream estimate of near term inflation expectations, you get a real federal funds rate that is well above most estimates of the longer term neutral rate. So I would say monetary policy is restrictive, more so after today’s decision, meaning that it is putting downward pressure on economic activity and inflation. We’ll keep monetary policy restricted until we think it’s not appropriate to do so. So that’s how I think about it. I mean if I sum it up, I would say; we’ve come a long way, we are resolutely committed to returning inflation to our 2 percent goal over time. Inflation has proved, repeatedly has proved stronger than we and other forecasters have expected and at some point that may change. We have to be ready to follow the data and given how far we’ve come, we can afford to be a little patient as well as resolute as we let this unfold. 

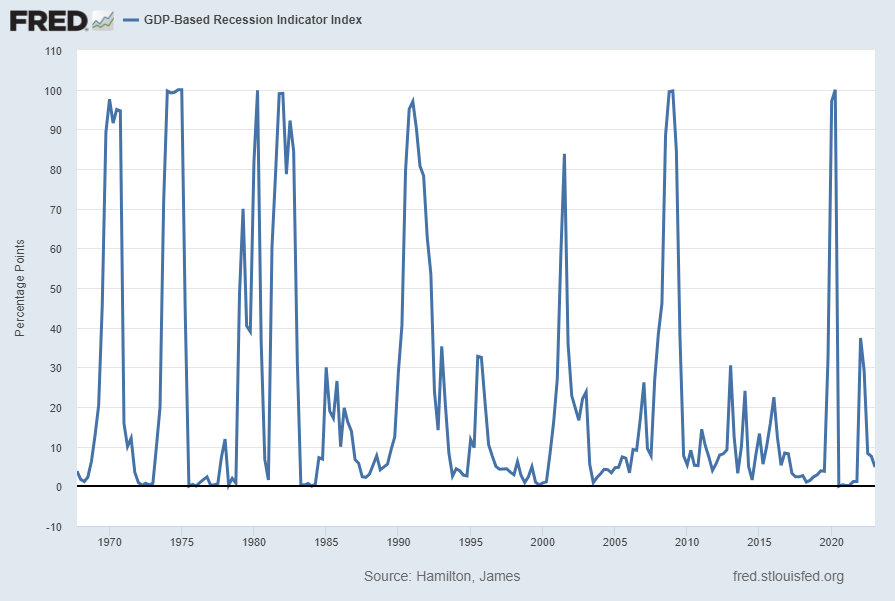
HOWARD SCHNEIDER.  On the credit side, I’m wondering if you saw anything in the latest SLOOS data that made you think you’re getting a quantum of credit contraction beyond what you’d expect? The bank lending data really is, the growth rate’s edging down towards below, heading below zero, which is usually you know, a recession indicator. 

CHAIR POWELL.  So I guess the SLOOS will come our early next week and I would just say it’s broadly consistent with what you would expect. You’ve got lending conditions tight and getting a little tighter, you’ve got weak demand, and you know, it gives a picture of a pretty tight credit conditions in the economy. I think it’s really hard to tease out whether how much of that is from this source or that source, but I think what matters is the overall picture is of tight and tightening lending conditions. And that’s what the SLOOS will say. 

also:

JENNIFER SCHONBERGER. Thank you Chair Powell, Jennifer Schonberger with Yahoo Finance. It’s been over four months since a handful of regional banks, including Silicon Valley Bank, failed. When you look at credit conditions now, given Bank of California’s acquisition of PacWest, does this acquisition suggest the full impact has not been felt or are you comfortable saying that we’ve seen most of the ripple effects that may have occurred at this point and how does this play into your outlook for policy? 

CHAIR POWELL. So I don’t want to comment on any particular merger proposal, but I will say things have settled down for sure out there. Deposit flows have stabilized, capital and liquidity remain strong. Aggregate bank lending was stable quarter over quarter, and is up significantly year over year. Banking sector profits, generally are coming in strong this quarter and overall the banking system remains strong and resilient. Of course we’re still watching you know, the situation carefully, and monitoring you know, monitoring conditions in the banking sector. In terms of the actual effect on, if you think of a particular set of banks that were affected because of their size and business model and things like that, they were more affected by the turmoil in March than others. It’s very hard, as I mentioned, it’s very hard to sort of tease out the effects on this very large economy of ours, from them tightening. They may be tightening a little bit more, probably are, than other banks. The SLOOS has been telling us for more than a year, that banking conditions are tightening. That process is ongoing and that will restrain economic growth. So, I think we have to take a step back from, I can’t separate those anymore. I think basically we’re just looking at the overall picture. Which is one of tightening credit conditions. And that’s going to restrain economic activity, is restraining economic activity. So, that’s how I would look at it. 

JENNIFER SCHONBERGER. And how is that informing your outlook for setting policy? 

CHAIR POWELL. So I think we, that goes, that is an expected result of tightening interest rate policy is that is the bank credit conditions would, bank lending conditions would tighten as well. And so the question is, is it more effective this time because of what happened in May? I just don’t think we know that. I think we’re looking at the current data and GDP and we’re seeing strong spending. We’re seeing a strong economy, and it’s made us confident that we can go ahead and raise interest rates now for the third time since the March events. And I, it seems like the economy is weathering this well, but of course we’re watching it carefully and expect to continue to do that.

_____

_____

The Special Note summarizes my overall thoughts about our economic situation

SPX at 4544.24 as this post is written

Velocity Of Money – Charts Updated Through July 27, 2023

Here are two charts from the St. Louis Fed depicting the velocity of money in terms of the M1 and M2 money supply measures.

All charts reflect quarterly data through the 2nd quarter of 2023, and were last updated as of July 27, 2023.

Velocity of M1 Money Stock, current value = 1.446:

M1V 1.446

Data Source: FRED, Federal Reserve Economic Data, Federal Reserve Bank of St. Louis; accessed July 27, 2023:
http://research.stlouisfed.org/fred2/series/M1V

Velocity of M2 Money Stock, current value = 1.289:

M2V 1.289

Data Source: FRED, Federal Reserve Economic Data, Federal Reserve Bank of St. Louis; accessed July 27, 2023: 
http://research.stlouisfed.org/fred2/series/M2V

_________

I post various indicators and indices because I believe they should be carefully monitored.  However, as those familiar with this site are aware, I do not necessarily agree with what they depict or imply.

_____

The Special Note summarizes my overall thoughts about our economic situation

SPX at 4585.58 as this post is written

Real GDP Chart Since 1947 With Trendline – 2nd Quarter 2023

For reference purposes, below is a chart from the Advisor Perspectives’ post of July 27, 2023 titled “Q2 GDP Advance Estimate: Real GDP at 2.4%, Stronger Than Expected” reflecting Real GDP, with a trendline, as depicted.  This chart incorporates the Gross Domestic Product, Second Quarter 2023 (Advance Estimate) of July 27, 2023:

Real GDP and Its Historic Trend

_________

I post various indicators and indices because I believe they should be carefully monitored.  However, as those familiar with this site are aware, I do not necessarily agree with what they depict or imply.

_____

The Special Note summarizes my overall thoughts about our economic situation

SPX at 4602.00 as this post is written

Tuesday, July 25, 2023

Money Supply Charts Through June 2023

For reference purposes, below are two sets of charts depicting growth in the money supply.

The first shows the M1, defined in FRED as the following:

Before May 2020, M1 consists of (1) currency outside the U.S. Treasury, Federal Reserve Banks, and the vaults of depository institutions; (2) demand deposits at commercial banks (excluding those amounts held by depository institutions, the U.S. government, and foreign banks and official institutions) less cash items in the process of collection and Federal Reserve float; and (3) other checkable deposits (OCDs), consisting of negotiable order of withdrawal, or NOW, and automatic transfer service, or ATS, accounts at depository institutions, share draft accounts at credit unions, and demand deposits at thrift institutions.

Beginning May 2020, M1 consists of (1) currency outside the U.S. Treasury, Federal Reserve Banks, and the vaults of depository institutions; (2) demand deposits at commercial banks (excluding those amounts held by depository institutions, the U.S. government, and foreign banks and official institutions) less cash items in the process of collection and Federal Reserve float; and (3) other liquid deposits, consisting of OCDs and savings deposits (including money market deposit accounts). Seasonally adjusted M1 is constructed by summing currency, demand deposits, and OCDs (before May 2020) or other liquid deposits (beginning May 2020), each seasonally adjusted separately.

Here is the “M1 Money Stock” (seasonally adjusted) chart, updated on July 25, 2023 depicting data through June 2023, with a value of $18,506.0 Billion:

M1SL 18506

Here is the “M1 Money Stock” chart on a “Percent Change From Year Ago” basis, with a current value of -10.2%:

M1SL Percent Change From Year Ago

Data Source: Board of Governors of the Federal Reserve System (US), M1 Money Stock [M1SL], retrieved from FRED, Federal Reserve Bank of St. Louis; accessed July 25, 2023: https://fred.stlouisfed.org/series/M1SL

The second set shows M2, defined in FRED as the following:

Before May 2020, M2 consists of M1 plus (1) savings deposits (including money market deposit accounts); (2) small-denomination time deposits (time deposits in amounts of less than $100,000) less individual retirement account (IRA) and Keogh balances at depository institutions; and (3) balances in retail money market funds (MMFs) less IRA and Keogh balances at MMFs.

Beginning May 2020, M2 consists of M1 plus (1) small-denomination time deposits (time deposits in amounts of less than $100,000) less IRA and Keogh balances at depository institutions; and (2) balances in retail MMFs less IRA and Keogh balances at MMFs. Seasonally adjusted M2 is constructed by summing savings deposits (before May 2020), small-denomination time deposits, and retail MMFs, each seasonally adjusted separately, and adding this result to seasonally adjusted M1.

Here is the “M2 Money Stock” (seasonally adjusted) chart, updated on July 25, 2023, depicting data through June 2023, with a value of $20,889.5 Billion:

M2SL 20889.5

Here is the “M2 Money Stock” chart on a “Percent Change From Year Ago” basis, with a current value of -3.6%:

M2SL Percent Change From Year Ago

Data Source: Board of Governors of the Federal Reserve System (US), M2 Money Stock [M2SL], retrieved from FRED, Federal Reserve Bank of St. Louis; accessed July 25, 2023: https://fred.stlouisfed.org/series/M2SL

_____

The Special Note summarizes my overall thoughts about our economic situation

SPX at 4567.46 as this post is written