Monday, October 31, 2011

Disturbing Charts (Update 5)


I find the following charts to be disturbing.   These charts would be disturbing at any point in the economic cycle; that they depict such a tenuous situation now – 28 months after the official (as per the 9-20-10 NBER announcement) June 2009 end of the recession – is especially notable.

These charts raise a lot of questions.  As well, they highlight the “atypical” nature of our economic situation from a long-term historical perspective.  I regularly discuss many troubling characteristics of our economy in this EconomicGreenfield blog.

All of these charts (except one, as noted) are from The Federal Reserve, and represent the most recently updated data.

The following 8 charts are from the St. Louis Federal Reserve:

(click on charts to enlarge images)

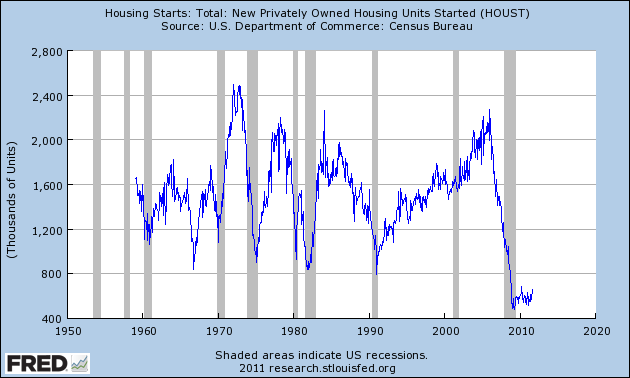
Housing starts (last updated 10-19-11):


-

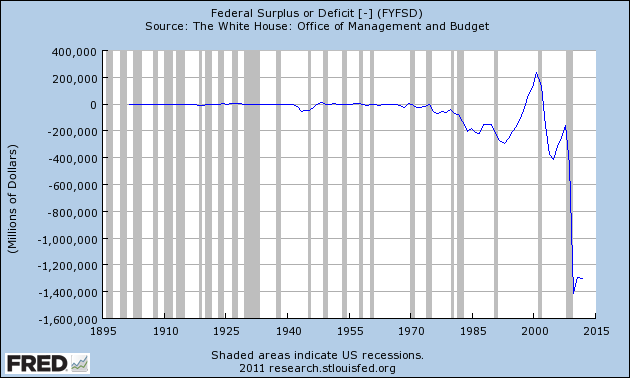
The Federal Deficit (last updated 10-14-11):


-

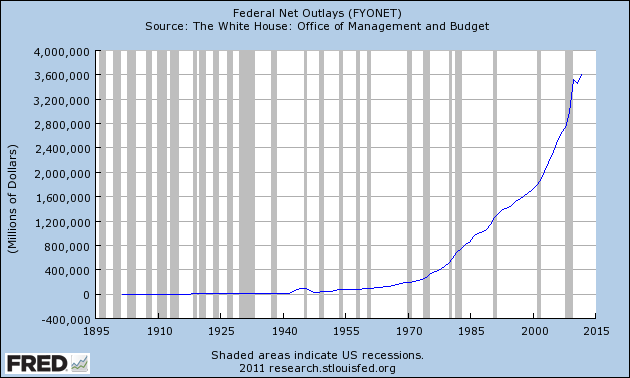
Federal Net Outlays (last updated 10-14-11):


-

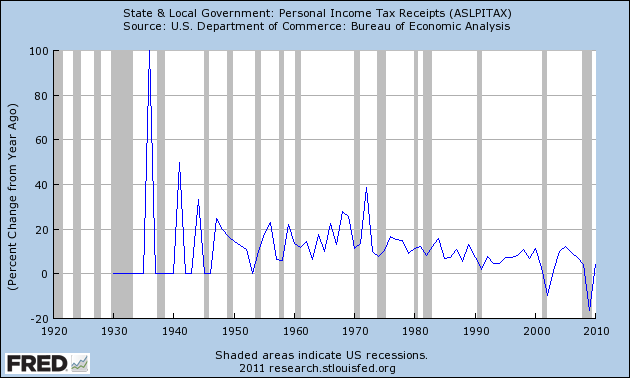
State & Local Personal Income Tax Receipts  (% Change from Year Ago)(last updated 7-29-11):


-

Total Loans and Leases of Commercial Banks (% Change from Year Ago)(last updated 10-12-11):


-

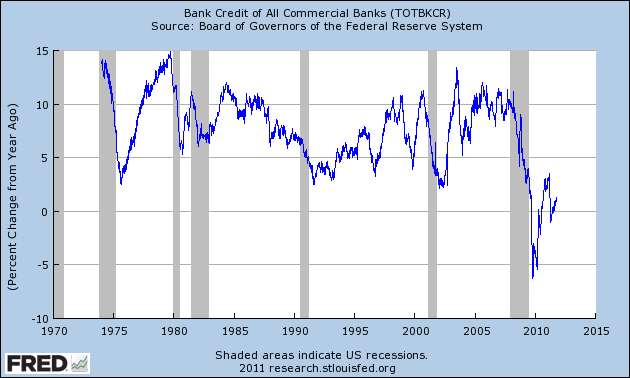
Bank Credit – All Commercial Banks (% Change from Year Ago)(last updated 10-12-11):


-

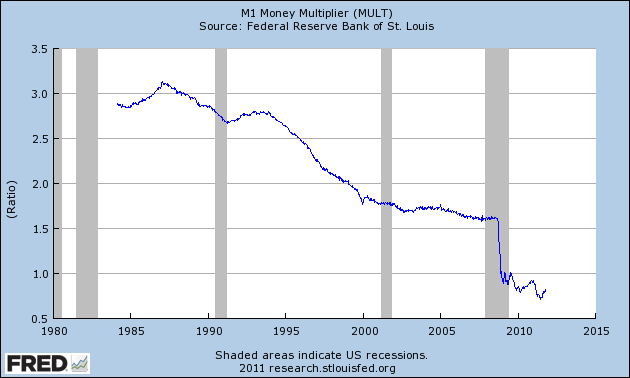
M1 Money Multiplier (last updated 10-27-11):


-

Median Duration of Unemployment (last updated 10-7-11):


-

This next chart is from the CalculatedRisk.com blog post of 10-7-11, titled “September Unemployment Report...” and it shows (in red) the relative length and depth of this downturn and subsequent recovery from an employment perspective:


-

This last chart is of the Chicago Fed National Activity Index (CFNAI) and it depicts broad-based economic activity (last updated 10-24-11):


-

I will update these charts on an intermittent basis as they deserve close monitoring…

_____

The Special Note summarizes my overall thoughts about our economic situation

SPX at 1253.30 as this post is written
Recession Measures – Updated


This post is the latest update to a series of blog posts seen on the CalculatedRisk.com blog.  The original blog post of April 12, 2010, is titled “Recession Measures.” In it, Bill discussed key measures that the NBER uses to determine recoveries, and posted four charts.

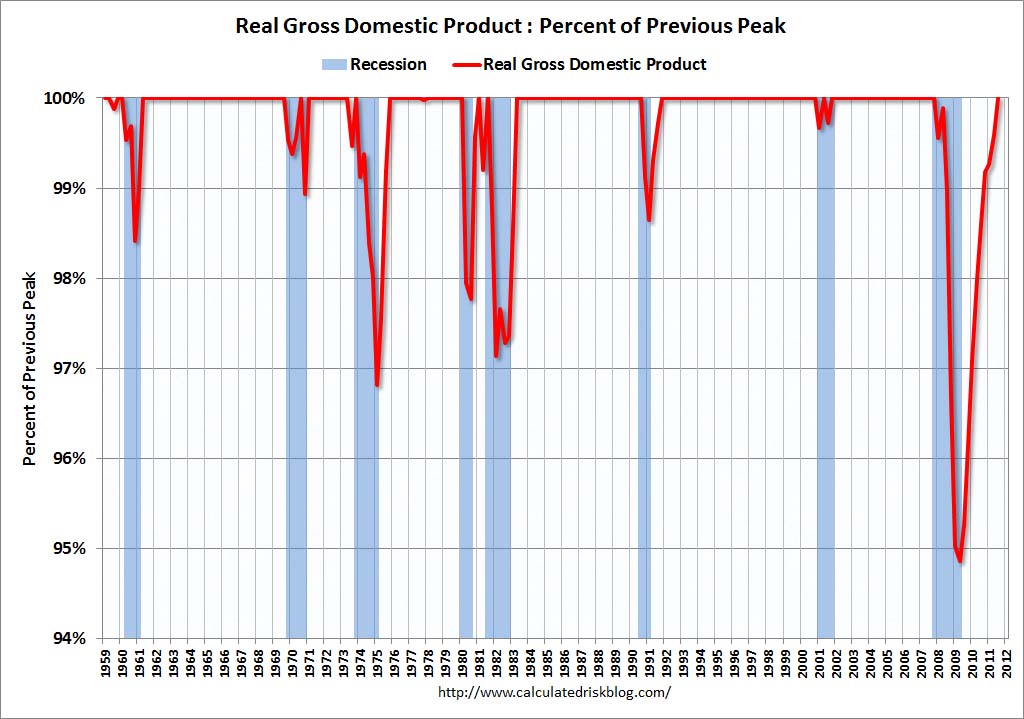
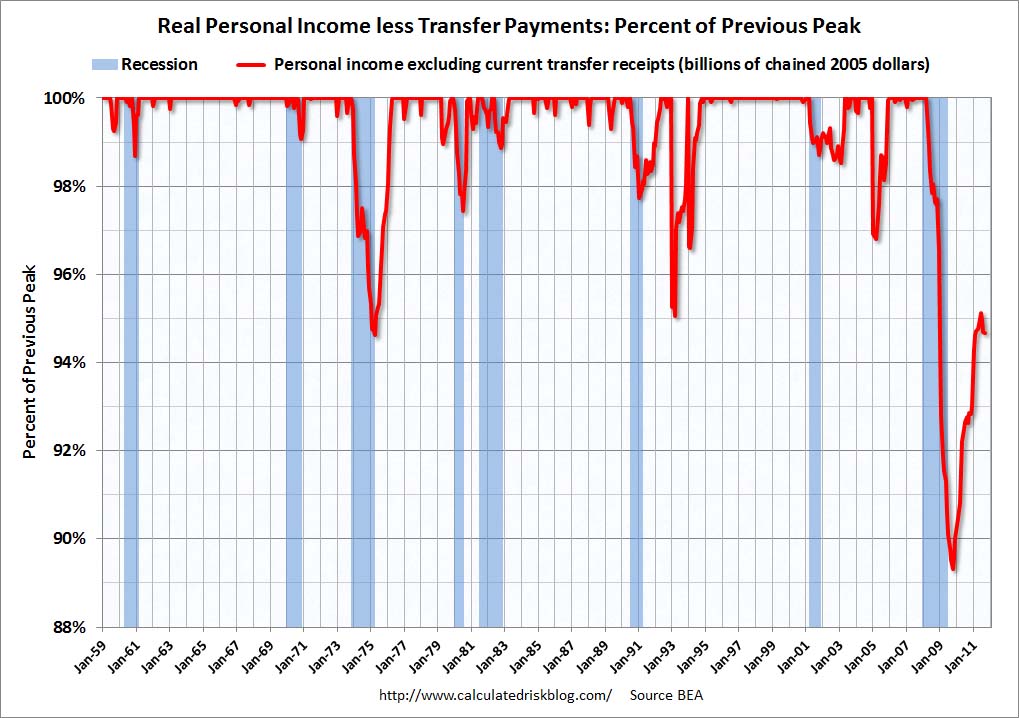
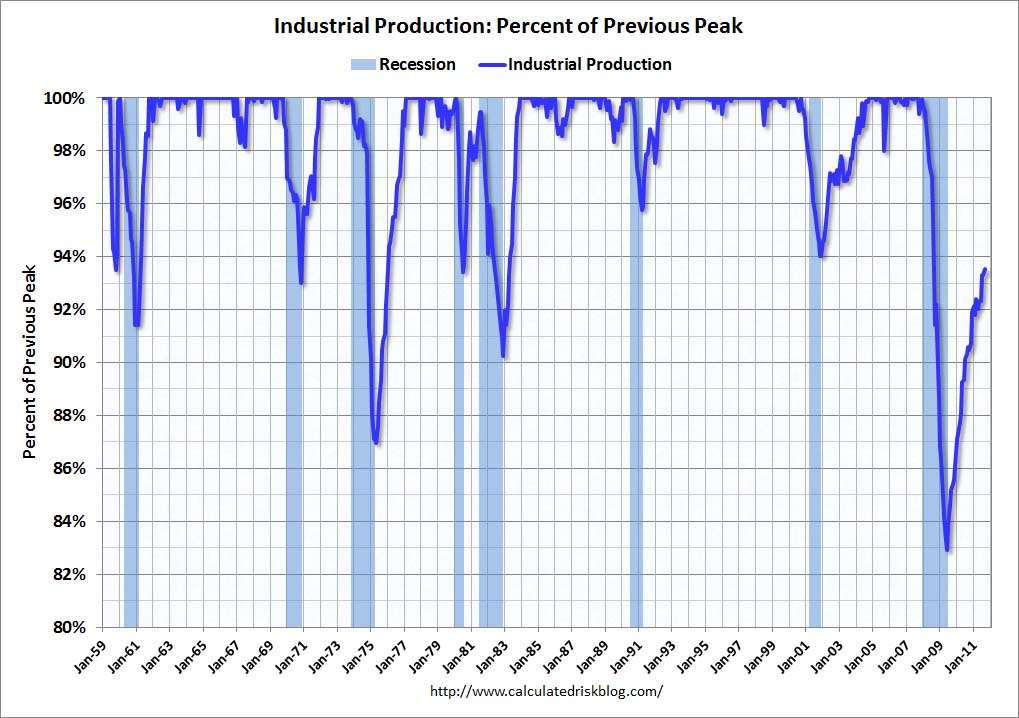
Here are those charts, updated in his October 30, 2011 post titled "Recovery Measures."  The charts are constructed in a fashion different than most – in a “percent of peak” fashion.  As defined, “The following graphs are all constructed as a percent of the peak in each indicator.  This shows when the indicator has bottomed – and when the indicator has returned to the level of the previous peak.  If the indicator is at a new peak, the value is 100%.”  Periods of recession, as defined by the NBER, are shown as blue bars.

Here are the four charts, updated through the dates shown: (click on images to enlarge)

Real Gross Domestic Product, now back to the pre-recession peak:


-

Real Personal Income Less Transfer Payments, still 5.3% below the pre-recession peak:


-

Industrial Production, still 6.5% below the pre-recession peak:


-

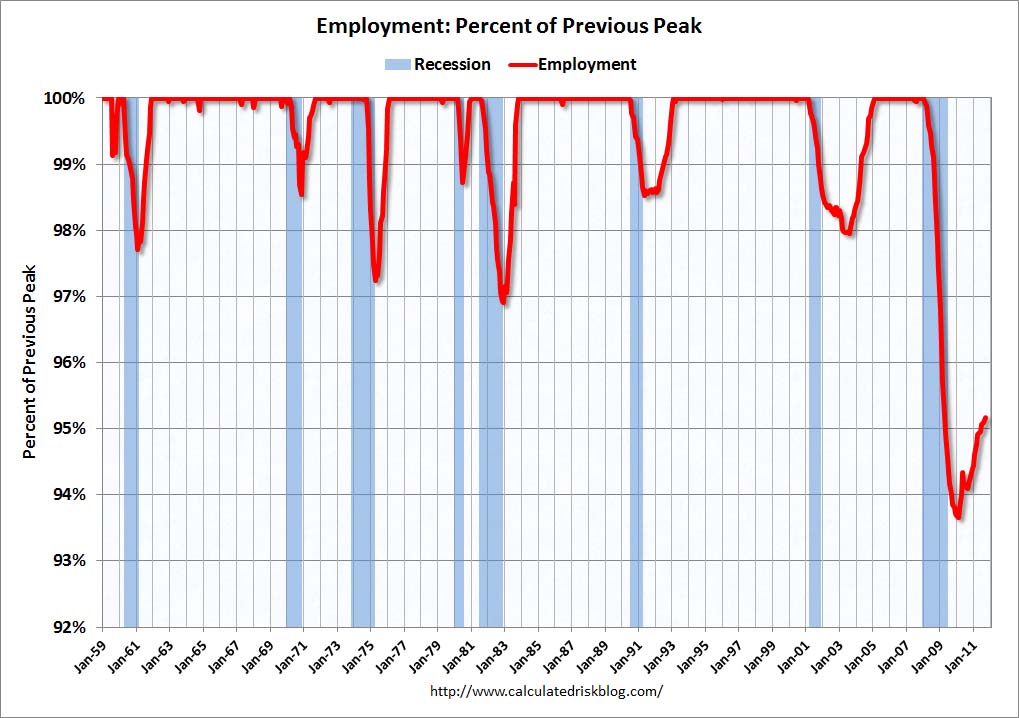
Payroll Employment, still 4.8% below the pre-recession peak:


_____

The Special Note summarizes my overall thoughts about our economic situation

SPX at 1285.08 as this post is written
Friday, October 28, 2011

Durable Goods New Orders - Long-Term Charts


Many people place emphasis on Durable Goods New Orders as an economic indicator.

For reference, here are a few charts depicting this measure.

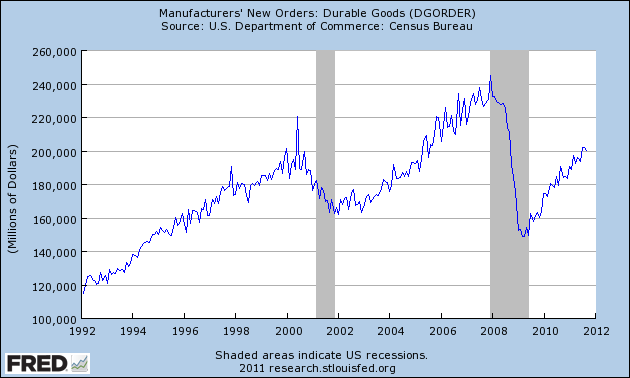
First, from the St. Louis Fed site (FRED), a chart through September, last updated on October 26.  The last value is 200,333:


-

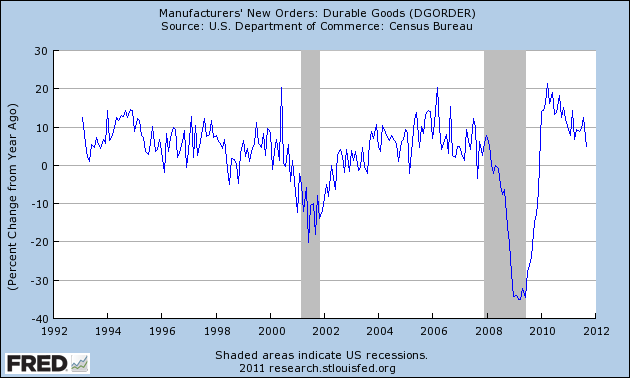
Here is the chart depicting the measure on a Percentage Change from a Year Ago:


-

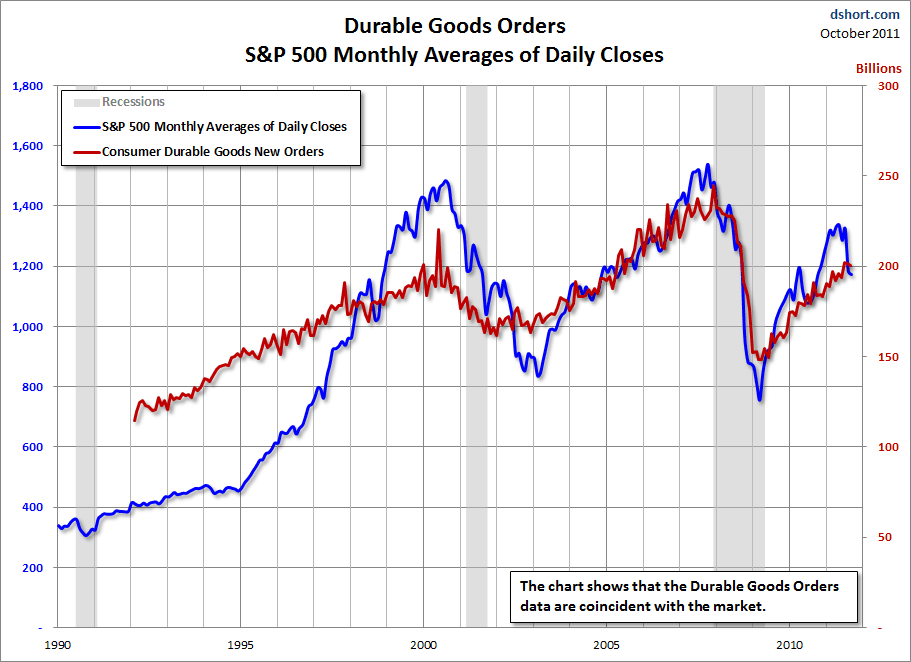
Lastly, a chart from Doug Short's post of October 26 titled "Durable Goods Orders In Historical Perspective" showing the Durable Goods New Orders vs. the S&P500:


_____

The Special Note summarizes my overall thoughts about our economic situation

SPX at 1277.52 as this post is written
Volatility In Income Among The Most Affluent Americans


In the October 22-23 Wall Street Journal, there was an article titled "The Wild Ride Of The 1%."

This article discusses the fluctuations, and causes of fluctuations, of the wealth of the country's most affluent.

While the entire article is worthwhile reading, I found the following excerpts to be particularly notable:
The American rich, who used to be the most stable slice of the personal economy, are now the most volatile, with escalating booms and busts.
also:
The super-high earners have the biggest crashes. The number of Americans making $1 million or more fell 40% between 2007 and 2009, to 236,883, while their combined incomes fell by nearly 50%—far greater than the less than 2% drop in total incomes of those making $50,000 or less, according to Internal Revenue Service figures.
also:
Rising debt plays a role. While the rich are often portrayed as thrifty "millionaires next door," the era of low interest rates and easy money has turned them into a leveraged elite. The household debt of the top 1% surged more than three-fold between 1989 and 2007, to $600 billion, and grew faster than their net worth.
Add to that the growing arms race in conspicuous consumption and you get big spenders who are only one crisis away from financial ruin.
_____

The Special Note summarizes my overall thoughts about our economic situation

SPX at 1284.59 as this post is written
Wednesday, October 26, 2011

Updates On Economic Indicators October 2011


Here is an update on various indicators that are supposed to predict and/or depict economic activity.  These indicators have been discussed in previous blog posts:

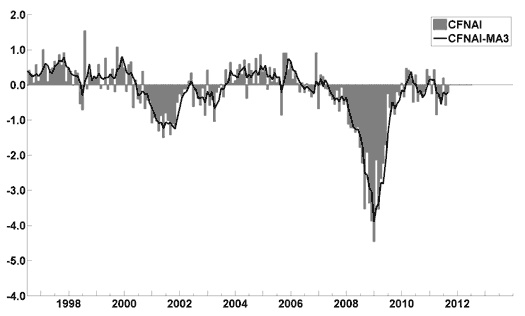
The October Chicago Fed National Activity Index (CFNAI)(pdf) updated as of October 24, 2011:


-

The USA TODAY/IHS Global Insight Economic Outlook Index:

An excerpt from the September 27 update titled “Index forecasts continued weak growth” :
The September update of the USA TODAY/IHS Global Insight Economic Outlook Index shows real GDP growth, at a six-month annualized growth rate, remaining below 2% through February. Persistent unemployment, elevated debt levels, high energy and food prices and low confidence have stalled consumer spending. Businesses are hesitant to expand amid uncertainty.
-

The ECRI WLI (Weekly Leading Index):

As of 10/14/11 the WLI was at 120.4 and the WLI, Gr. was at -10.1%.

-

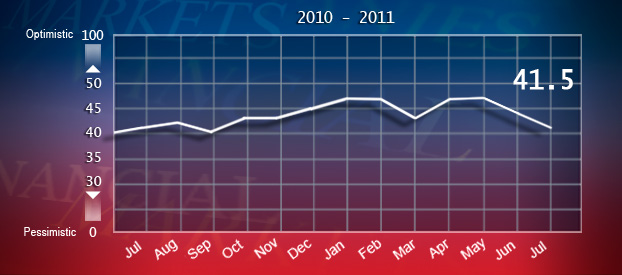
The Dow Jones ESI (Economic Sentiment Indicator):

The Indicator as of August 31 was at 41.5, as seen below:


-

The Aruoba-Diebold-Scotti Business Conditions (ADS) Index:

Here is the latest chart, depicting 10-15-09 to 10-15-11:


-

The Conference Board Leading (LEI) and Coincident (CEI) Economic Indexes:

As per the October 20 release, the LEI was at 116.4 and the CEI was at 103.3 in September.

An excerpt from the October 20 release:
Says Ken Goldstein, economist at The Conference Board: “The LEI is pointing to soft economic conditions through the end of 2011. There is a risk that already low confidence – consumer, business and investor – could weaken further, putting downward pressure on demand and tipping the economy into recession. The probability of a downturn starting over the next few months remains at about 50 percent.”
_________

I post various indicators and indices because I believe they should be carefully monitored.  However, as those familiar with this blog are aware, I do not necessarily agree with what they depict or imply.
_____


The Special Note summarizes my overall thoughts about our economic situation


SPX at 1229.05 as this post is written
Monday, October 24, 2011

PPI,CPI & Profit Margin Trends - October 2011 Update


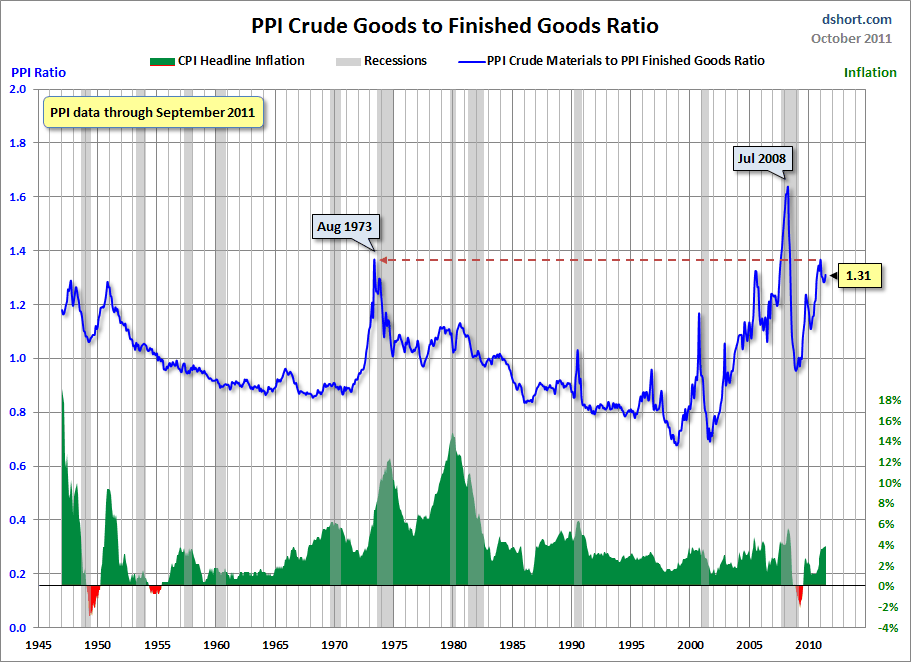
In various past posts I have written of the challenges businesses face in pricing, given today’s economic environment.  One aspect that I mentioned in the April 25 2011 and December 16 2010 posts was how the PPI (Producer Price Index) growth was significantly outpacing that of the CPI.

Since those posts, this PPI-CPI growth rate issue has remained notable.  Doug Short, on his blog, has posted a few interesting charts illustrating this concept from a long-term historical viewpoint.  Both of the charts shown below are from his October 20, 2011 post titled “Profit Margin Squeeze Remains a Challenge.”

First, here is a chart that shows the ratio, in the PPI, of Crude Goods to Finished Goods. The CPI is plotted below, in green.  This situation, as depicted, is problematical for firms, and the overall economy, on a number of fronts:

(click on chart images to enlarge)


-

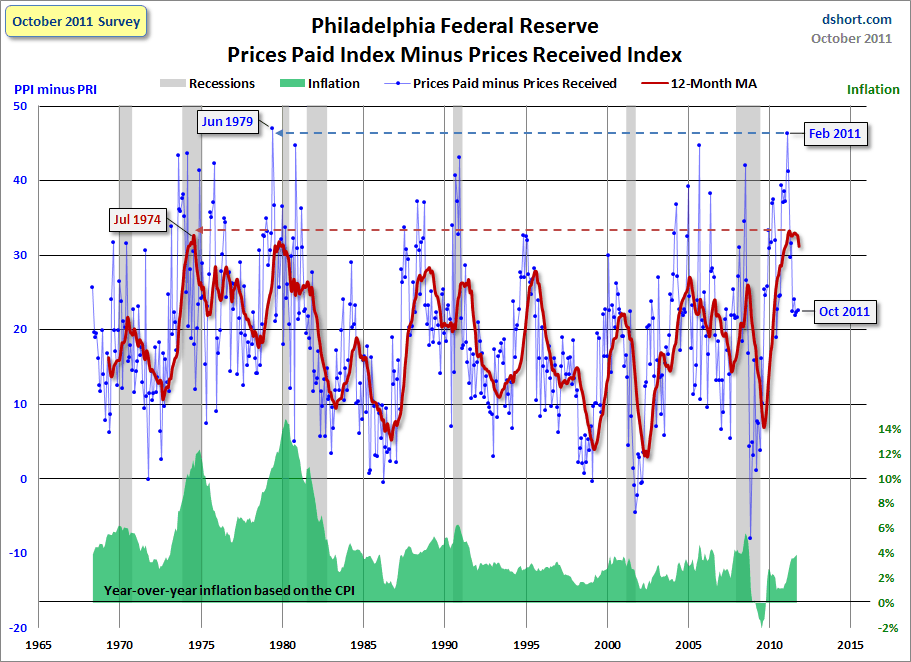
Second, a chart that shows data from the Philadelphia Federal Reserve regarding Prices Paid vs. Prices Received, with Inflation (CPI) and Recession periods also shown:


I believe that what this chart depicts is notable in a variety of ways.  As shown, we are experiencing a unique situation, and while the index level has recently subsided, we are near historical peaks for the 12-month moving average (MA) as shown.

I believe this data and its implications for businesses and the economy at large is of great concern.  Seeing how this situation resolves will be very interesting.  This is especially so given the vulnerability of the U.S. Dollar to a substantial decline, a topic that I have written extensively about.
_____


The Special Note summarizes my overall thoughts about our economic situation


SPX at 1244.69 as this post is written

Friday, October 21, 2011

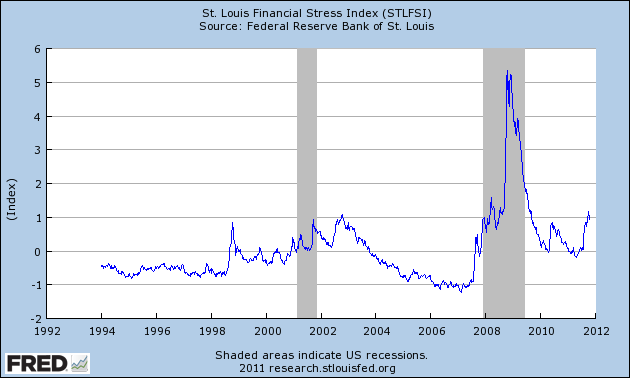
St. Louis Financial Stress Index – October 20 Update


On March 28 I wrote a post (“The STLFSI“) about the  STLFSI (St. Louis Fed’s Financial Stress Index) which is supposed to measure stress in the financial system.  Here is the most recent chart.  This chart was last updated on October 20, incorporating data from 12-31-93 to 10-14-11 on a weekly basis.  The present level is .947:


_________

I post various indicators and indices because I believe they should be carefully monitored.  However, as those familiar with this blog are aware, I do not necessarily agree with what they depict or imply.
_____


The Special Note summarizes my overall thoughts about our economic situation


SPX at 1229.01 as this post is written
Thursday, October 20, 2011

Thoughts On The Next Stock Market Decline


In my post of October 10 ("Near-Term Direction Of Stock Market")  I stated with regard to the S&P500:
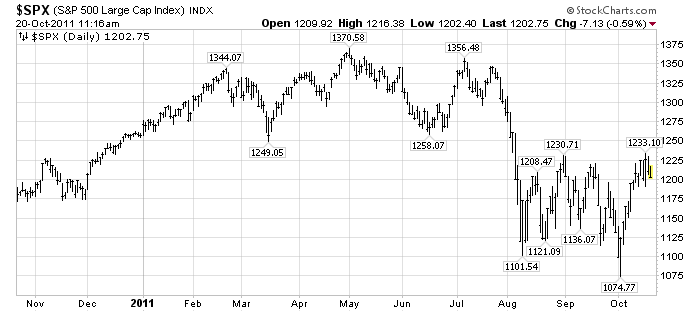
The question now becomes whether that 1074.77 was a “lasting bottom,” or whether there is more near-term downside.  I believe that the 1074.77 low will not be a “lasting bottom” – i.e. it will be breached to the downside in the near-term.
In my post of Monday, October 17 ("Danger Signs In The Stock Market, Financial System And Economy") I further highlighted a variety of building risks.

Near the end of that blog post I commented:
Of further concern is whether, and when, the above-mentioned problems might reach a point at which another (financial system) crash occurs.
I have come to the conclusion, based on my overall analysis of the growing risk, that the next leg down in the stock market might not be "orderly."  In other words, it may be a stock market crash.  At this point I would assign the probability of such a stock market crash in the near-term being (at least) 50%.

Here is an updated chart of the S&P500, on a 1-year daily basis through the present, with price labels, for reference:

(click on chart to enlarge image)(chart courtesy of StockCharts.com)


_____

The Special Note summarizes my overall thoughts about our economic situation


SPX at 1202.83 as this post is written
October 19 Gallup Poll On Americans' Personal Finances - Notable Excerpts


On October 19, Gallup released poll results titled “Americans Grow More Negative About Their Personal Finances.”

I find this poll interesting for a variety of reasons; perhaps chief among them is as another indication of growing financial strain among households.  A few excerpts of note:
Nearly one in four U.S. adults (22%) now rate their personal financial situation as "poor." This is up slightly from the 16% to 19% range seen during and after the official U.S. recession, and is the highest percentage since Gallup began asking this question in 2001.
also:
Americans are also less hopeful about their future personal financial situations. Nearly half (48%) say their personal financial situation is "getting worse," up from 41% in April and nearly tying the record-high 49% who said so in April 2008. A new low of 29% say their personal financial situation is getting better.
also:
The fact that they are now even more likely than they were during the recession to rate their economic situation as poor helps explain why 80% of Americans maintain that the U.S. economy remains in recession. Further, the 48% who say their situation is getting worse is now similar to the percentage who said so in the months just prior to the U.S. economic collapse, perhaps giving fodder to those who predict a double-dip recession.
_____


The Special Note summarizes my overall thoughts about our economic situation


SPX at 1209.82 as this post is written
Wednesday, October 19, 2011

Conference Board CEO Confidence 3Q 2011


On October 7, I wrote a post about the latest Business Roundtable’s CEO Economic Outlook Survey and the Duke/CFO Magazine Global Business Outlook Survey titled “CEO & CFO Surveys 3Q 2011.”

Subsequent to that post, on October 11, The Conference Board released its 3rd Quarter CEO Confidence Survey.   The overall measure of CEO Confidence was at 42, down from 55 in the second quarter.

Notable excerpts from the October 11 Press Release include:
Says Lynn Franco, Director of The Conference Board Consumer Research Center: “CEO Confidence has declined substantially in the last two quarters and is now at its lowest level in over two years. Clearly, this prolonged period of slow growth is taking a toll on confidence, and expectations are that these lackluster conditions will persist through early 2012.”
also:
CEOs’ optimism about the short-term outlook also deteriorated sharply. Currently, about 19 percent of business leaders anticipate an improvement in economic conditions over the next six months, down from 43 percent in the second quarter. Expectations for their own industries are also quite negative, with approximately 22 percent of CEOs expecting conditions to improve in the months ahead, down from 44 percent last quarter.
_____

I post various economic forecasts because I believe they should be carefully monitored.  However, as those familiar with this blog are aware, I do not agree with many of the consensus estimates and much of the commentary in these forecast surveys.
_____


The Special Note summarizes my overall thoughts about our economic situation


SPX at 1225.38 as this post is written
Tuesday, October 18, 2011

Deloitte “CFO Signals” Report 3Q 2011 – Notable Aspects


Recently Deloitte released their “CFO Signals” report (pdf) for the 3rd Quarter 2011.

As seen in page 2 of the report, "Ninety-one CFOs responded during the two weeks ended August 26.  Three-fourths are from public companies, and three-fourths are from companies with more than $1B in annual revenue."

Here are some excerpts that I found notable:

from page 7:
Concerns over further economic turmoil topped CFOs’ worries back in 3Q10—and they are back in force. This quarter, economic concerns rebounded strongly and are again the dominant concern for many CFOs. In fact, economic risk is the top issue within all industries except Healthcare/Pharma and for nearly half of CFOs overall.
from page 9:
Recession fears have resurged in the wake of this quarter’s string of notable global economic events. About one-third of all CFOs now say their companies see recession as the most likely scenario over the next few years—34% for the U.S., 18% for Canada, and 40% for Mexico. Recession or not, more than half of all CFOs say their financial projections have declined (or will decline) as a result of the turmoil.
from page 11, concerning “Industry” :
Nearly 30% of CFOs named market growth a top challenge last quarter, but that number fell to 18% this quarter. Meanwhile, the proportion of CFOs citing pressures from market contraction rose from 25% to nearly one-third.
Rising uncertainty around market demand is leading to increased competition and pricing pressures. Pricing trends are again a top concern for 40% of companies (53% last quarter) and for five of the eight industries, strongest within Technology, Financial Services, and T/M/E. Although input prices are still the dominant industry challenge for Manufacturing, their effect on pricing seems to have declined with just 14% of CFOs overall naming it a top challenge (down from 25% last quarter). Rising competition for stagnating markets appears to be the bigger contributor with more than a quarter of CFOs citing new competitive tactics as a top challenge (these tactics are the top concern in Retail/Wholesale and second in T/M/E).
from page 13, concerning "Company" :
CFOs currently project average year-over-year sales gains of about 6.8%* (slightly below last quarter’s 7%), and 83% of CFOs overall project gains (about the same as last quarter).
from page 13, concerning "Company" :
Earnings growth expectations declined markedly to 9.3%* (versus 14% last quarter), but 82% of CFOs still expect gains.
_____


The Special Note summarizes my overall thoughts about our economic situation


SPX at 1200.25 as this post is written
Monday, October 17, 2011

Danger Signs In The Stock Market, Financial System And Economy


In recent posts concerning the stock market, such as those of October 10 and September 29, I have commented :
…the stock market “price action” feels very “unsettled” to me, and, as such,  I think the “danger” here is rather high.
In this post I would like to list a variety of areas that I see as signs of significant and increasing danger not only in the stock market, but to the overall financial markets and economy as well.  While, unfortunately, the complete list is very long, and would include both apparent and non-apparent aspects,  this summary list includes many major areas.  I have included links for those areas I have previously discussed in this blog:
  1. High price volatility in the stock market (The S&P500 is currently at 1224.58)
  2. Highly depressed and rapidly falling consumer confidence
  3. Many signs of pronounced economic weakness
  4. Signs of stock market weakness and danger seen in various technical analysis measures
  5. ECRI's WLI Growth readings as well as ECRI's September 30  Recession statement 
  6. Continually worrisome trends in median household income, as well as numerous signs of broad-based financial strain among households
  7. Elevated financial system stress levels, seen in many measures including the VIX, various CDS spreads, and other metrics such as the STLFSI.
  8. Poor financial stock "price action" and fundamental questions regarding the financial viability of various institutions
  9. Various manifestations of recent "deflationary pressures"
  10. Other "problem areas" that I have frequently written of;  a list can be found in a Seeking Alpha article of January 10 titled "10 'Front and Center' Problem Areas That Pose a Threat to the Economy."
Of further concern is whether, and when, the above-mentioned problems might reach a point at which another (financial system) crash occurs.  I am particularly concerned about the prospects of the next crash for a number of reasons, of which I will elaborate upon shortly.
_____


The Special Note summarizes my overall thoughts about our economic situation


SPX at 1224.58 as this post is written
Sunday, October 16, 2011

A Current Chart Of ECRI WLI Growth


As I stated in my July 12, 2010 post ("ECRI WLI Growth History"):
For a variety of reasons, I am not as enamored with ECRI’s WLI and WLI Growth measures as many are.
However, I do think the measures are important and deserve close monitoring and scrutiny.
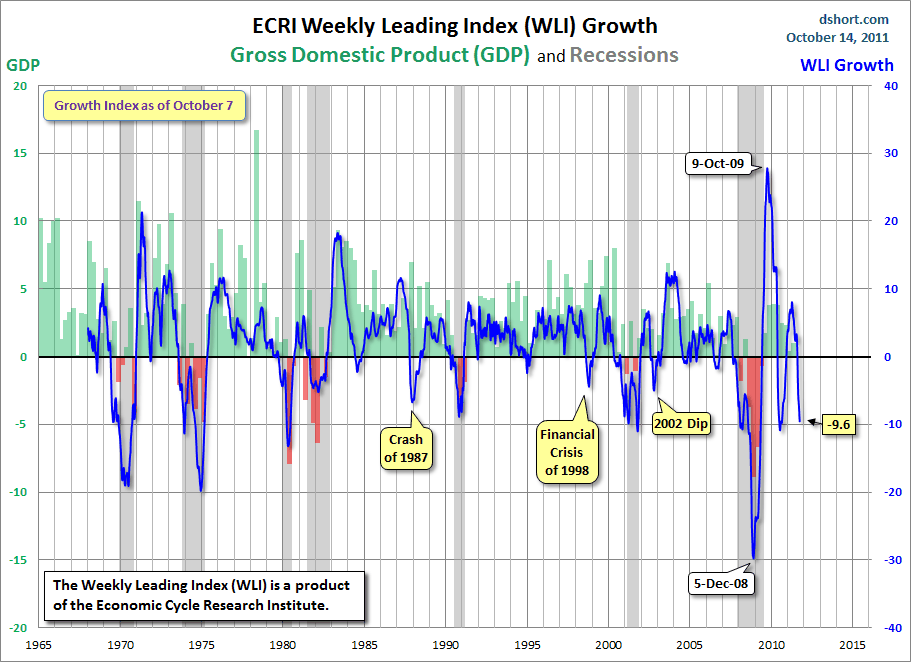
The movement of the ECRI WLI Growth is particularly notable at this time.  Below is a chart from Doug Short's blog post of October 14 titled "ECRI Recession Watch: Growth Index Declines Further" :

(click on chart to enlarge image)


As noted on the chart, the most recent ECRI WLI Growth reading of October 7, at -9.6, is at depths rarely seen since 1965.

In conjunction with this reading, it is also important to take into account ECRI's statement of September 30, which I featured in the October 3 post ("ECRI Recession Statement Of September 30 - Notable Excerpts")
_____


The Special Note summarizes my overall thoughts about our economic situation


SPX at 1224.58 as this post is written
Friday, October 14, 2011

The October 2011 Wall Street Journal Economic Forecast Survey


The October Wall Street Journal Economic Forecast Survey was published today, October 13, 2011.  The headline is "U.S. Incomes Seen Stagnant Through 2021 .”

I found various aspects of the survey to be interesting, including the following excerpts:
Americans' incomes have dropped since 2000 and they aren't expected to make up the lost ground before 2021, according to economists in the latest Wall Street Journal forecasting survey.
From 2000 to 2010, median income in the U.S. declined 7% after adjusting for inflation, according to Census data. That marks the worst 10-year performance in records going back to 1967. On average, the economists expect inflation-adjusted incomes to rise over the next decade, but the 5% projected gain isn't enough to reach prerecession levels.
also:
The economists, on average, put nearly 1-in-3 odds of another downturn hitting the U.S. economy in the next 12 months.
In the detail (spreadsheet), there are a variety of notable questions and responses.  Here are a couple regarding Recession Risk and Standard of Living :

Recession Risk

Please estimate on a scale of 0 to 100 the probability of a recession in the U.S. in the next 12 months.

Average 31%

Selection of comments:

-We're skating on very thin ice!

-We have very little control over our own economy.

-There is too much money around for a recession.


Standard of Living

Will the current generation of college graduates have a higher standard of living than their parents?

Yes 70%

No  30%

Selection of comments:

-Yes it is a challenging environment today but this too will pass.

-Depends on how defined but basically no.

-Anti-business political environment will pass, American dream is intact.

--

The current average forecasts among economists polled include the following:


GDP:

full-year 2011 : 1.5%
full-year 2012:  2.3%
full-year 2013:  2.7%


Unemployment Rate:

December 2011: 9.1%
December 2012: 8.7%
December 2013: 8.2%


10-Year Treasury Yield:

December 2011: 2.15%
December 2012: 2.9%


CPI:

December 2011:  3.1%
December 2012:  2.2%
December 2013:  2.4%


Crude Oil  ($ per bbl):

for 12/31/2011: $86.47
for 12/31/2012: $91.08

(note: I comment upon this survey each month; commentary on past surveys can be found under the “Economic Forecasts” label)
_____

I post various economic forecasts because I believe they should be carefully monitored.  However, as those familiar with this blog are aware, I do not necessarily agree with many of the consensus estimates and much of the commentary in these forecast surveys.
_____


The Special Note summarizes my overall thoughts about our economic situation


SPX at 1203.66 as this post is written

Thursday, October 13, 2011

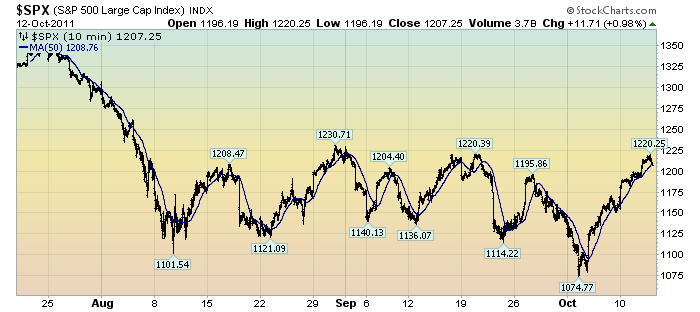
A Chart Of Recent S&P500 Price Volatility - October 13 Update


This post is an update to the post of October 6 ("A Chart Of Recent S&P500 Price Volatility")

While I track many different measures of volatility, I find the following chart to be both simple and clear in depicting the recent outsized volatility in the stock market.

This chart depicts the S&P500 in 10 minute intervals from July 20 through yesterday’s close.  As such, it encompasses the progression of the stock market since its July 25 daily high of 1344.32:

(click on chart to enlarge image)(chart courtesy of StockCharts.com)


The blue line is a 50-period moving average.

I continue to believe that this volatility is notable and has important implications.

As I wrote in the above-referenced October 6 post:
What I find notable is the frequency and extent of the price volatility.  As one can see, there have been several episodes of advances and declines of roughly 80-100+ points in rapid fashion – some even happening over the course of a few days.
While there are various ways to interpret such volatility, my overall belief is that such is (yet another) cautionary sign.
_____


The Special Note summarizes my overall thoughts about our economic situation


SPX at 1195.69 as this post is written
Tuesday, October 11, 2011

Article On Household Incomes - Notable Excerpts


Yesterday the New York Times had an article titled "Recession Officially Over, U.S. Incomes Kept Falling."  It discusses trends in real median family income over the last few years.
While the entire article is worthwhile, here are a few excerpts I found most notable:
In a grim sign of the enduring nature of the economic slump, household income declined more in the two years after the recession ended than it did during the recession itself, new research has found.
Between June 2009, when the recession officially ended, and June 2011, inflation-adjusted median household income fell 6.7 percent, to $49,909, according to a study by two former Census Bureau officials. During the recession — from December 2007 to June 2009 — household income fell 3.2 percent.
also:
The full 9.8 percent drop in income from the start of the recession to this June — the most recent month in the study — appears to be the largest in several decades, according to other Census Bureau data. Gordon W. Green Jr., who wrote the report with John F. Coder, called the decline “a significant reduction in the American standard of living.”
also:
One reason pay has stagnated is that many people who lost their jobs in the recession — and remained out of work for months — have taken pay cuts in order to be hired again. In a separate study, Henry S. Farber, an economics professor at Princeton, found that people who lost jobs in the recession and later found work again made an average of 17.5 percent less than they had in their old jobs.
“As a labor economist, I do not think the recession has ended,” Mr. Farber said. “Job losers are having more trouble than ever before finding full-time jobs.”
_____


The Special Note summarizes my overall thoughts about our economic situation


SPX at 1194.89 as this post is written
Monday, October 10, 2011

Near-Term Direction Of Stock Market – October 10 Update


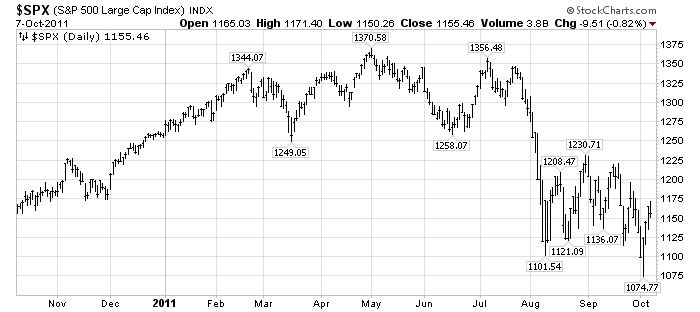
In my post of September 29 ("Near-Term Direction Of The Stock Market - Update") I had reiterated my view that the S&P500 would fall below the August 9 low of 1101.54.

It did fall below that 1101.54 level, reaching a bottom of 1074.77 on October 4.

The question now becomes whether that 1074.77 was a "lasting bottom," or whether there is more near-term downside.  I believe that the 1074.77 low will not be a "lasting bottom" - i.e. it will be breached to the downside in the near-term.

This may seem illogical to some, as we have seen a strong rebound from that 1075-level over the last few days.  Friday's close of 1155.46, as well as strong futures indications this morning, have led many to become bullish.

This strong rebound seems to me to be a strong "bounce" more than anything else.  I continue to believe what I wrote in the aforementioned September 29 post - "...the stock market “price action” feels very “unsettled” to me, and, as such,  I think the “danger” here is rather high."

There are many aspects of the financial and economic situation - many that I have recently written of - that lead me to believe this continues to be a dangerous situation.

Here is an updated chart of the S&P500, on a 1-year daily basis through 10-7-11 with price labels, for reference:

(click on chart to enlarge image)(chart courtesy of StockCharts.com)


_____

Since the S&P500 highs of early May and early July I have written a variety of posts warning of what I considered cautionary signs for the stock market.  Most of those posts can be found in the "stock market" category.
_____


The Special Note summarizes my overall thoughts about our economic situation


SPX at 1155.46 as this post is written
Sunday, October 9, 2011

U-3 And U-6 Unemployment Rate Long-Term Reference Charts


Shortly after each monthly employment report I have been posting a continual series titled "3 Critical Unemployment Charts."

Of course, there are many other employment charts that can be displayed as well.

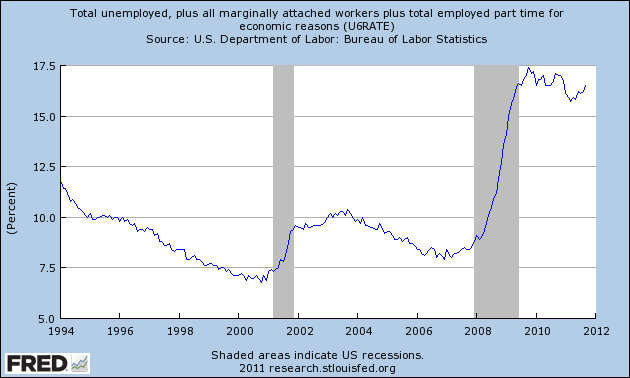
For reference purposes, below are the U-3 and U-6 Unemployment Rate charts from a long-term historical perspective.  Both charts are from the St. Louis Fed site.  The U-3 measure is what is commonly referred to as the official unemployment rate; whereas the U-6 rate is officially (per Bureau of Labor Statistics) defined as:
Total unemployed, plus all persons marginally attached to the labor force, plus total employed part time for economic reasons, as a percent of the civilian labor force plus all persons marginally attached to the labor force
Of note, many economic observers use the U-6 rate as a (closer) proxy of the actual unemployment rate rather than that depicted by the U-3 measure.

Here is the U-3 chart, showing a 9.1% unemployment rate:

(click on charts to enlarge images)(charts updated as of 10-7-11)


-

Here is the U-6 chart, showing a 16.5% unemployment rate:


_____

The Special Note summarizes my overall thoughts about our economic situation


SPX at 1155.46 as this post is written

3 Critical Unemployment Charts – October 2011


As I have commented previously, as in the October 6, 2009 post (“A Note About Unemployment Statistics”), in my opinion the official methodologies used to measure the various job loss and unemployment statistics do not provide an accurate depiction; they serve to understate the severity of unemployment.

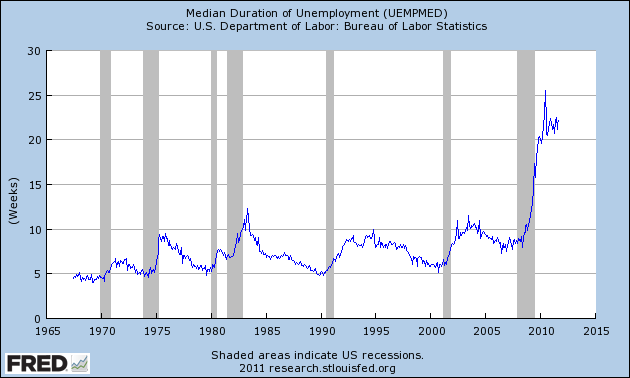
However, even if one chooses to look at the official statistics, the following charts provide an interesting (and disconcerting) long-term perspective of certain aspects of the officially-stated unemployment situation.

The first two charts are from the St. Louis Fed site.  Here is the Median Duration of Unemployment:

(click on charts to enlarge images)(charts updated as of 10-7-11)


-

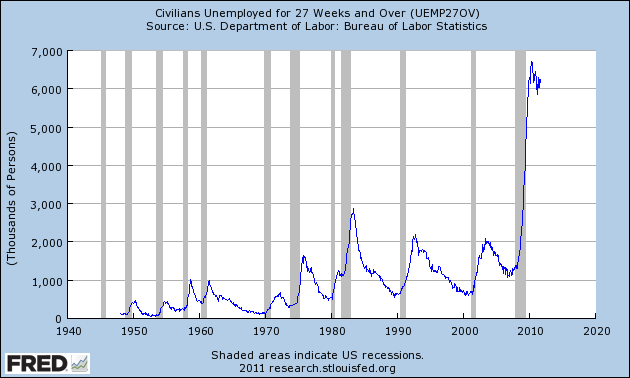
Here is the chart for Unemployed 27 Weeks and Over:


-

Lastly, a chart from the CalculatedRisk.com site, from the October 7 post titled “September Unemployment Report…”  This shows the employment situation vs. that of previous recessions, as shown:


-

As depicted by these charts, our unemployment problem is severe.  Unfortunately, there do not appear to be any “easy” solutions.

In July 2009 I wrote a series of five blog posts titled “Why Aren’t Companies Hiring?”, which discusses various aspects of the topic, many of which lack recognition.
_____


The Special Note summarizes my overall thoughts about our economic situation


SPX at 1155.46 as this post is written
Friday, October 7, 2011

The Plight Of The Wealthy During Depressions


As seen in the September 15 post ("September 13 Gallup Poll On Upper-Income Americans' Economic Confidence") lately there appears to be a significant lessening of economic confidence among "upper-income" Americans; and, as seen in the poll, "This is the first month since the financial crisis of late 2008 and early 2009 that upper-income Americans are more pessimistic about the future direction of the U.S. economy than other Americans."

One question that may arise is how the wealthy and ultra-wealthy will be ultimately impacted in severe economic weakness, i.e. conditions most will label a Depression.  Of course, in the last 100 years or so, The Great Depression is the only episode of such an environment in the United States.  While to my knowledge there is no definitive study of loss of wealth among the most affluent during The Great Depression, it appears as if many of the wealthiest Americans during the period experienced a pronounced reduction in wealth.  Some, including the most wealthy and influential of the day, "lost everything."  One documentary of the period that illustrated this facet was "The Crash of 1929" that I highlighted in the July 8 post.

This current economic and investment environment is one in which large percentages of wealth can be quickly lost.  I base this statement on many factors, one being the existence of many asset bubbles, which I have written of extensively.
_____


The Special Note summarizes my overall thoughts about our economic situation


SPX at 1164.97 as this post is written

CEO & CFO Surveys 3Q 2011


On September 29 the Business Roundtable’s CEO Economic Outlook Survey was released for the 3rd quarter.  The September Duke/CFO Magazine Global Business Outlook Survey (pdf) was released on September 13.  Both contain a variety of statistics regarding how executives view business and economic conditions.

In the CEO survey, of particular interest is the CEO Economic Outlook Index, which decreased to 77.6 from 109.9 in the 2nd quarter.  Also stated in the report, "In terms of the overall U.S. economy, member CEOs estimate real GDP will grow by 1.8 percent in 2011, a decrease from the 2.8 percent projected in the second quarter of 2011." Also, as seen in the Press Release:
“The findings of this survey show declines in each category of economic measurement,” said Jim McNerney, Chairman of Business Roundtable and Chairman, President and CEO of The Boeing Company.  “While we see strong business fundamentals in America still, the quarterly survey results reflect increased uncertainty among CEOs concerning the economic climate and business environment.”
In the CFO Survey:
Chief financial officers don’t foresee a double-dip recession, but doubts about the strength of the economy have pessimists outnumbering optimists by more than five to one in the United States. Business spending is expected to grow, though more slowly than last quarter, and hiring will continue at a sluggish pace.
also:
Capital spending in the U.S. is expected to see solid growth of 4.5 percent, but that is about half the pace predicted last quarter. One-third of firms say they’ve slowed planned spending this year, citing economic uncertainty and funding constraints.
also:
Domestic U.S. employment is expected to rise about 1 percent in the next year, which would likely leave the unemployment rate stalled around 9 percent.
also:
“This significant drop in optimism is being driven by a number of deep concerns: continued weak consumer demand, intense price pressure, and uncertainty about government policies and global financial instability,” said Kate O’Sullivan, deputy editor at CFO Magazine.
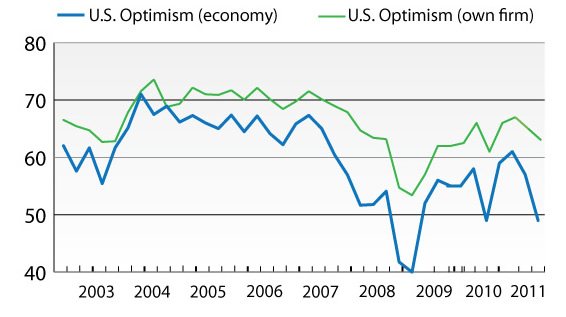
The CFO survey contains the Optimism Index chart, showing U.S. Optimism (with regard to the economy) at 49.4, as seen below:


It should be interesting to see how well the CEOs and CFOs predict business and economic conditions going forward.   I discussed various aspects of this, and the importance of these predictions, in the July 9 2010 post titled “The Business Environment”.

(past posts on CEO and CFO Surveys can be found under the “CFO and CEO Confidence” label)
_____

I post various economic forecasts because I believe they should be carefully monitored.  However, as those familiar with this blog are aware, I do not agree with many of the consensus estimates and much of the commentary in these forecast surveys.
_____


The Special Note summarizes my overall thoughts about our economic situation


SPX at 1164.97 as this post is written

Thursday, October 6, 2011

A Chart Of Recent S&P500 Price Volatility


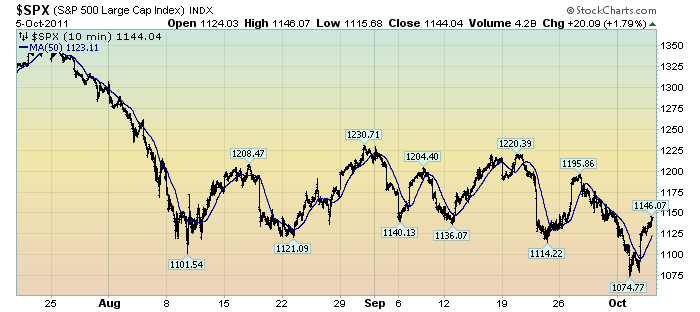
The following chart depicts the S&P500 in 10 minute intervals from July 20 through yesterday's close.  As such, it encompasses the progression of the stock market since its July 25 daily high of 1344.32:

(click on chart to enlarge image)(chart courtesy of StockCharts.com)


The blue line is a 50-period moving average.

What I find notable is the frequency and extent of the price volatility.  As one can see, there have been several episodes of advances and declines of roughly 80-100+ points in rapid fashion - some even happening over the course of a few days.

While there are various ways to interpret such volatility, my overall belief is that such is (yet another) cautionary sign.
_____


The Special Note summarizes my overall thoughts about our economic situation


SPX at 1144.04 as this post is written