Monday, September 30, 2019

The State Of The U.S. Economy And Financial System

Various surveys, economic growth projections, and market risk indicators continue to indicate U.S. economic growth and financial system stability for the foreseeable future.
However, there are various indications – many of which have been discussed on this site – that this very widely-held consensus is in many ways incorrect.  There are many exceedingly problematical financial conditions that continue to exist, some of which have grown in severity.  As well, numerous economic dynamics continue to be worrisome and many economic indicators portray facets of weak growth or outright decline.
Of paramount importance is the resulting level of risk and the future economic implications.
From an “all things considered” standpoint, I continue to believe the overall level of risk is at a fantastic level, one that is far greater than that experienced at any time in the history of the United States.
Cumulatively, these highly problematical conditions will lead to future upheaval.  The extent of the resolution of these problematical conditions will determine the ongoing viability of the financial system and economy as well as the resultant quality of living.
As I have previously written in “The U.S. Economic Situation” updates:
My analyses continues to indicate that the growing level of financial danger will lead to the next stock market crash that will also involve (as seen in 2008) various other markets as well.  Key attributes of this next crash is its outsized magnitude (when viewed from an ultra-long term historical perspective) and the resulting economic impact.  This next financial crash is of tremendous concern, as my analyses indicate it will lead to a Super Depression – i.e. an economy characterized by deeply embedded, highly complex, and difficult-to-solve problems.
_____
The Special Note summarizes my overall thoughts about our economic situation
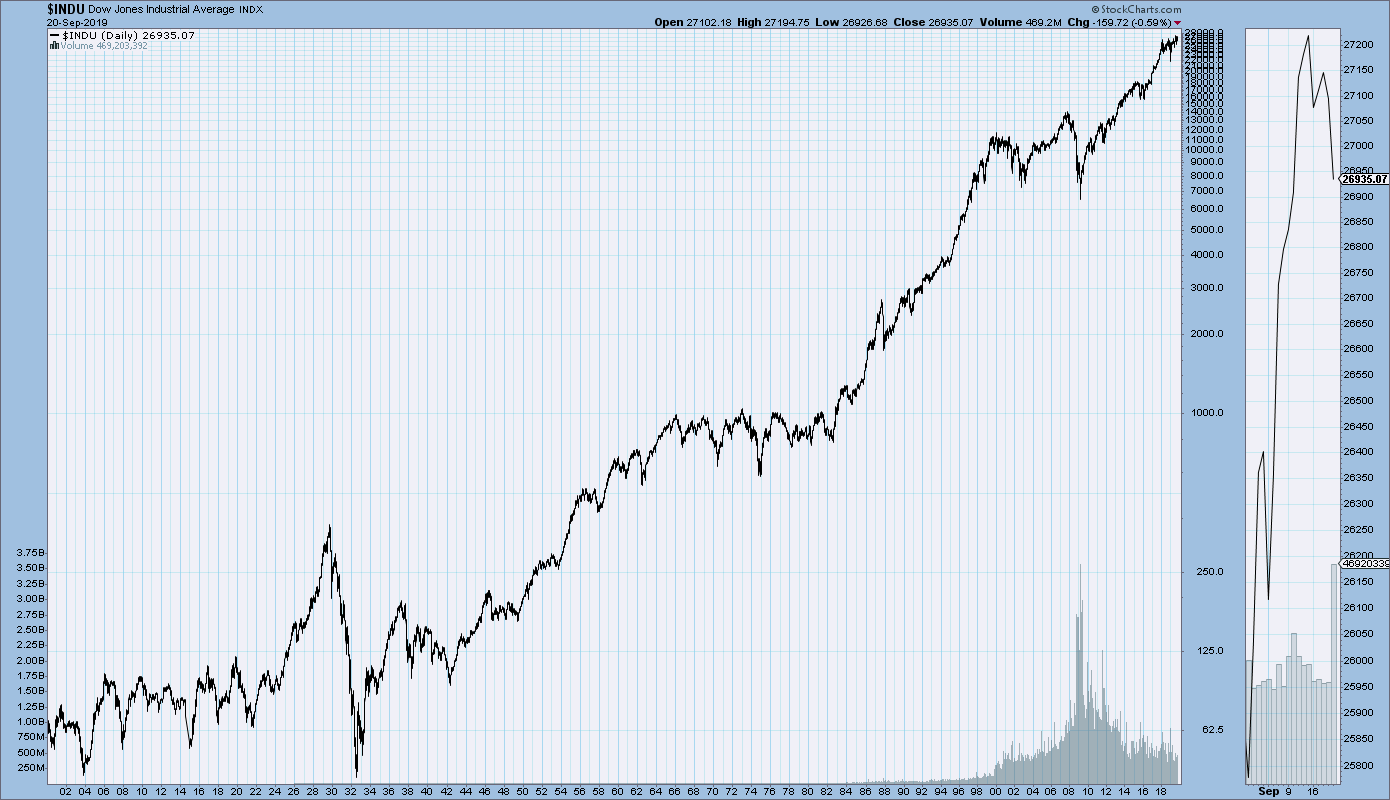
SPX at 2961.79 as this post is written

Friday, September 27, 2019

Consumer Confidence Surveys – As Of September 27, 2019

The Doug Short site had a post of September 27, 2019 (“Michigan Consumer Sentiment: Remains Favorable in September“) that displays the latest Conference Board Consumer Confidence and Thomson/Reuters University of Michigan Consumer Sentiment Index charts.  They are presented below:
(click on charts to enlarge images)
Conference Board Consumer Confidence
University of Michigan Consumer Sentiment
There are a few aspects of the above charts that I find highly noteworthy.  Of course, until the sudden upswing in 2014, the continued subdued absolute levels of these two surveys was disconcerting.
Also, I find the “behavior” of these readings to be quite disparate as compared to the other post-recession periods, as shown in the charts between the gray shaded areas (the gray areas denote recessions as defined by the NBER.)
While I don’t believe that confidence surveys should be overemphasized, I find these readings to be notable, especially in light of a variety of other highly disconcerting measures highlighted throughout this site.
_____
The Special Note summarizes my overall thoughts about our economic situation
SPX at 2959.89 as this post is written

Durable Goods New Orders – Long-Term Charts Through August 2019

Many people place emphasis on Durable Goods New Orders as a prominent economic indicator and/or leading economic indicator.
For reference, below are two charts depicting this measure.
First, from the St. Louis Fed site (FRED), a chart through August 2019, updated on September 27, 2019. This value is $250,670 ($ Millions):
(click on charts to enlarge images)
DGORDER 250670
Second, here is the chart depicting this measure on a “Percentage Change from a Year Ago” basis, with a last value of -3.0%:
DGORDER Percent Change From Year Ago
Data Source: FRED, Federal Reserve Economic Data, Federal Reserve Bank of St. Louis: Manufacturers’ New Orders:  Durable Goods [DGORDER]; U.S. Department of Commerce: Census Bureau; accessed September 27, 2019;
http://research.stlouisfed.org/fred2/series/DGORDER
_________
I post various indicators and indices because I believe they should be carefully monitored.  However, as those familiar with this site are aware, I do not necessarily agree with what they depict or imply.
_____
The Special Note summarizes my overall thoughts about our economic situation
SPX at 2959.51 as this post is written

Broad-Based Indicators Of Economic Activity

The Chicago Fed National Activity Index (CFNAI) and the Aruoba-Diebold-Scotti Business Conditions Index (ADS Index) are two broad-based economic indicators that I regularly feature in this site.
The short-term and long-term trends of each continue to be notable.
The post on the Doug Short site of September 26, 2019, titled “The Philly Fed ADS Index Business Conditions Index Update” displays both the CFNAI MA-3 (3-month Moving Average) and ADS Index (91-Day Moving Average) from a variety of perspectives.
Of particular note, two of the charts, shown below, denote where the current levels of each reading is relative to the beginning of past recessionary periods, as depicted by the red dots.
The CFNAI MA-3:
(click on charts to enlarge images)
CFNAIMA3
The ADS Index, 91-Day MA:
ADS Index
Also shown in the aforementioned post is a chart of each with a long-term trendline (linear regression) as well as a chart depicting GDP for comparison purposes.
_________
I post various indicators and indices because I believe they should be carefully monitored.  However, as those familiar with this site are aware, I do not necessarily agree with what they depict or imply.
_____
The Special Note summarizes my overall thoughts about our economic situation
SPX at 2977.62 as this post is written

Wednesday, September 25, 2019

Money Supply Charts Through August 2019

For reference purposes, below are two sets of charts depicting growth in the money supply.
The first shows the MZM (Money Zero Maturity), defined in FRED as the following:
M2 less small-denomination time deposits plus institutional money funds.
Money Zero Maturity is calculated by the Federal Reserve Bank of St. Louis.
Here is the “MZM Money Stock” (seasonally adjusted) chart, updated on September 19, 2019 depicting data through August 2019, with a value of $16,474.2 Billion:
MZMSL chart
Here is the “MZM Money Stock” chart on a “Percent Change From Year Ago” basis, with a current value of 5.9%:
MZMSL Percent Change From Year Ago
Data Source: FRED, Federal Reserve Economic Data, Federal Reserve Bank of St. Louis; accessed September 25, 2019;
https://research.stlouisfed.org/fred2/series/MZMSL
The second set shows M2, defined in FRED as the following:
M2 includes a broader set of financial assets held principally by households. M2 consists of M1 plus: (1) savings deposits (which include money market deposit accounts, or MMDAs); (2) small-denomination time deposits (time deposits in amounts of less than $100,000); and (3) balances in retail money market mutual funds (MMMFs). Seasonally adjusted M2 is computed by summing savings deposits, small-denomination time deposits, and retail MMMFs, each seasonally adjusted separately, and adding this result to seasonally adjusted M1.
Here is the “M2 Money Stock” (seasonally adjusted) chart, updated on September 19, 2019, depicting data through August 2019, with a value of $14,953.3 Billion:
M2SL chart
Here is the “M2 Money Stock” chart on a “Percent Change From Year Ago” basis, with a current value of 5.4%:
M2SL Percent Change From Year Ago chart
Data Source: FRED, Federal Reserve Economic Data, Federal Reserve Bank of St. Louis; accessed September 25, 2019;
https://research.stlouisfed.org/fred2/series/M2SL
_____
The Special Note summarizes my overall thoughts about our economic situation
SPX at 2984.06 as this post is written

Chicago Fed National Financial Conditions Index (NFCI)

The St. Louis Fed’s Financial Stress Index (STLFSI) is one index that is supposed to measure stress in the financial system.  Its reading as of the September 19, 2019 update (reflecting data through September 13, 2019) is -1.312.
Of course, there are a variety of other measures and indices that are supposed to measure financial stress and other related issues, both from the Federal Reserve as well as from private sources.
Two other indices that I regularly monitor include the Chicago Fed National Financial Conditions Index (NFCI) as well as the Chicago Fed Adjusted National Financial Conditions Index (ANFCI).
Here are summary descriptions of each, as seen in FRED:
The National Financial Conditions Index (NFCI) measures risk, liquidity and leverage in money markets and debt and equity markets as well as in the traditional and “shadow” banking systems. Positive values of the NFCI indicate financial conditions that are tighter than average, while negative values indicate financial conditions that are looser than average.
The adjusted NFCI (ANFCI). This index isolates a component of financial conditions uncorrelated with economic conditions to provide an update on how financial conditions compare with current economic conditions.
For further information, please visit the Federal Reserve Bank of Chicago’s web site:
Below are the most recently updated charts of the NFCI and ANFCI, respectively.
The NFCI chart below was last updated on September 25, 2019 incorporating data from January 8, 1971 through September 20, 2019, on a weekly basis.  The September 20 value is -.74:
NFCI chart
Data Source: FRED, Federal Reserve Economic Data, Federal Reserve Bank of St. Louis; accessed September 25, 2019: 
http://research.stlouisfed.org/fred2/series/NFCI
The ANFCI chart below was last updated on September 25, 2019 incorporating data from January 8, 1971 through September 20, 2019, on a weekly basis.  The September 20 value is -.69:
ANFCI
Data Source: FRED, Federal Reserve Economic Data, Federal Reserve Bank of St. Louis; accessed September 25, 2019: 
http://research.stlouisfed.org/fred2/series/ANFCI
_________
I post various indicators and indices because I believe they should be carefully monitored.  However, as those familiar with this site are aware, I do not necessarily agree with what they depict or imply.
_____
The Special Note summarizes my overall thoughts about our economic situation
SPX at 2966.60 as this post is written

Tuesday, September 24, 2019

The U.S. Economic Situation – September 24, 2019 Update

Perhaps the main reason that I write of our economic situation is that I continue to believe, based upon various analyses, that our economic situation is in many ways misunderstood.  While no one likes to contemplate a future rife with economic adversity, current and future economic problems must be properly recognized and rectified if high-quality, sustainable long-term economic vitality is to be realized.
There are an array of indications and other “warning signs” – many readily apparent – that current economic activity and financial market performance is accompanied by exceedingly perilous dynamics.
I have written extensively about this peril, including in the following:
Building Financial Danger” (ongoing updates)
My analyses continues to indicate that the growing level of financial danger will lead to the next stock market crash that will also involve (as seen in 2008) various other markets as well.  Key attributes of this next crash is its outsized magnitude (when viewed from an ultra-long term historical perspective) and the resulting economic impact.  This next financial crash is of tremendous concern, as my analyses indicate it will lead to a Super Depression – i.e. an economy characterized by deeply embedded, highly complex, and difficult-to-solve problems.
For long-term reference purposes, here is a chart of the Dow Jones Industrial Average since 1900, depicted on a monthly basis using a LOG scale (updated through September 20, 2019, with a last value of 26935.07):
(click on chart to enlarge image)(chart courtesy of StockCharts.com)
DJIA since 1900 chart
_____
The Special Note summarizes my overall thoughts about our economic situation
SPX at 2991.78 as this post is written

Updates Of Economic Indicators September 2019

Here is an update of various indicators that are supposed to predict and/or depict economic activity. These indicators have been discussed in previous blog posts:
The September 2019 Chicago Fed National Activity Index (CFNAI) updated as of September 23, 2019:
The CFNAI, with current reading of .10:
CFNAI
source:  Federal Reserve Bank of Chicago, Chicago Fed National Activity Index [CFNAI], retrieved from FRED, Federal Reserve Bank of St. Louis, September 23, 2019;
https://fred.stlouisfed.org/series/CFNAI
The CFNAI-MA3, with current reading of -.06:
CFNAIMA3
source:  Federal Reserve Bank of Chicago, Chicago Fed National Activity Index: Three Month Moving Average [CFNAIMA3], retrieved from FRED, Federal Reserve Bank of St. Louis, September 23, 2019;
https://fred.stlouisfed.org/series/CFNAIMA3
As of September 20, 2019 (incorporating data through September 13, 2019) the WLI was at 146.7 and the WLI, Gr. was at -1.5%.
A chart of the WLI,Gr., from the Doug Short’s site ECRI update post of September 20, 2019:
ECRI WLI,Gr.
Here is the latest chart, depicting the ADS Index from December 31, 2007 through September 14, 2019:
ADS Index
The Conference Board Leading (LEI), Coincident (CEI) Economic Indexes, and Lagging Economic Indicator (LAG):
As per the September 19, 2019 press release, titled “The Conference Board Leading Economic Index (LEI) for the U.S. Remained Unchanged in August” (pdf) the LEI was at 112.1, the CEI was at 106.4, and the LAG was 108.2 in August.
An excerpt from the release:
“The US LEI remained unchanged in August, following a large increase in July. Housing permits and the Leading Credit Index offset the weakness in the index from the manufacturing sector and the interest rate spread,” said Ataman Ozyildirim, Senior Director of Economic Research at The Conference Board. “The recent trends in the LEI are consistent with a slow but still expanding economy, which has been primarily driven by strong consumer spending and robust job growth.”
Here is a chart of the LEI from the Doug Short’s site Conference Board Leading Economic Index update of September 19, 2019:
Conference Board LEI
_________
I post various indicators and indices because I believe they should be carefully monitored.  However, as those familiar with this site are aware, I do not necessarily agree with what they depict or imply.
_____
The Special Note summarizes my overall thoughts about our economic situation
SPX at 2991.78 as this post is written

Total Household Net Worth As Of 2Q 2019 – Two Long-Term Charts

For reference purposes, here is Total Household Net Worth from a long-term perspective (from 1945:Q4 through 2019:Q2).  The last value (as of the September 23, 2019 update) is $113.462455 Trillion:
(click on each chart to enlarge image)
Total Household Net Worth
Also of interest is the same metric presented on a “Percent Change from a Year Ago” basis, with a current value of 4.9%:
Total Household Net Worth Percent Change From Year Ago
Data Source: FRED, Federal Reserve Economic Data, Board of Governors of the Federal Reserve System; accessed September 24, 2019;
http://research.stlouisfed.org/fred2/series/TNWBSHNO
_____
The Special Note summarizes my overall thoughts about our economic situation
SPX at 2991.78 as this post is written

Friday, September 20, 2019

Total Household Net Worth As A Percent Of GDP 2Q 2019

The following chart is from the CalculatedRisk post of September 20, 2019 titled “Fed Flow of Funds: Household Net Worth Increased in Q2.” It depicts Total Household Net Worth as a Percent of GDP.  The underlying data is from the Federal Reserve’s Z.1 report, “Financial Accounts of the United States“:
(click on chart to enlarge image)

Total Household Net Worth as a Percent of GDP

As seen in the above-referenced CalculatedRisk post:
The net worth of households and nonprofits rose to $113.5 trillion during the second quarter of 2019. The value of directly and indirectly held corporate equities increased $0.9 trillion and the value of real estate increased $0.3 trillion.
As I have written in previous posts concerning this Household Net Worth (as a percent of GDP) topic:
As one can see, the first outsized peak was in 2000, and attained after the stock market bull market / stock market bubbles and economic strength.  The second outsized peak was in 2007, right near the peak of the housing bubble as well as near the stock market peak.
also:
I could extensively write about various interpretations that can be made from this chart.  One way this chart can be interpreted is a gauge of “what’s in it for me?” as far as the aggregated wealth citizens are gleaning from economic activity, as measured compared to GDP.
_____
The Special Note summarizes my overall thoughts about our economic situation
SPX at 2991.75 as this post is written