Friday, April 30, 2021

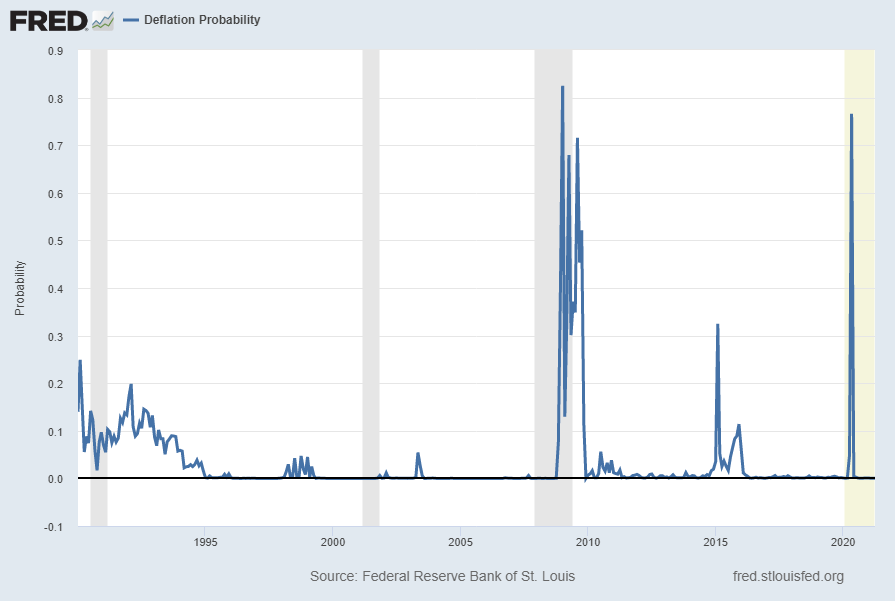
U.S. Deflation Probability Chart Through April 2021

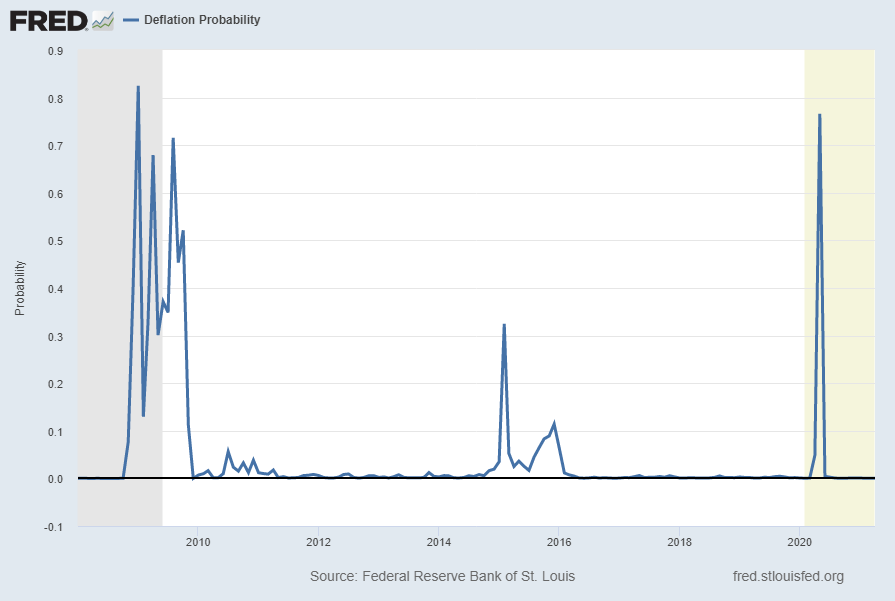
For reference, below is a chart of the St. Louis Fed Price Pressures Measures – Deflation Probability [FRED STLPPMDEF] through April 2021.

While I do not necessarily agree with the current readings of the measure, I view this as a proxy of U.S. deflation probability.

A description of this measure, as seen in FRED:

This series measures the probability that the personal consumption expenditures price index (PCEPI) inflation rate (12-month changes) over the next 12 months will fall below zero.

The chart, on a monthly basis from January 1990 – April 2021, with a last reading of .00010, last updated on April 30, 2021:

Deflation Probability chart

Here is this same U.S. deflation probability measure since 2008:

Deflation Probability chart from 2008

source:  Federal Reserve Bank of St. Louis, Deflation Probability [STLPPMDEF], retrieved from FRED, Federal Reserve Bank of St. Louis; accessed April 30, 2021: https://fred.stlouisfed.org/series/STLPPMDEF

_________

I post various economic indicators and indices because I believe they should be carefully monitored.  However, as those familiar with this site are aware, I do not necessarily agree with what they depict or imply.

_____

The Special Note summarizes my overall thoughts about our economic situation

SPX at 4181.17 as this post is written

Consumer Confidence Surveys – As Of April 30, 2021

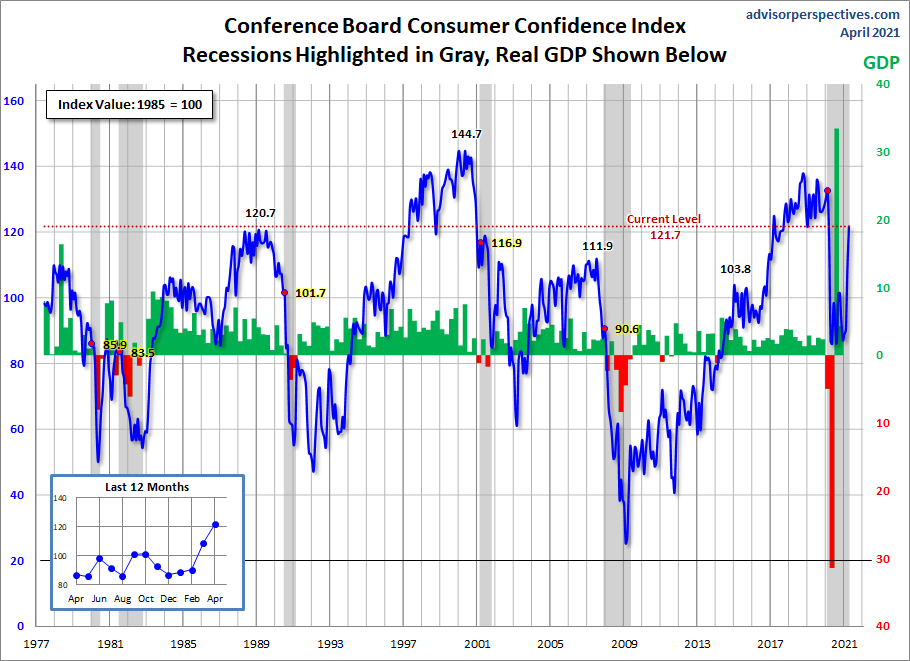
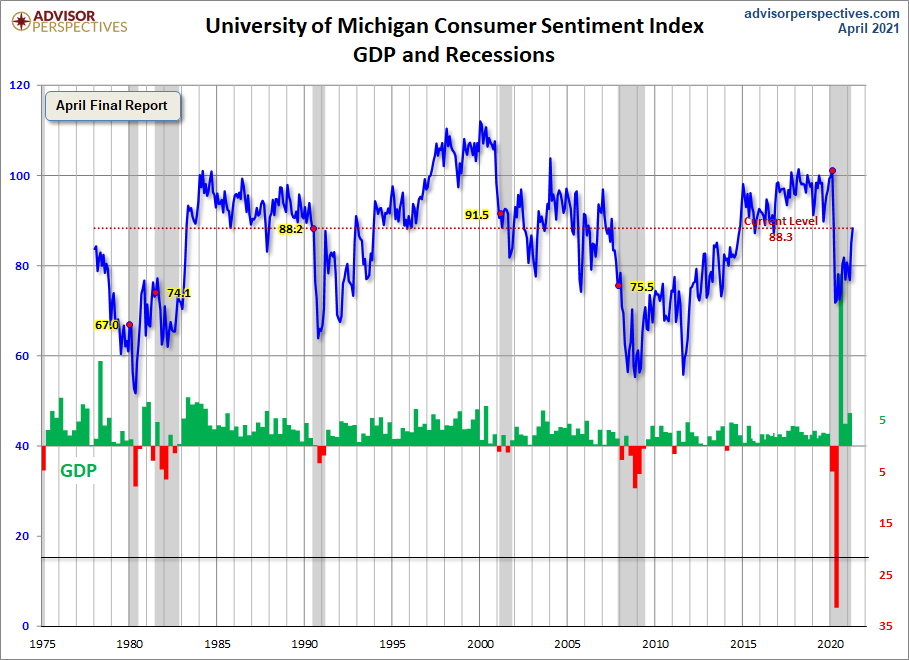
Advisor Perspectives had a post of April 30, 2021 (“Michigan Consumer Sentiment…“) that displays the latest Conference Board Consumer Confidence and Thomson/Reuters University of Michigan Consumer Sentiment Index charts.  They are presented below:

(click on charts to enlarge images)

Conference Board Consumer Confidence

University of Michigan Consumer Sentiment Index

While I don’t believe that confidence surveys should be overemphasized, I find these readings and trends to be notable, especially in light of a variety of other highly disconcerting measures highlighted throughout this site.

_____

The Special Note summarizes my overall thoughts about our economic situation

SPX at 4179.77 as this post is written

Employment Cost Index (ECI) – First Quarter 2021

While the concept of Americans’ incomes can be defined in a number of ways, many prominent measures continue to show disconcerting trends.

One prominent measure is the Employment Cost Index (ECI).

Here is a description from the BLS document titled “The Employment Cost Index:  what is it?“:

The Employment Cost Index (ECI) is a quarterly measure of the change in the price of labor, defined as compensation per employee hour worked. Closely watched by many economists, the ECI is an indicator of cost pressures within companies that could lead to price inflation for finished goods and services. The index measures changes in the cost of compensation not only for wages and salaries, but also for an extensive list of benefits. As a fixed-weight, or Laspeyres, index, the ECI controls for changes occurring over time in the industrial-occupational composition of employment.

On April 30, 2021, the ECI for the first quarter was released.  Here are two excerpts from the BLS release titled “Employment Cost Index – March 2021“:

Compensation costs for civilian workers increased 0.9 percent, seasonally adjusted, for the 3-month period ending in March 2021, the U.S. Bureau of Labor Statistics reported today. Wages and salaries increased 1.0 percent and benefit costs increased 0.6 percent from December 2020. (See tables A, 1, 2, and 3.)

also:

Compensation costs for civilian workers increased 2.6 percent for the 12-month period ending in March 2021 and increased 2.8 percent in March 2020. Wages and salaries increased 2.7 percent over the year and increased 3.1 percent for the 12-month period ending in March 2020. Benefit costs increased 2.5 percent over the year and increased 2.1 percent for the 12-month period ending in March 2020. (See tables A, 4, 8, and 12.)

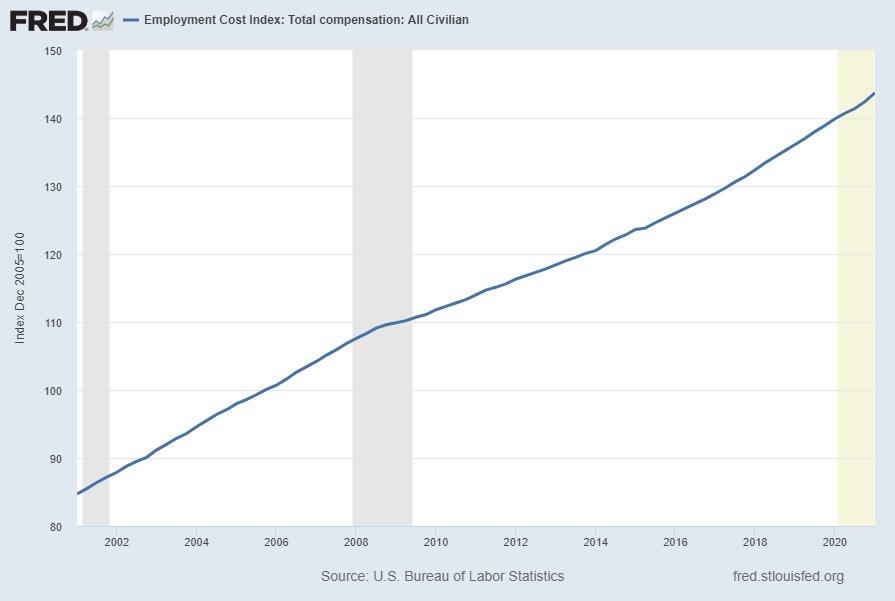
Below are three charts, updated on April 30, 2021 that depict various aspects of the ECI, which is seasonally adjusted (SA):

The first depicts the ECI, with a value of 143.7:

Employment Cost Index (ECI)

source: US. Bureau of Labor Statistics, Employment Cost Index: Total compensation: All Civilian [ECIALLCIV], retrieved from FRED, Federal Reserve Bank of St. Louis, accessed April 30, 2021: 
https://research.stlouisfed.org/fred2/series/ECIALLCIV/

The second chart depicts the ECI on a “Percent Change from Year Ago” basis, with a value of 2.7%:

Employment Cost Index (ECIALLCIV) Percent Change From Year Ago

The third chart depicts the ECI on a “Percent Change” (from last quarter) basis, with a value of .9%:

Employment Cost Index (ECI) Percent Change From Year Ago

_________

I post various indicators and indices because I believe they should be carefully monitored.  However, as those familiar with this site are aware, I do not necessarily agree with what they depict or imply.

_____

The Special Note summarizes my overall thoughts about our economic situation

SPX at 4211.87 as this post is written

Another Recession Probability Indicator – Updated Through Q4 2020

Each month I have been highlighting various estimates of U.S. recession probabilities.  The latest update was that of April 12, 2021, titled “Recession Probability Models – April 2021.”

While I don’t agree with the methodologies employed or the probabilities of impending economic weakness as depicted by these and other estimates, I do believe that the results of these models and estimates should be monitored.

Another probability of recession is provided by James Hamilton, and it is titled “GDP-Based Recession Indicator Index.”  A description of this index, as seen in FRED:

This index measures the probability that the U.S. economy was in a recession during the indicated quarter. It is based on a mathematical description of the way that recessions differ from expansions. The index corresponds to the probability (measured in percent) that the underlying true economic regime is one of recession based on the available data. Whereas the NBER business cycle dates are based on a subjective assessment of a variety of indicators that may not be released until several years after the event , this index is entirely mechanical, is based solely on currently available GDP data and is reported every quarter. Due to the possibility of data revisions and the challenges in accurately identifying the business cycle phase, the index is calculated for the quarter just preceding the most recently available GDP numbers. Once the index is calculated for that quarter, it is never subsequently revised. The value at every date was inferred using only data that were available one quarter after that date and as those data were reported at the time.

If the value of the index rises above 67% that is a historically reliable indicator that the economy has entered a recession. Once this threshold has been passed, if it falls below 33% that is a reliable indicator that the recession is over.

Additional reference sources for this index and its construction can be seen in the Econbrowser post of February 14, 2016 titled “Recession probabilities” as well as on the “The Econbrowser Recession Indicator Index” page.

Below is a chart depicting the most recent value of .40000% for the fourth quarter of 2020, last updated on April 29, 2021 (after the April 29, 2021 Gross Domestic Product, First Quarter 2021 (Advance Estimate):

GDP-Based Recession Indicator Index [JHGDPBRINDX]

source:  Hamilton, James, GDP-Based Recession Indicator Index [JHGDPBRINDX], retrieved from FRED, Federal Reserve Bank of St. Louis on April 30, 2021: 
https://research.stlouisfed.org/fred2/series/JHGDPBRINDX

_________

I post various indicators and indices because I believe they should be carefully monitored.  However, as those familiar with this site are aware, I do not necessarily agree with what they depict or imply.

_____

The Special Note summarizes my overall thoughts about our economic situation

SPX at 4211.47 as this post is written

Thursday, April 29, 2021

Jerome Powell’s April 28, 2021 Press Conference – Notable Aspects

On Wednesday, April 28, 2021 FOMC Chairman Jerome Powell gave his scheduled April 2021 FOMC Press Conference. (link of video and related materials)

Below are Jerome Powell’s comments I found most notable – although I don’t necessarily agree with them – in the order they appear in the transcript.  These comments are excerpted from the “Transcript of Chairman Powell’s Press Conference“ (preliminary)(pdf) of April 28, 2021, with the accompanying “FOMC Statement.”

Excerpts from Chairman Powell’s opening comments:

Today my colleagues on the FOMC and I kept interest rates near zero and maintained our sizable asset purchases.  These measures, along with our strong guidance on interest rates and on our balance sheet, will ensure that monetary policy will continue to deliver powerful support to the economy until the recovery is complete.

Widespread vaccinations, along with unprecedented fiscal policy actions, are also providing strong support to the recovery.  Since the beginning of the year, indicators of economic activity and employment have strengthened.  Household spending on goods has risen robustly.  The housing sector has more than fully recovered from the downturn, while business investment and manufacturing production have also increased.  Spending on services has also picked up, including at restaurants and bars.  More generally, the sectors of the economy most adversely affected by the pandemic remain weak but have shown improvement.  While the recovery has progressed more quickly than generally expected, it remains uneven and far from complete.

also:

Readings on inflation have increased and are likely to rise somewhat further before moderating.  In the near term, 12-month measures of PCE inflation are expected to move above 2 percent as the very low readings from early in the pandemic fall out of the calculation and past increases in oil prices pass through to consumer energy prices.  Beyond these effects, we are also likely to see upward pressure on prices from the rebound in spending as the economy continues to reopen, particularly if supply bottlenecks limit how quickly production can respond in the near term.  However, these one-time increases in prices are likely to have only transitory effects on inflation.

The Fed’s response to this crisis has been guided by our mandate to promote maximum employment and stable prices for the American people, along with our responsibilities to promote the stability of the financial system.  As we say in our Statement on Longer-Run Goals and Monetary Policy Strategy, we view maximum employment as a broad-based and inclusive goal.  Our ability to achieve maximum employment in the years ahead depends importantly on having longer-term inflation expectations well anchored at 2 percent.

As the Committee reiterated in today’s policy statement, with inflation running persistently below 2 percent, we will aim to achieve inflation moderately above 2 percent for some time so that inflation averages 2 percent over time and longer-term inflation expectations remain well anchored at 2 percent.  We expect to maintain an accommodative stance of monetary policy until these employment and inflation outcomes are achieved.  With regard to interest rates, we continue to expect it will be appropriate to maintain the current 0 to ¼ percent target range for the federal funds rate until labor market conditions have reached levels consistent with the Committee’s assessment of maximum employment and inflation has risen to 2 percent and is on track to moderately exceed 2 percent for some time.  I would note that a transitory rise in inflation above 2 percent this year would not meet this standard.

In addition, we will continue to increase our holdings of Treasury securities by at least $80 billion per month and of agency mortgage-backed securities by at least $40 billion per month until substantial further progress has been made toward our maximum-employment and price-stability goals.  The increase in our balance sheet since March 2020 has materially eased financial conditions and is providing substantial support to the economy.  The economy is a long way from our goals, and it is likely to take some time for substantial further progress to be achieved.

Excerpts of Jerome Powell’s responses as indicated to various questions:

VICTORIA GUIDA. Hi, Chair Powell. I wanted to ask. You’ve talked a lot during this crisis about the need to have a lot of help from fiscal policy and monetary policy to make sure that there’s not long term scarring in the economy, and I was just wondering, you know, given all the policies that have been put in place, do you expect there to still be some long term scarring, and if so, you know, what are you most worried about? Where are you most worried about that showing up? 

CHAIR POWELL. So, I would say that we were very worried about scarring, both in the labor market from people being out of the labor market for an extended period of time. The evidence is clear that it becomes much more difficult if you’re out for a long time to get back in and get back to the life that you had. Same thing with these small businesses, many of which are the work of generations. Were we going to wipe out many of those unnecessarily? That was a big concern. I would say that so far, you know, here we are in late April of 2021. We haven’t experienced that level of scarring either in the labor market or among smaller businesses. So, we’re not living that downside case that we were very concerned about a year ago. Notwithstanding that, we’re a long way from full employment. We’re, you know, payroll jobs are 8.4 million below where they were in February of 2020. We’ve got a long ways to go, and also, it’s going to be a different economy. So, we’ve been hearing a lot from companies that they are, they’ve been looking at deploying better technology and perhaps fewer people, including some of the service industries that have been employing a lot of people. You know, it may well be, it seems quite likely that a number of the people who had those service sector jobs will struggle to find the same job and may need time to find work and get back to the working life they had. These were people who were working in February of 2020. They clearly want to work. So, those people are going to need, they’re going to need help, and so while I would say we haven’t seen really highly elevated levels of unemployment for, you know, up in the teens that we thought we might have for an extended period of time, we’ve still got a lot of people who are out of work. We want to get them back to work as quickly as possible, and that’s really one of the things we’re trying to achieve with our policy. 

RACHEL SIEGEL. Thank you, Michelle, and thank you Chair Powell for taking our questions. The housing market in many American cities is seeing booming prices, bidding wars, and all cash offers well above asking price, and this is happening at the same time that housing is becoming much more expensive for lower income Americans and people who are still struggling from the pandemic. Do you have concerns that there are localized housing bubbles, that there’s the potential for that, and what is the Fed doing to monitor or address this? Thank you. 

CHAIR POWELL. So, we do monitor the housing market very carefully, of course, and I would say that before the pandemic, it’s a very different housing market than it was before the global financial crisis. And one of the main differences was that households were in very good shape financially compared to where they were. In addition, most people who got mortgages were people with pretty high credit scores. There wasn’t the subprime, you know, low doc no doc lending practices were not there. So, we don’t have that kind of thing where we have a housing bubble where people are over levered and owning a lot of houses. There’s no question, though, that housing prices are going up, and so we’re watching that carefully. It’s partly because there’s clearly strong demand, and there’s just not a lot of supply right now. So, builders are, you know, struggling to keep up with the demand, clearly, and inventories are tremendously low. We’re all hearing those stories, and if you’re, you know, if you’re an entry level housing buyer, this is a problem because it just is going to be that much harder for people to get that first house. And that’s a problem. I mean, we, it’s part of a strong economy with people having money to spend and wanting to invest in housing. So, in that sense, it’s good. It’s clearly the strongest housing market that we’ve seen since the global financial crisis. And, you know, my hope would be that over time, housing builders can react to this demand and come up with more supply and workers will come back to work in that industry. So, you know, it is not an unalloyed good to have prices going up this much, and we’re watching it very carefully. I don’t see the kind of financial stability current concerns, though, that really do reside around the housing sector. So many of the financial crackups in all countries, all western countries that have happened in the last 30 years have been around housing. We don’t, we really don’t see that here. We don’t see bad loans and unsustainable prices and that kind of thing. 

also:

BRIAN CHEUNG. Brian Cheung with, yeah. Hi, Chairman Powell. Brian Cheung with Yahoo Finance. I wanted to ask about financial stability which is a part of the Fed’s reaction function here. It seems like to people on the outside who might not follow finance daily, they’re paying attention to things like GameStop, now Dogecoin. And it seems like there’s interesting reach for yield in this market to some extent also Archegos. So, does the Fed see a relationship between low rates and easy policy to those things, and is there a financial stability concern from the Fed’s perspective at this time? 

CHAIR POWELL. Right. So, we look at financial stability for us is really, we have a broad framework. So, we don’t just jump from one thing to another. I know many people just look at asset prices, and they look at some of the things that are going on in the equity markets, which I think to reflect froth in the equity markets. But really, we try to stick to a framework for financial stability so we can talk about it the same way each time and so we can be held accountable for it. So, one of the areas is asset prices, and I would say some of the asset prices are high. You are seeing things in a capital markets that are a bit frothy. That’s a fact. I won’t say it has nothing to do with monetary policy, but it also, it has a tremendous amount to do with vaccination and reopening of the economy. That’s really what has been moving markets a lot in the last few months is this turn away from what was a pretty dark winter to now a vast, a much faster vaccination process and a faster reopening. So, that’s part of what’s going on. The other things, though, you know, leverage in the financial system is not a problem. That was one of the four pillars. Asset prices was one. Leverage in the financial system is not an issue. We have very well capitalized large banks. We have funding risks for our largest financial institutions. They’re also very low. We do have some funding risk issues around money market funds, but I would say they’re not systemic right now. And the household sector is actually in pretty good shape. It was in very good shape as a relative matter before the financial crisis, sorry, the pandemic crisis hit. They were real concerns, of course, with high levels of unemployment and loss of wages and all that that the household sector would weaken dramatically. That hasn’t happened. So, with the fiscal transfers, money that’s on household balance sheets, they’re in good shape. You see relatively low defaults and that kind of thing. So, the overall financial stability picture is mixed, but on balance, it’s, you know, it’s manageable I would say, and it’s, by the way, I think it’s appropriate and important for financial conditions to remain accommodative, to support economic activity. Again, eight and a half million people who had jobs in February don’t have them now, and you know, there’s a long way to go until we reach our goal. So, that’s what I would say.

also:

MICHAEL MCKEE. Thank you, Mr. Chairman. Since I am last, let me go back to Paul’s question, the first question and as him, and ask you whether, not whether you’re thinking about thinking about tapering but why you’re not. We’re seeing bank lending fall. The markets seem to be operating well. Are you afraid of a taper tantrum, or is it as one money manager put it, if you get out of the markets, there aren’t enough buyers for all of the Treasury debt? And so, rates would have to go way up. Bottom line question is what do we get for $120 billion a month that we couldn’t get for less? 

CHAIR POWELL. So, it’s really not more complicated than this. We articulated the substantial for the progress test in our December meeting, and really for the next couple of months, we made relatively little progress toward our goals. And remember, substantial further progress from December, our December meeting. And then, vaccination started to get more widespread. The economy reopened. We got a really nice job report for March. It doesn’t constitute substantial further progress. It’s not close to substantial further progress. We’re hopeful that we will see along this path a way to that goal, and we believe we will. Just is a question of when. And so, when that time, when the time comes for us to talk about talking about it, we’ll do that. And but that time is not now. It’s, we’re just not, we’re not that far. We’ve had one great jobs report. It’s not enough. You know, we’re going to act on actual data. Not on a forecast, and we’re just going to need to see more data. It’s no more complicated than that. 

MICHAEL MCKEE. [inaudible] rates where they are doesn’t change anything, but does it change anything if you actually tapered a bit, if you spent less? Would you still get the same effect out of the economy? 

CHAIR POWELL. If we bought less? You’re very faint. So, if someone has the volume, they can turn it up. But if we bought less, you know, no. I mean, I think the effect is proportional to the amount we buy. It’s really part of overall accommodative financial conditions. We have tried to create accommodative financial conditions to support economic activity, and we did that. And we articulated the, you know, the test for withdrawing that accommodation. And we think, you know. So, we’re waiting to see those tests to be fulfilled, both for asset purchases and for lift off of rates. And, you know, when the tests are fulfilled, we’ll go ahead as, you know, we’ve done this before. We did it in the last, after the last crisis, and you know, we’ll do it in maybe, we’ll do it as those tests are satisfied, we’ll do it. And the only thing that will guide us is are the tests met? You know, that’s what we focused on is have the macroeconomic conditions that we’ve articulated, have they been realized? That will be the test for tapering asset purchases and for raising interest rates.

_____

_____

The Special Note summarizes my overall thoughts about our economic situation

SPX at 4214.61 as this post is written 
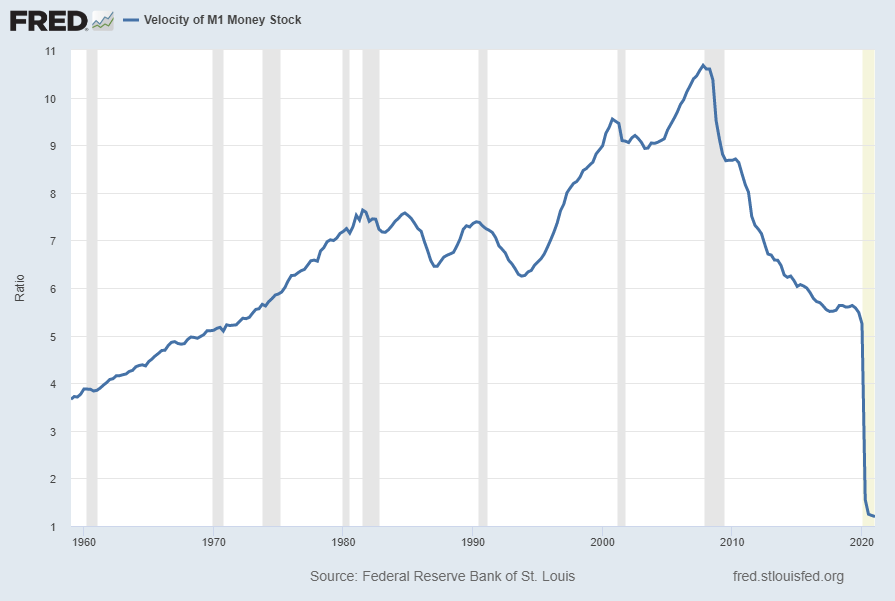
Velocity Of Money – Charts Updated Through April 29, 2021

Here are two charts from the St. Louis Fed depicting the velocity of money in terms of the M1 and M2 money supply measures.

All charts reflect quarterly data through the 1st quarter of 2021, and were last updated as of April 29, 2021.

Velocity of M1 Money Stock, current value = 1.198:

M1V 1.198

Data Source: FRED, Federal Reserve Economic Data, Federal Reserve Bank of St. Louis; accessed April 29, 2021: 
http://research.stlouisfed.org/fred2/series/M1V

Velocity of M2 Money Stock, current value = 1.123:

M2V 1.123

Data Source: FRED, Federal Reserve Economic Data, Federal Reserve Bank of St. Louis; accessed April 29, 2021: 
http://research.stlouisfed.org/fred2/series/M2V

_________

I post various indicators and indices because I believe they should be carefully monitored.  However, as those familiar with this site are aware, I do not necessarily agree with what they depict or imply.

_____

The Special Note summarizes my overall thoughts about our economic situation

SPX at 4197.78 as this post is written

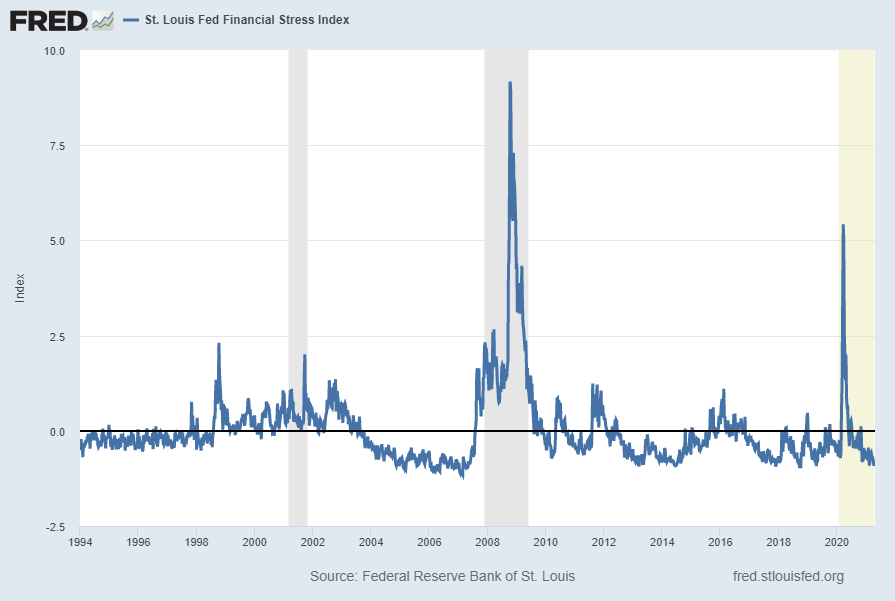
Chicago Fed National Financial Conditions Index (NFCI)

The St. Louis Fed’s Financial Stress Index (STLFSI2) is one index that is supposed to measure stress in the financial system. Its reading as of the April 29, 2021 update (reflecting data through April 23, 2021) is -.8052:

STLFSI2

source: Federal Reserve Bank of St. Louis, St. Louis Fed Financial Stress Index [STLFSI2], retrieved from FRED, Federal Reserve Bank of St. Louis; accessed April 29, 2021: https://fred.stlouisfed.org/series/STLFSI2

Of course, there are a variety of other measures and indices that are supposed to measure financial stress and other related issues, both from the Federal Reserve as well as from private sources.

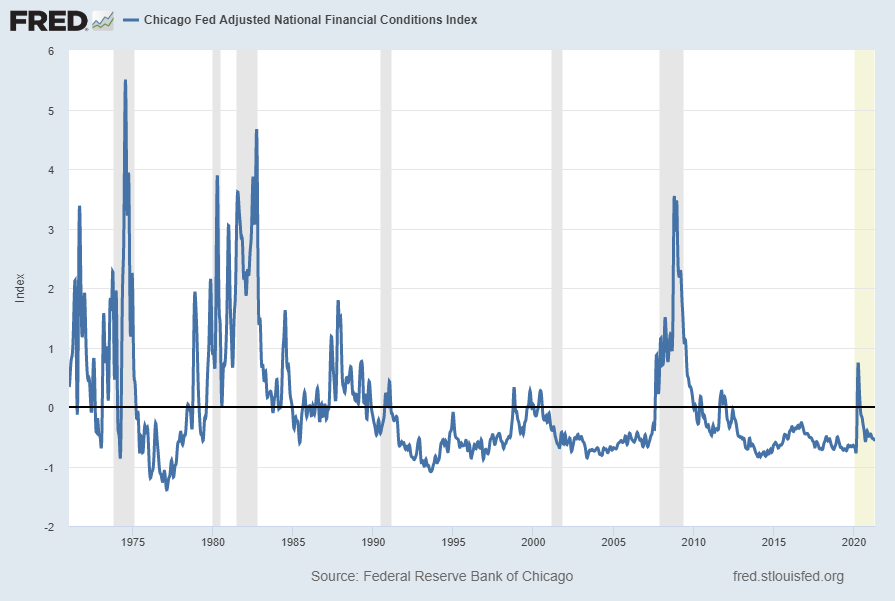
Two other indices that I regularly monitor include the Chicago Fed National Financial Conditions Index (NFCI) as well as the Chicago Fed Adjusted National Financial Conditions Index (ANFCI).

Here are summary descriptions of each, as seen in FRED:

The National Financial Conditions Index (NFCI) measures risk, liquidity and leverage in money markets and debt and equity markets as well as in the traditional and “shadow” banking systems. Positive values of the NFCI indicate financial conditions that are tighter than average, while negative values indicate financial conditions that are looser than average.

The adjusted NFCI (ANFCI). This index isolates a component of financial conditions uncorrelated with economic conditions to provide an update on how financial conditions compare with current economic conditions.

For further information, please visit the Federal Reserve Bank of Chicago’s web site:

http://www.chicagofed.org/webpages/publications/nfci/index.cfm

Below are the most recently updated charts of the NFCI and ANFCI, respectively.

The NFCI chart below was last updated on April 28, 2021 incorporating data from January 8, 1971 through April 23, 2021, on a weekly basis.  The April 23 value is -.68461:

NFCI

Data Source: FRED, Federal Reserve Economic Data, Federal Reserve Bank of St. Louis; accessed April 29, 2021:  
http://research.stlouisfed.org/fred2/series/NFCI

The ANFCI chart below was last updated on April 28, 2021 incorporating data from January 8, 1971 through April 23, 2021, on a weekly basis.  The April 23, 2021 value is -.54431:

ANFCI

Data Source: FRED, Federal Reserve Economic Data, Federal Reserve Bank of St. Louis; accessed April 29, 2021:  
http://research.stlouisfed.org/fred2/series/ANFCI

_________

I post various indicators and indices because I believe they should be carefully monitored.  However, as those familiar with this site are aware, I do not necessarily agree with what they depict or imply.

_____

The Special Note summarizes my overall thoughts about our economic situation

SPX at 4192.18 as this post is written

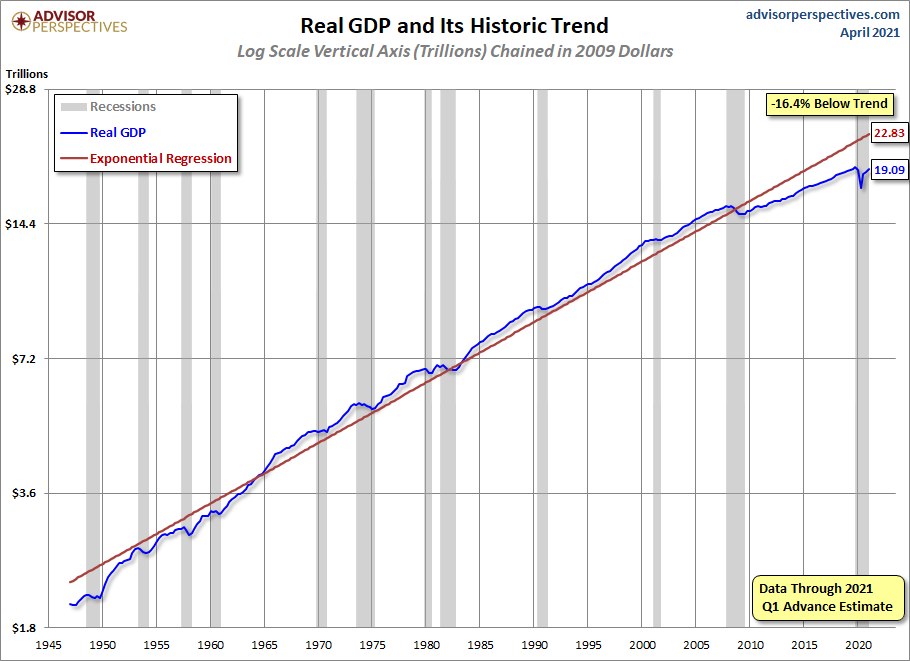
Real GDP Chart Since 1947 With Trendline – 1st Quarter 2021

For reference purposes, below is a chart from the Advisor Perspectives’ post of April 29, 2021 titled “Q1 GDP Advance Estimate: Real GDP at 6.4%…,” reflecting Real GDP, with a trendline, as depicted.  This chart incorporates the Gross Domestic Product, First Quarter 2021 (Advance Estimate) of April 29, 2021:

Real GDP since 1947

_________

I post various indicators and indices because I believe they should be carefully monitored.  However, as those familiar with this site are aware, I do not necessarily agree with what they depict or imply.

_____

The Special Note summarizes my overall thoughts about our economic situation

SPX at 4206.34 as this post is written

Tuesday, April 27, 2021

Money Supply Charts Through March 2021

For reference purposes, below are two sets of charts depicting growth in the money supply.

The first shows the M1, defined in FRED as the following:

Before May 2020, M1 consists of (1) currency outside the U.S. Treasury, Federal Reserve Banks, and the vaults of depository institutions; (2) demand deposits at commercial banks (excluding those amounts held by depository institutions, the U.S. government, and foreign banks and official institutions) less cash items in the process of collection and Federal Reserve float; and (3) other checkable deposits (OCDs), consisting of negotiable order of withdrawal, or NOW, and automatic transfer service, or ATS, accounts at depository institutions, share draft accounts at credit unions, and demand deposits at thrift institutions.

Beginning May 2020, M1 consists of (1) currency outside the U.S. Treasury, Federal Reserve Banks, and the vaults of depository institutions; (2) demand deposits at commercial banks (excluding those amounts held by depository institutions, the U.S. government, and foreign banks and official institutions) less cash items in the process of collection and Federal Reserve float; and (3) other liquid deposits, consisting of OCDs and savings deposits (including money market deposit accounts). Seasonally adjusted M1 is constructed by summing currency, demand deposits, and OCDs (before May 2020) or other liquid deposits (beginning May 2020), each seasonally adjusted separately.

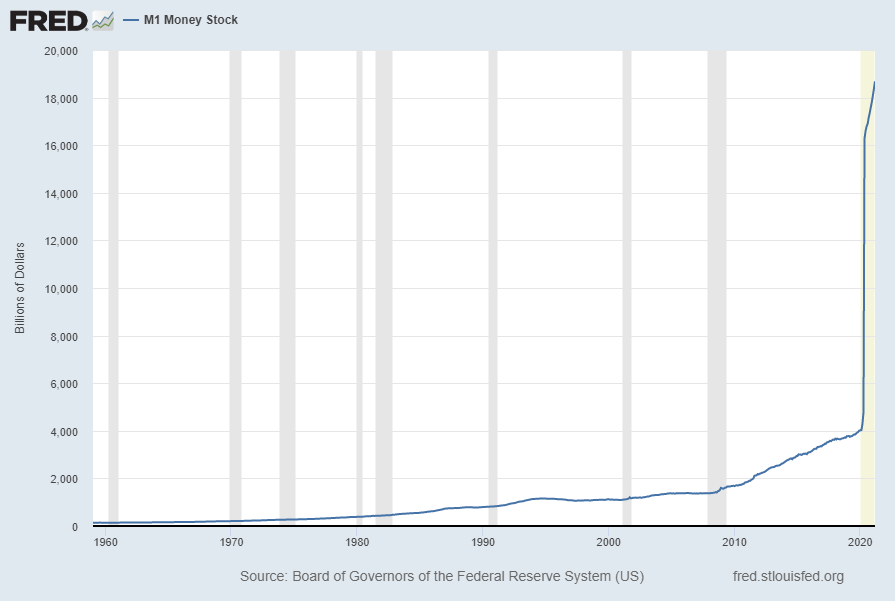
Here is the “M1 Money Stock” (seasonally adjusted) chart, updated on April 27, 2021 depicting data through March 2021, with a value of $18,682.9 Billion:

M1 Money Stock 18682.9

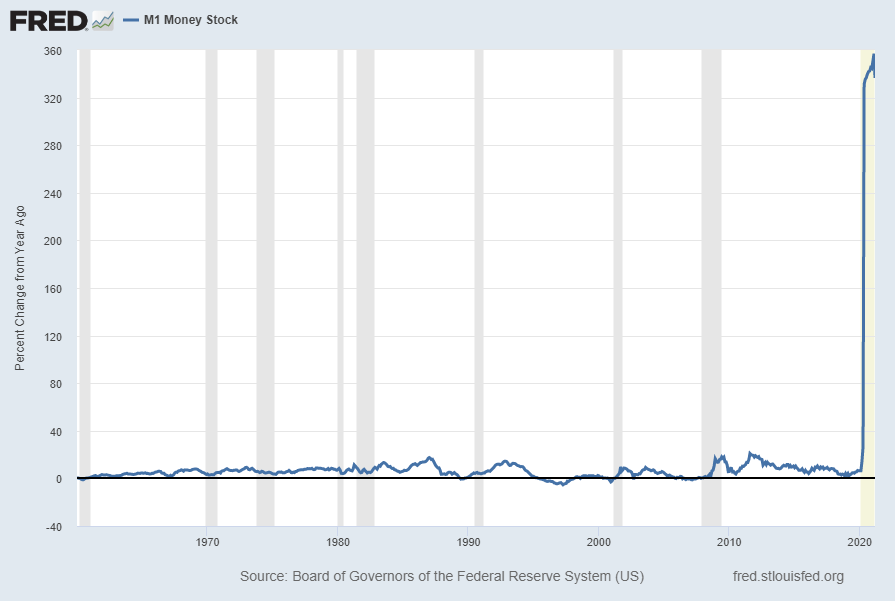
Here is the “M1 Money Stock” chart on a “Percent Change From Year Ago” basis, with a current value of 336.5%:

M1 Money Stock 336.5 Percent Change From Year Ago

The second set shows M2, defined in FRED as the following:

Before May 2020, M2 consists of M1 plus (1) savings deposits (including money market deposit accounts); (2) small-denomination time deposits (time deposits in amounts of less than $100,000) less individual retirement account (IRA) and Keogh balances at depository institutions; and (3) balances in retail money market funds (MMFs) less IRA and Keogh balances at MMFs.

Beginning May 2020, M2 consists of M1 plus (1) small-denomination time deposits (time deposits in amounts of less than $100,000) less IRA and Keogh balances at depository institutions; and (2) balances in retail MMFs less IRA and Keogh balances at MMFs. Seasonally adjusted M2 is constructed by summing savings deposits (before May 2020), small-denomination time deposits, and retail MMFs, each seasonally adjusted separately, and adding this result to seasonally adjusted M1.

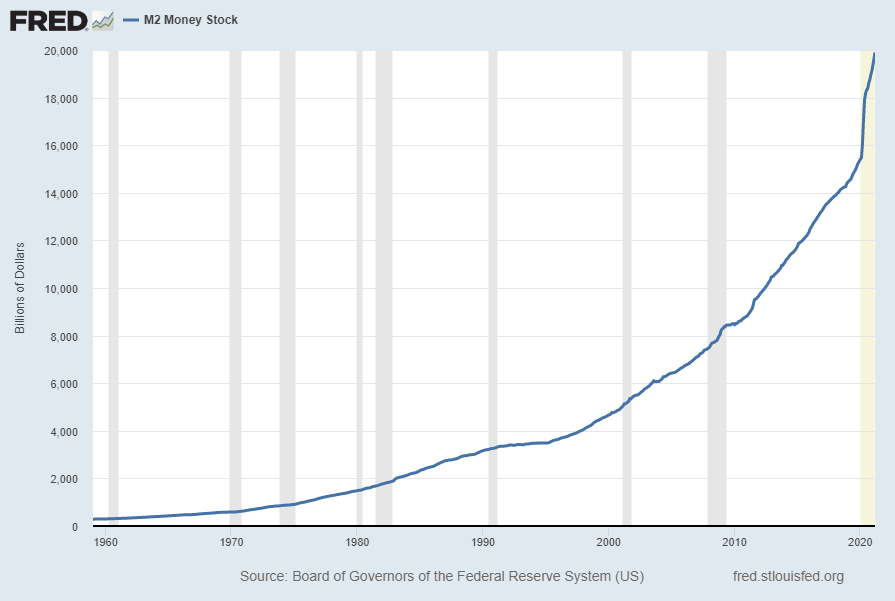
Here is the “M2 Money Stock” (seasonally adjusted) chart, updated on April 27, 2021, depicting data through March 2021, with a value of $19,896.2 Billion:

M2 Money Stock 19896.2

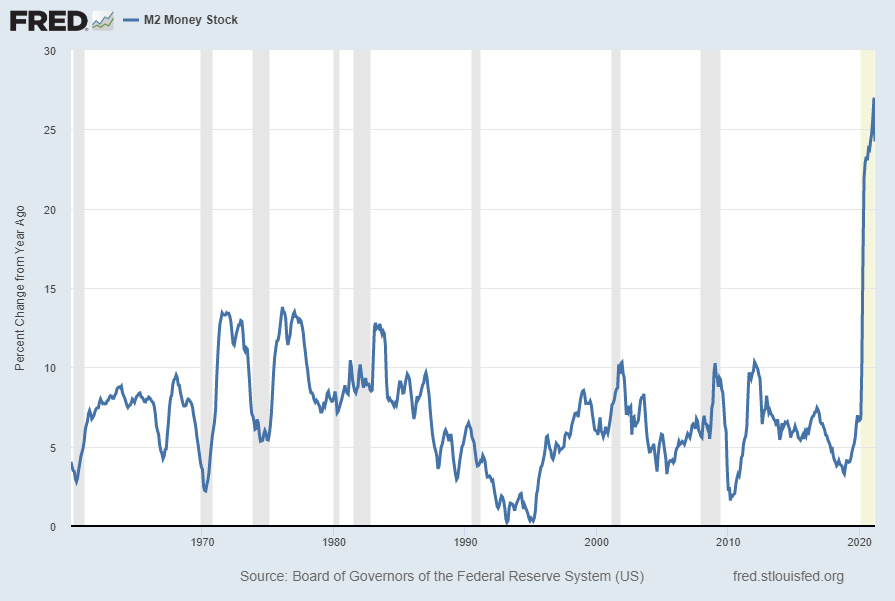
Here is the “M2 Money Stock” chart on a “Percent Change From Year Ago” basis, with a current value of 24.2%:

M2 Money Stock 24.2 Percent Change From Year Ago

Data Source: FRED, Federal Reserve Economic Data, Federal Reserve Bank of St. Louis; accessed April 27, 2021; 
https://research.stlouisfed.org/fred2/series/M2SL

_____

The Special Note summarizes my overall thoughts about our economic situation

SPX at 4184.75 as this post is written