Friday, September 28, 2018

Consumer Confidence Surveys – As Of September 28, 2018

The Doug Short site had a post of September 28, 2018 (“Michigan Consumer Sentiment:  September Final Remains High“) that displays the latest Conference Board Consumer Confidence and Thomson/Reuters University of Michigan Consumer Sentiment Index charts.  They are presented below:
(click on charts to enlarge images)
Conference Board Consumer Confidence Index
University of Michigan Consumer Sentiment Index
There are a few aspects of the above charts that I find highly noteworthy.  Of course, until the sudden upswing in 2014, the continued subdued absolute levels of these two surveys was disconcerting.
Also, I find the “behavior” of these readings to be quite disparate as compared to the other post-recession periods, as shown in the charts between the gray shaded areas (the gray areas denote recessions as defined by the NBER.)
While I don’t believe that confidence surveys should be overemphasized, I find these readings to be very problematical, especially in light of a variety of other highly disconcerting measures highlighted throughout this site.
_____
The Special Note summarizes my overall thoughts about our economic situation
SPX at 2913.98 as this post is written

Long-Term Charts Of The ECRI WLI & ECRI WLI, Gr. – September 28, 2018 Update

As I stated in my July 12, 2010 post (“ECRI WLI Growth History“):
For a variety of reasons, I am not as enamored with ECRI’s WLI and WLI Growth measures as many are.
However, I do think the measures are important and deserve close monitoring and scrutiny.
Below are three long-term charts, from the Doug Short site’s ECRI update post of September 28, 2018 titled “ECRI Weekly Leading Index Update.”  These charts are on a weekly basis through the September 28, 2018 release, indicating data through September 21, 2018.
Here is the ECRI WLI (defined at ECRI’s glossary):
ECRI WLI 148.5
This next chart depicts, on a long-term basis, the Year-over-Year change in the 4-week moving average of the WLI:
ECRI WLI YoY of the Four-Week Moving Average
This last chart depicts, on a long-term basis, the WLI, Gr.:
ECRI WLI, Gr. .4
_________
I post various economic indicators and indices because I believe they should be carefully monitored.  However, as those familiar with this site are aware, I do not necessarily agree with what they depict or imply.
_____
The Special Note summarizes my overall thoughts about our economic situation
SPX at 2913.85 as this post is written

Thursday, September 27, 2018

Jerome Powell’s September 26, 2018 Press Conference – Notable Aspects

On Wednesday, September 26, 2018 Jerome Powell gave his scheduled September 2018 FOMC Press Conference. (link of video and related materials)
Below are Jerome Powell’s comments I found most notable – although I don’t necessarily agree with them – in the order they appear in the transcript.  These comments are excerpted from the “Transcript of Chairman Powell’s Press Conference“ (preliminary)(pdf) of September 26, 2018, with the accompanying “FOMC Statement” and “Economic Projections of Federal Reserve Board Members and Federal Reserve Bank Presidents, September 2018“ (pdf).
From Chairman Powell’s opening comments:
Our economy is strong.  Growth is running at a healthy clip.  Unemployment is low, the number of people working is rising steadily, and wages are up.  Inflation is low and stable.  All of these are very good signs.  Of course, that’s not say that everything is perfect.  The benefits of this strong economy have not reached all Americans.  Many of our country’s economic challenges are beyond the scope of the Fed, but my colleagues and I are doing all we can to keep the economy strong, healthy, and moving forward.  That is the best way we can promote an environment in which every American has the opportunity to succeed.
also:
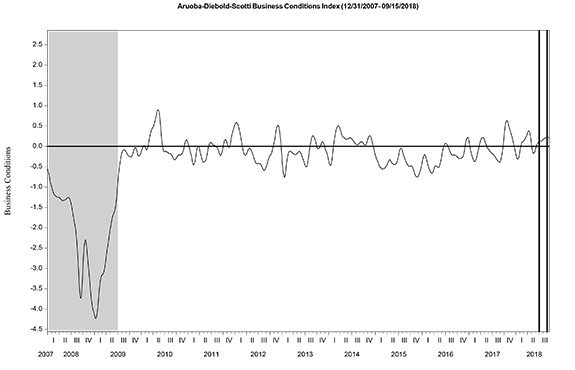
Both household spending and business investment are expanding briskly, and the overall growth outlook remains favorable.  Several factors support this assessment:  Fiscal policy is boosting the economy, ongoing job gains are raising incomes and confidence, and overall financial conditions remain accommodative.  These conditions are consistent with our Summary of Economic Projections for this meeting.  The median of Committee participants’ projections for the growth of real GDP is 3.1 percent this year and 2.5 percent next year.
Job gains averaged 185,000 per month over the last three months, well above the pace needed in the longer run to provide jobs for new entrants to the labor force.  The unemployment rate stood at 3.9 percent in August, and has been near that level since April.  Smoothing through month-to-month variations, the labor force participation rate remains about where it was in late 2013–a positive sign, given that the aging of our population is putting downward pressure on participation.  We expect the job market to remain strong.  And the median of Committee participants’ projections for the unemployment rate later this year is 3.7 percent, and a bit lower than that in 2019.
also:
Today the Committee raised the target range for the federal funds rate by 1/4 percentage point, bringing it to 2 to 2-1/4 percent.  This action reflects the strength we see in the economy, and is one more step in the process that we began almost three years ago of gradually returning interest rates to more normal levels.  Looking ahead, today’s projections show gradual interest rate increases continuing roughly as foreseen in June.  The median of the participants’ views on appropriate policy through 2020 are unchanged since the June meeting.
Jerome Powell’s responses as indicated to the various questions:
SAM FLEMING. Thanks very much. Sam Fleming from the Financial Times. The Fed has recently been saying that financial stability risks are moderate. What kind of developments could prompt a change in that assessment to elevated risks? And is there an argument for moving the counter cyclical capital buffer, even when risks are moderate, rather than waiting until the risks are seen as elevated, which arguably could be too late? Thanks.
CHAIRMAN POWELL. So, I think one of the most important lessons from the financial crisis is really the importance of the stability of the financial system. And so, we — since the financial crisis, as you’re aware, we’ve had a major focus on building up our monitoring of financial conditions and financial stability issues. We’ve also put in place many, many initiatives to strengthen the financial system through higher capital, and better regulation, more transparency, central clearing, margins on unclear derivatives, all kinds of things like that, which are meant to strengthen the financial system. We’ve done many of those things, and we feel that the financial system is in a much better place.
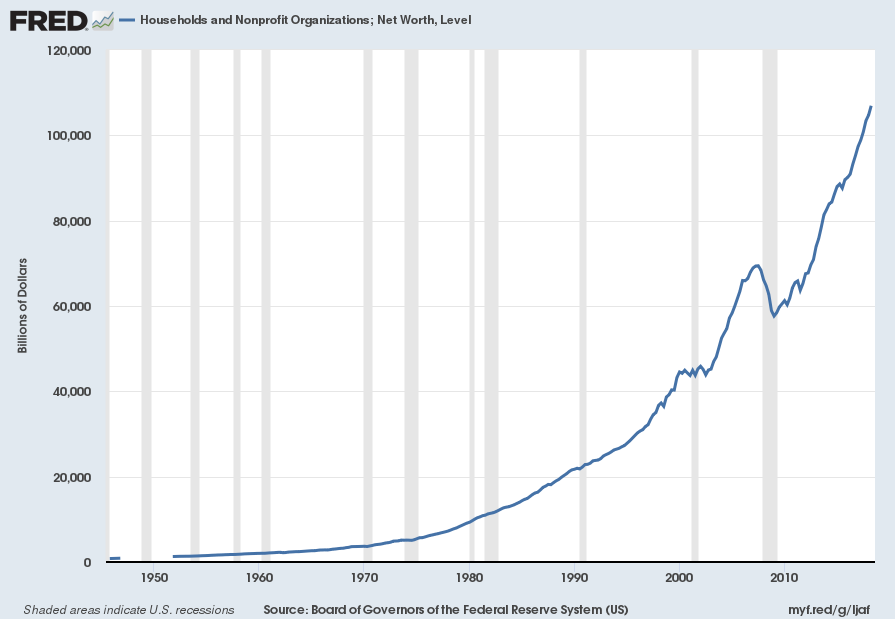
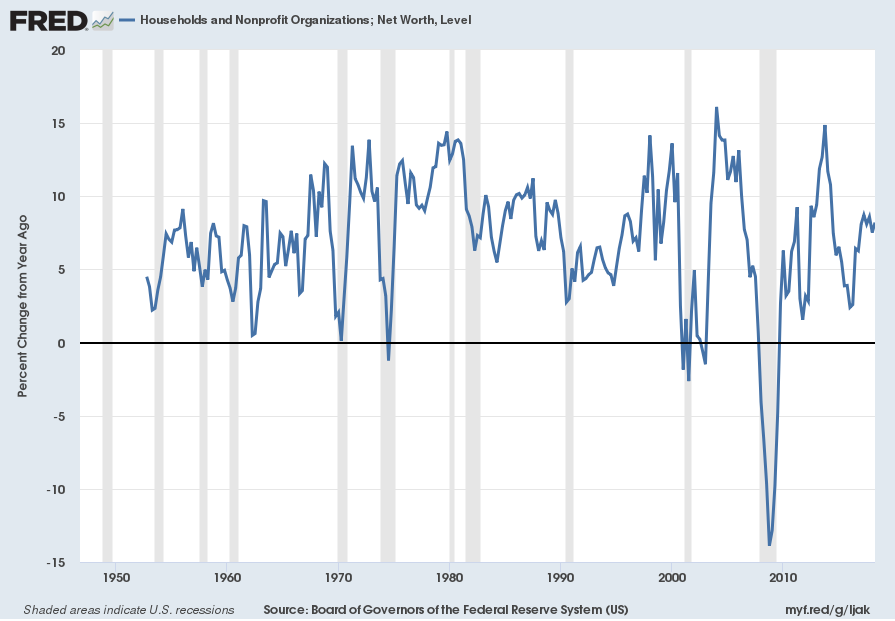
As we look at — as we look at conditions most recently, and this was at our last meeting and it was in our minutes for the last meeting, quarterly, we have a briefing at the FOMC, and also at the Board, of the staffs’ views on financial stability, and the staff judged the overall vulnerabilities to be moderate. If you dig into the different aspects of that question, households or balance sheets are in good shape. You know, employment is high, wages are rising, that sort of thing. The banking system, as I mentioned, is, you know, much higher capital, much higher liquidity, is much stronger. If you look at asset prices, it is true that some asset prices are in the upper range of their historical — upper reach of their historical ranges. And then if you look at non-financial corporates, you get — there is the story of leverage there. So, it’s not that there aren’t any vulnerabilities, but we see them as moderate.
Now you ask about the counter cyclical capital buffer. The counter cyclical capital buffer is a tool that we added to our toolkit I think finally back in 2016. We said that we would deploy it when vulnerabilities were meaningfully above normal. We revisit that on a regular schedule and the last time we revisited it was I think last year — sometime last year and concluded that the test was not met. As I mentioned at the last briefing, the — you know, the assessment was that vulnerabilities were moderate, but it remains a kit — a tool for our toolkit that we can deploy, you know, when and as we feel appropriate.
also:
GREG ROBB. Thank you, Mr. Chairman. Greg Robb from MarketWatch. The 10-year anniversary of the bankruptcy of Lehman Brothers got a lot of attention over the last month. I was wondering if you thought there were any lessons from the crisis that you want to share and two points on that. You go to Congress a lot and talk to members of Congress. Now Secretary Paulson and Mr. Geithner and Chair Bernanke have said that Congress made a mistake when it took away the Fed’s emergency powers in Dodd-Frank. And then one other thing is that are you confident that all these non-banks didn’t – you know, non-banks never got put into the, you know, the FSOC, you know, system. So, are you confident that the — you can see the risks in the financial system? Thank you.
CHAIRMAN POWELL. So, three things there. The first thing is the single biggest thing I think that we learned was the — as I mentioned I think earlier, the importance of maintaining the stability of the financial system. So, I think if you look — if you look back at the way the models worked, and the way people thought about risk in the economy, that’s what was missing, and I think it’s not missing anymore. So, we — you know, we put a tremendous focus on that. We raised capital, liquidity. We have stress tests, which force banks to understand — the largest banks particularly — to understand and better manage their risk and have enough capital to survive a really substantial shock that’s at least as bad as the financial crisis. And if all that doesn’t work, we’ve got resolution plans, which we’ve, you know, through many cycles, have made really substantial progress, more than I had thought was likely. So, we’ve done a lot.  Nobody’s — you know, nobody is I think overconfident that we solved every problem. And, you know, now we’re going back and kind of taking a hard look at everything, and, you know, trying to make — trying to — trying to keep at it.
So, I think those are the really important lessons and, you know, we — we’re determined not to, you know, not to forget them, and that’s I think a risk now is to — is to forget things that we — that we learned. That’s just human nature over time.
I saw the article you’re talking about, the question is, did Congress take things away, emergency powers from the Fed? So, there was sort of a trade for taking away our power under 13, section 13(3) to provide support to individual non-banks, which is really holding companies and other companies. In exchange for that, we got order liquidation authority and a resolution authority. Was it a mistake? I don’t think there’s any sense that Congress would seriously look at changing that. I have real doubts about whether it was wise to take away our crisis-fighting tools. I think you put them away, and you hope you never need them, and I certainly strongly oppose efforts to take away more of our tools.
You know, the third thing you mentioned is the designation power, so it’s a really important power. In my mind, it should be used — my thinking, it should be used sparingly, and that means, you know, in situations where you have — I mean, in principle, you could have another Lehman Brothers come up out of the ground that’s not a bank, and it could be very threatening — or it could be capable of creating systemic risk, and so I think it’s a critical power to have. But, again, I would use it — I would tend to use it fairly sparingly.
also:
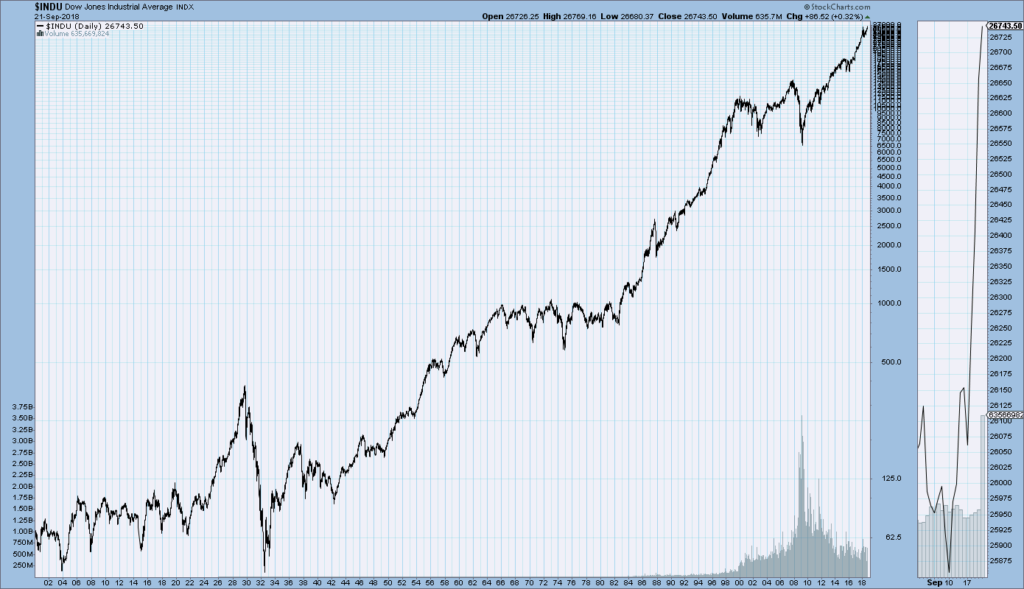
VIRGINIE MONTET. Virginie Montet with Agence France Presse. You mentioned earlier a possible, not probably correction, and I want to come back to the high level of the stock market. Are there any participants to the FOMC to think that we are witnessing an episode of irrational exuberance or rational exuberance? And if there was a steep correction, would it provoke financial stability concerns?
CHAIRMAN POWELL. So, I don’t comment on the appropriateness of the level of stock prices. I can say that by some valuation measures they’re in the upper range of their historical value ranges. But, you know, I wouldn’t want to — I wouldn’t want to speculate about what the consequences of a market correction should be. You know, we would — we would look very carefully at the nature of it and I mean it — really, really what hurts is if consumers are borrowing heavily and doing so against, for example, an asset that can fall into value, so that’s a really serious matter when you have a housing bubble and highly levered consumers, and housing values fall. We know that that’s a really bad situation. A simple drop in equity prices is, all by itself, doesn’t really have those features. It could certainly feature — it could certainly affect consumption and have a negative effect on the economy though.

_____
The Special Note summarizes my overall thoughts about our economic situation
SPX at 2923.15 as this post is written

Durable Goods New Orders – Long-Term Charts Through August 2018

Many people place emphasis on Durable Goods New Orders as a prominent economic indicator and/or leading economic indicator.
For reference, below are two charts depicting this measure.
First, from the St. Louis Fed site (FRED), a chart through August 2018, updated on September 27, 2018. This value is $259,592 ($ Millions):
(click on charts to enlarge images)
Durable Goods New Orders
Second, here is the chart depicting this measure on a “Percentage Change from a Year Ago” basis:
Durable Goods New Orders Percent Change From Year Ago
Data Source: FRED, Federal Reserve Economic Data, Federal Reserve Bank of St. Louis: Manufacturers’ New Orders:  Durable Goods [DGORDER]; U.S. Department of Commerce: Census Bureau; accessed September 27, 2018;
_________
I post various indicators and indices because I believe they should be carefully monitored.  However, as those familiar with this site are aware, I do not necessarily agree with what they depict or imply.
_____
The Special Note summarizes my overall thoughts about our economic situation
SPX at 2922.36 as this post is written

Broad-Based Indicators Of Economic Activity

The Chicago Fed National Activity Index (CFNAI) and the Aruoba-Diebold-Scotti Business Conditions Index (ADS Index) are two broad-based economic indicators that I regularly feature in this site.
The short-term and long-term trends of each continue to be notable.
The post on the Doug Short site of September 27, 2018, titled “The Philly Fed ADS Index Business Conditions Index Update” displays both the CFNAI MA-3 (3-month Moving Average) and ADS Index (91-Day Moving Average) from a variety of perspectives.
Of particular note, two of the charts, shown below, denote where the current levels of each reading is relative to the beginning of past recessionary periods, as depicted by the red dots.
The CFNAI MA-3:
(click on charts to enlarge images)
CFNAIMA3
The ADS Index, 91-Day MA:
ADS Index 91dma
Also shown in the aforementioned post is a chart of each with a long-term trendline (linear regression) as well as a chart depicting GDP for comparison purposes.
_________
I post various indicators and indices because I believe they should be carefully monitored.  However, as those familiar with this site are aware, I do not necessarily agree with what they depict or imply.
_____
The Special Note summarizes my overall thoughts about our economic situation
SPX at 2922.73 as this post is written

Wednesday, September 26, 2018

Chicago Fed National Financial Conditions Index (NFCI)

The St. Louis Fed’s Financial Stress Index (STLFSI) is one index that is supposed to measure stress in the financial system.  Its reading as of the September 20, 2018 update (reflecting data through September 14, 2018) is -1.295.
Of course, there are a variety of other measures and indices that are supposed to measure financial stress and other related issues, both from the Federal Reserve as well as from private sources.
Two other indices that I regularly monitor include the Chicago Fed National Financial Conditions Index (NFCI) as well as the Chicago Fed Adjusted National Financial Conditions Index (ANFCI).
Here are summary descriptions of each, as seen in FRED:
The National Financial Conditions Index (NFCI) measures risk, liquidity and leverage in money markets and debt and equity markets as well as in the traditional and “shadow” banking systems. Positive values of the NFCI indicate financial conditions that are tighter than average, while negative values indicate financial conditions that are looser than average.
The adjusted NFCI (ANFCI). This index isolates a component of financial conditions uncorrelated with economic conditions to provide an update on how financial conditions compare with current economic conditions.
For further information, please visit the Federal Reserve Bank of Chicago’s web site:
Below are the most recently updated charts of the NFCI and ANFCI, respectively.
The NFCI chart below was last updated on September 26, 2018 incorporating data from January 8, 1971 through September 21, 2018, on a weekly basis.  The September 21 value is -.88:
NFCI_9-26-18 -.88
Data Source: FRED, Federal Reserve Economic Data, Federal Reserve Bank of St. Louis; accessed September 26, 2018:
The ANFCI chart below was last updated on September 26, 2018 incorporating data from January 8,1971 through September 21, 2018, on a weekly basis.  The September 21 value is -.73:
ANFCI_9-26-18 -.73
Data Source: FRED, Federal Reserve Economic Data, Federal Reserve Bank of St. Louis; accessed September 26, 2018:
_________
I post various indicators and indices because I believe they should be carefully monitored.  However, as those familiar with this site are aware, I do not necessarily agree with what they depict or imply.
_____
The Special Note summarizes my overall thoughts about our economic situation
SPX at 2905.97 as this post is written

Tuesday, September 25, 2018

Money Supply Charts Through August 2018

For reference purposes, below are two sets of charts depicting growth in the money supply.
The first shows the MZM (Money Zero Maturity), defined in FRED as the following:
M2 less small-denomination time deposits plus institutional money funds.
Money Zero Maturity is calculated by the Federal Reserve Bank of St. Louis.
Here is the “MZM Money Stock” (seasonally adjusted) chart, updated on September 21, 2018 depicting data through August 2018, with a value of $15,583.1 Billion:
MZMSL_9-21-18 15583.1
Here is the “MZM Money Stock” chart on a “Percent Change From Year Ago” basis, with a current value of 3.6%:
MZMSL_9-21-18 15583.1 3.6 Percent Change From Year Ago
Data Source: FRED, Federal Reserve Economic Data, Federal Reserve Bank of St. Louis; accessed September 25, 2018:
The second set shows M2, defined in FRED as the following:
M2 includes a broader set of financial assets held principally by households. M2 consists of M1 plus: (1) savings deposits (which include money market deposit accounts, or MMDAs); (2) small-denomination time deposits (time deposits in amounts of less than $100,000); and (3) balances in retail money market mutual funds (MMMFs). Seasonally adjusted M2 is computed by summing savings deposits, small-denomination time deposits, and retail MMMFs, each seasonally adjusted separately, and adding this result to seasonally adjusted M1.
Here is the “M2 Money Stock” (seasonally adjusted) chart, updated on September 20, 2018, depicting data through August 2018, with a value of $14,217.2 Billion:
M2SL_9-20-18 14217.2
Here is the “M2 Money Stock” chart on a “Percent Change From Year Ago” basis, with a current value of 4.0%:
M2SL_9-20-18 14217.2 4.0 Percent Change From Year Ago
Data Source: FRED, Federal Reserve Economic Data, Federal Reserve Bank of St. Louis; accessed September 25, 2018:
_____
The Special Note summarizes my overall thoughts about our economic situation
SPX at 2919.37 as this post is written

Monday, September 24, 2018

Updates Of Economic Indicators September 2018

Here is an update of various indicators that are supposed to predict and/or depict economic activity. These indicators have been discussed in previous blog posts:
The September 2018 Chicago Fed National Activity Index (CFNAI) updated as of September 24, 2018:
The CFNAI, with current reading of .18:
CFNAI_9-24-18 .18
source:  Federal Reserve Bank of Chicago, Chicago Fed National Activity Index [CFNAI], retrieved from FRED, Federal Reserve Bank of St. Louis, September 24, 2018;
The CFNAI-MA3, with current reading of .24:
CFNAIMA3_9-24-18 .24
source:  Federal Reserve Bank of Chicago, Chicago Fed National Activity Index: Three Month Moving Average [CFNAIMA3], retrieved from FRED, Federal Reserve Bank of St. Louis, September 24, 2018;
As of September 21, 2018 (incorporating data through September 14, 2018) the WLI was at 148.3 and the WLI, Gr. was at .2%.
Here is the latest chart, depicting the ADS Index from December 31, 2007 through September 15, 2018:
ADS Index
The Conference Board Leading (LEI), Coincident (CEI) Economic Indexes, and Lagging Economic Indicator (LAG):
As per the September 20, 2018 press release, titled “The Conference Board Leading Economic Index (LEI) for the U.S. Increased in August” (pdf) the LEI was at 111.2, the CEI was at 104.3, and the LAG was 105.4 in August.
An excerpt from the release:
“The leading indicators are consistent with a solid growth scenario in the second half of 2018 and at this stage of a maturing business cycle in the US, it doesn’t get much better than this,” said Ataman Ozyildirim, Director of Business Cycles and Growth Research at The Conference Board. “The US LEI’s growth trend has moderated since the start of the year. Industrial companies that are more sensitive to the business cycle should be on the lookout for a possible moderation in economic growth in 2019. The strengths among the LEI’s components were very widespread, further supporting an outlook of above 3.0 percent growth for the remainder of 2018.”
_________
I post various indicators and indices because I believe they should be carefully monitored.  However, as those familiar with this site are aware, I do not necessarily agree with what they depict or imply.
_____
The Special Note summarizes my overall thoughts about our economic situation
SPX at 2916.05 as this post is written

The U.S. Economic Situation – September 24, 2018 Update

Perhaps the main reason that I write of our economic situation is that I continue to believe, based upon various analyses, that our economic situation is in many ways misunderstood.  While no one likes to contemplate a future rife with economic adversity, current and future economic problems must be properly recognized and rectified if high-quality, sustainable long-term economic vitality is to be realized.
There are an array of indications and other “warning signs” – many readily apparent – that current economic activity and financial market performance is accompanied by exceedingly perilous dynamics.
I have written extensively about this peril, including in the following:
Building Financial Danger” (ongoing updates)
My analyses continues to indicate that the growing level of financial danger will lead to the next stock market crash that will also involve (as seen in 2008) various other markets as well.  Key attributes of this next crash is its outsized magnitude (when viewed from an ultra-long term historical perspective) and the resulting economic impact.  This next financial crash is of tremendous concern, as my analyses indicate it will lead to a Super Depression – i.e. an economy characterized by deeply embedded, highly complex, and difficult-to-solve problems.
For long-term reference purposes, here is a chart of the Dow Jones Industrial Average since 1900, depicted on a monthly basis using a LOG scale (updated through September 21, 2018, with a last value of 26743.50):
(click on chart to enlarge image)(chart courtesy of StockCharts.com)
DJIA since 1900
_____
The Special Note summarizes my overall thoughts about our economic situation
SPX at 2929.67 as this post is written

Friday, September 21, 2018

Total Household Net Worth As Of 2Q 2018 – Two Long-Term Charts

For reference purposes, here is Total Household Net Worth from a long-term perspective (from 1945:Q4 through 2018:Q2).  The last value (as of the September 20, 2018 update) is $106.929235 Trillion:
(click on each chart to enlarge image)
U.S. Total Household Net Worth
Also of interest is the same metric presented on a “Percent Change from a Year Ago” basis, with a current value of 8.2%:
U.S. Total Household Net Worth Percent Change From Year Ago
Data Source: FRED, Federal Reserve Economic Data, Board of Governors of the Federal Reserve System; accessed September 21, 2018:
_____
The Special Note summarizes my overall thoughts about our economic situation
SPX at 2932.84 as this post is written