Friday, January 31, 2020

Consumer Confidence Surveys – As Of January 31, 2020

The Doug Short site had a post of January 31, 2020 (“Michigan Consumer Sentiment: January Final Remains Positive“) that displays the latest Conference Board Consumer Confidence and Thomson/Reuters University of Michigan Consumer Sentiment Index charts.  They are presented below:
(click on charts to enlarge images)
Conference Board Consumer Confidence chart
University of Michigan Consumer Sentiment Chart
There are a few aspects of the above charts that I find highly noteworthy.  Of course, until the sudden upswing in 2014, the continued subdued absolute levels of these two surveys was disconcerting.
Also, I find the “behavior” of these readings to be quite disparate as compared to the other post-recession periods, as shown in the charts between the gray shaded areas (the gray areas denote recessions as defined by the NBER.)
While I don’t believe that confidence surveys should be overemphasized, I find these readings to be notable, especially in light of a variety of other highly disconcerting measures highlighted throughout this site.
_____
The Special Note summarizes my overall thoughts about our economic situation
SPX at 3252.05 as this post is written

Employment Cost Index (ECI) – Fourth Quarter 2019

While the concept of Americans’ incomes can be defined in a number of ways, many prominent measures continue to show disconcerting trends.
One prominent measure is the Employment Cost Index (ECI).
Here is a description from the BLS document titled “The Employment Cost Index:  what is it?“:
The Employment Cost Index (ECI) is a quarterly measure of the change in the price of labor, defined as compensation per employee hour worked. Closely watched by many economists, the ECI is an indicator of cost pressures within companies that could lead to price inflation for finished goods and services. The index measures changes in the cost of compensation not only for wages and salaries, but also for an extensive list of benefits. As a fixed-weight, or Laspeyres, index, the ECI controls for changes occurring over time in the industrial-occupational composition of employment.
On January 31, 2020, the ECI for the fourth quarter was released.  Here are two excerpts from the BLS release titled “Employment Cost Index – December 2019“:
Compensation costs for civilian workers increased 0.7 percent, seasonally adjusted, for the 3-month period ending in December 2019, the U.S. Bureau of Labor Statistics reported today. Wages and salaries increased 0.7 percent and benefit costs increased 0.5 percent from September 2019. (See tables A, 1, 2, and 3.)
also:
Compensation costs for civilian workers increased 2.7 percent for the 12-month period ending in December 2019, compared to 2.9 percent in December 2018. Wages and salaries increased 2.9 percent over the year and increased 3.1 percent for the 12-month period ending in December 2018. Benefit costs increased 2.2 percent for the 12-month period ending in December 2019. In December 2018, the increase was 2.8 percent. (See tables A, 4, 8, and 12.)
Below are three charts, updated on January 31, 2020 that depict various aspects of the ECI, which is seasonally adjusted (SA):
The first depicts the ECI, with a value of 138.9:
ECIALLCIV chart
source: US. Bureau of Labor Statistics, Employment Cost Index: Total compensation: All Civilian[ECIALLCIV], retrieved from FRED, Federal Reserve Bank of St. Louis, accessed January 31, 2020:
https://research.stlouisfed.org/fred2/series/ECIALLCIV/
The second chart depicts the ECI on a “Percent Change from Year Ago” basis, with a value of 2.7%:
ECIALLCIV Percent Change From Year Ago
The third chart depicts the ECI on a “Percent Change” (from last quarter) basis, with a value of .7%:
ECIALLCIV Percent Change
_________
I post various indicators and indices because I believe they should be carefully monitored.  However, as those familiar with this site are aware, I do not necessarily agree with what they depict or imply.
_____
The Special Note summarizes my overall thoughts about our economic situation
SPX at 3256.81 as this post is written

Velocity Of Money – Charts Updated Through January 30, 2020

Here are three charts from the St. Louis Fed depicting the velocity of money in terms of the MZM, M1 and M2 money supply measures.
All charts reflect quarterly data through the 4th quarter of 2019, and were last updated as of January 30, 2020.
Velocity of MZM Money Stock, current value = 1.288:
MZMV 1-30-20
Data Source: FRED, Federal Reserve Economic Data, Federal Reserve Bank of St. Louis; accessed January 30, 2020:
http://research.stlouisfed.org/fred2/series/MZMV
Velocity of M1 Money Stock, current value = 5.502:
M1V 1-30-20
Data Source: FRED, Federal Reserve Economic Data, Federal Reserve Bank of St. Louis; accessed January 30, 2020:
http://research.stlouisfed.org/fred2/series/M1V
Velocity of M2 Money Stock, current value = 1.426:
M2V 1-30-20
Data Source: FRED, Federal Reserve Economic Data, Federal Reserve Bank of St. Louis; accessed January 30, 2020:
http://research.stlouisfed.org/fred2/series/M2V
_________
I post various indicators and indices because I believe they should be carefully monitored.  However, as those familiar with this site are aware, I do not necessarily agree with what they depict or imply.
_____
The Special Note summarizes my overall thoughts about our economic situation
SPX at 3283.66 as this post is written

Thursday, January 30, 2020

Jerome Powell’s January 29, 2020 Press Conference – Notable Aspects

On Wednesday, January 29, 2020 FOMC Chairman Jerome Powell gave his scheduled January 2020 FOMC Press Conference. (link of video and related materials)
Below are Jerome Powell’s comments I found most notable – although I don’t necessarily agree with them – in the order they appear in the transcript.  These comments are excerpted from the “Transcript of Chairman Powell’s Press Conference“ (preliminary)(pdf) of January 29, 2020, with the accompanying “FOMC Statement.”
From Chairman Powell’s opening comments:
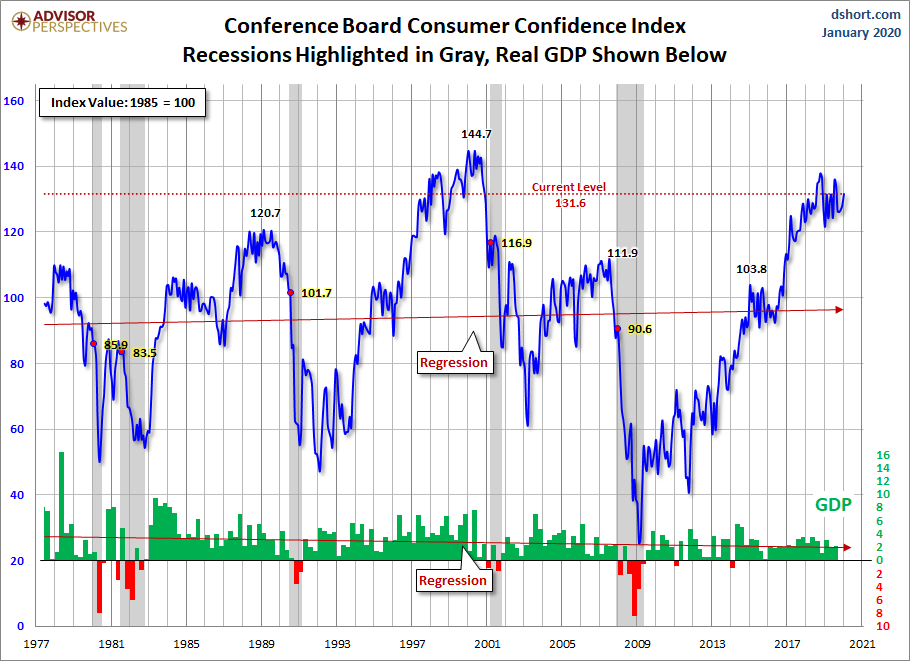
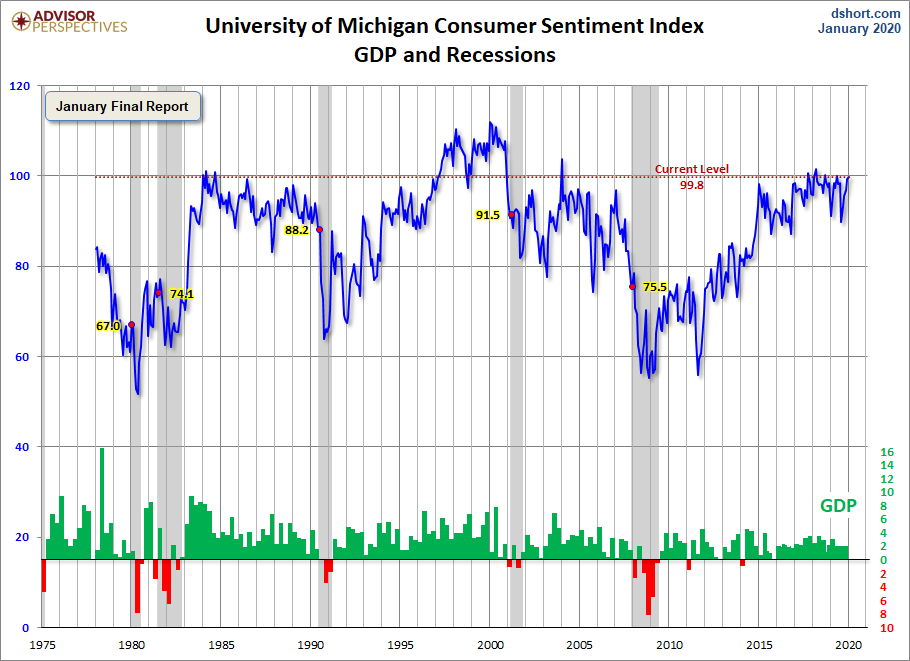
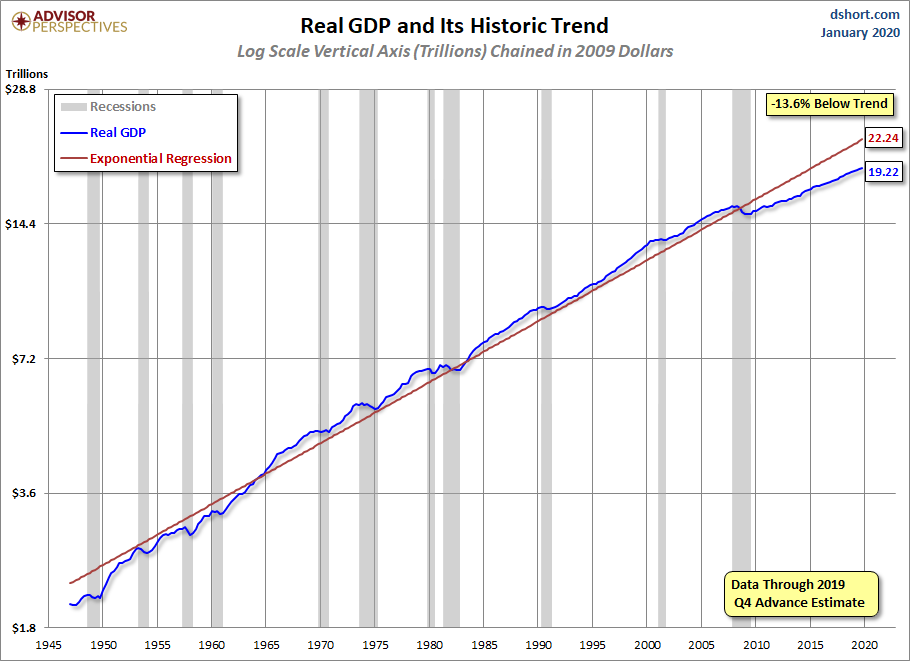
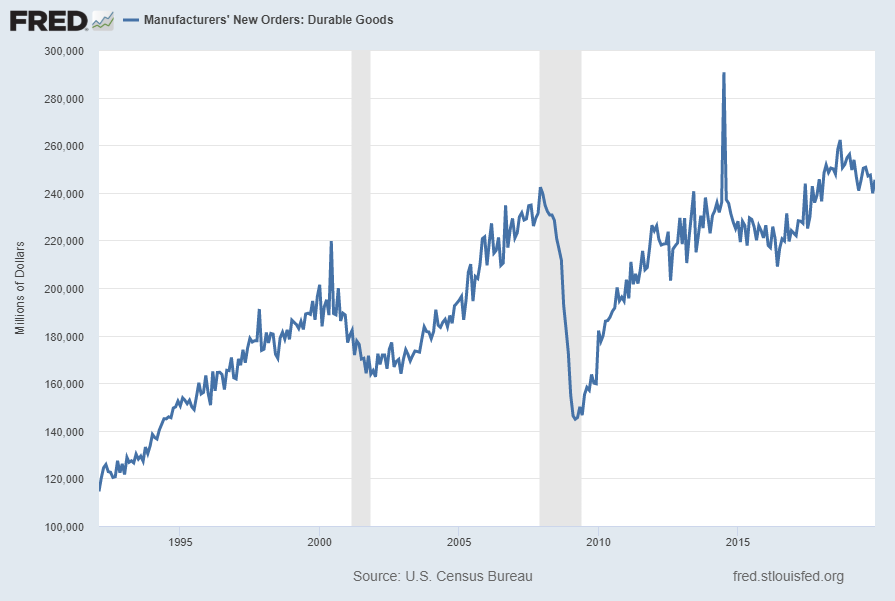
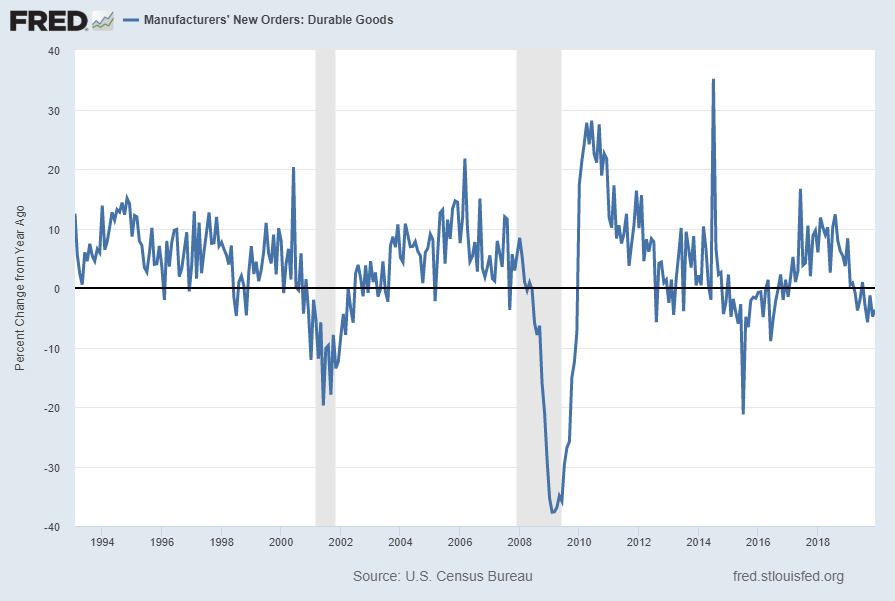
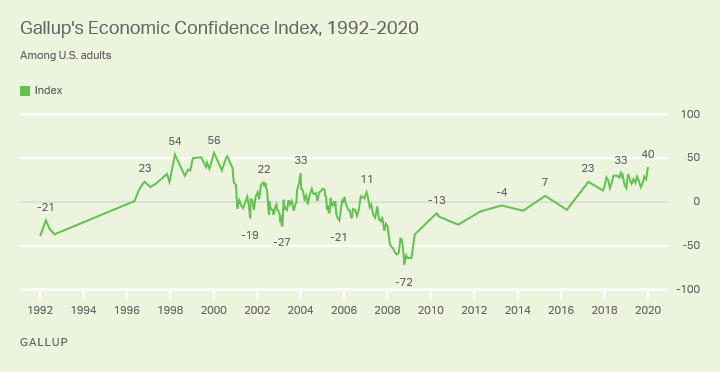
The expansion is in its 11th year, the longest on record.  Growth in household spending moderated toward the end of last year, but with a healthy job market, rising incomes, and upbeat consumer confidence, the fundamentals supporting household spending are solid.  In contrast, business investment and exports remain weak, and manufacturing output has declined over the past year.  Sluggish growth abroad and trade developments have been weighing on activity in these sectors.  However, some of the uncertainties around trade have diminished recently, and there are some signs that global growth may be stabilizing after declining since mid-2018.  Nonetheless, uncertainties about the outlook remain, including those posed by the new coronavirus.  Overall, with monetary and financial conditions supportive, we expect moderate economic growth to continue.
also:
I will conclude with a brief overview of our current plans for our technical operations to implement monetary policy.  The plan the FOMC announced back in October to purchase Treasury bills and conduct repo operations has proceeded smoothly and has succeeded in providing an ample supply of reserves to the banking system and effectively controlling the federal funds rate.  In light of the resulting stability in the federal funds rate and money market conditions more generally, we decided to make a small technical upward adjustment to administered rates to ensure that the federal funds rate trades well within the target range.  This action reverses the small downward adjustment made in September when money markets were volatile.   
As our bill purchases continue to build reserves toward levels that maintain ample conditions, the role played by active repo operations will naturally recede.  Over the first half of this year, we intend to adjust the size and pricing of repo operations as we transition away from their active use in supplying reserves.  This process will take place gradually and, as indicated in today’s FOMC directive to the Desk, we expect to continue offering repos at least through April to ensure a consistently ample supply of reserves.  Based on current projections, we expect that the underlying level of reserves will durably reach ample levels sometime in the second quarter of this year.  As we get close to that point, we intend to slow the pace of purchases and transition to a program of smaller reserve-management purchases that maintains an ample level of reserves without the active use of repos.  At that point, as in the pre-crisis period, our balance sheet will be expanding gradually over time, reflecting the trend growth in the demand for currency and other Federal Reserve liabilities.
All of these technical measures are designed to support the efficient and effective implementation of monetary policy and are not intended to represent a change in the stance of monetary policy.  We are committed to completing the transition to our longer-run ample reserves regime smoothly and predictably.  Of course, we will continue to closely monitor conditions in money markets and we will adjust these plans as conditions warrant.
Jerome Powell’s responses as indicated to the various questions:
STEVE LIESMAN.  Steve Liesman, CNBC.  Mr.  Chairman, thank you for the question.  Following up on Nick’s question, I know you said it’s not QE but it’s $390 billion over five months, which is a lot to expand the balance sheet.  I guess I’d ask one more time on Nick’s question, is there a number that you have in mind?  Secondly, a lot of people in the market are sort of concerned that it looks like QE and they’re trading that way.  Are you concerned that the market is embracing this like a QE program and that the rise in the stock market is linked to it and you may then experience something of a tapered tantrum, the way Chairman Bernanke did when he tried to roll it off?  
CHAIR POWELL.  So I’ll just— I’ll repeat that.  We think that the—we think we need to continue purchases until the—until reserves are at a level that at which they will not go below $1.5 trillion roughly during the course of the calendar year.  And we know that the TGA will move up and down that.  So they’ll be much harder than that sometime.  That’s—But that’s kind of the number and we think we’ll reach that sometime in the second quarter.  That’s our estimate.  But we will—we’ll know it when we get there.  We’ll know it because we’ll be able to be—to control the federal funds rate without use of—without active use, ongoing use of open market operations.  You know, our intention of these—for these adjustments is just to raise the level of reserves and to allow us to conduct monetary policy in an efficient and effective manner.  And that’s—that is our sole intention.  I pointed out on other occasions more than once the differences, the really specific differences between this and the large-scale asset purchase programs.  We’ve been over that.  In terms of what affects markets, you know, I think many things affect markets.  It’s very hard to say with any precision at any time what is affecting markets.  What I can tell you is that you know what our intention is.  It is to return reserves to an ample level.  We expect that to happen during the second quarter.  And our plan as we do that is as those purchases get to that level, we believe we can gradually reduce them, and we believe we can also gradually reduce repo as we reach an ample level, as we’re satisfying demand now more from underlying reserves from bill purchases rather than from repo.  And again, last thing I’ll say is we’re prepared to adjust the details of this plan as we’ve shown ourselves willing to do depending on conditions.
also:
MICHAEL DERBY.  Hi, Mike Derby with the Dow Jones.  Do you have any greater sense of what was going wrong with the repo market starting in September?  There seem to be, you know, whether it was a one-off event, you know, too tight around tax payments and debt settlement or whether there’s a more enduring issue going on with the market, more structural forces that are basically gumming up the repo sector? 
CHAIR POWELL.  Yes.  As for those forces, so as we indicated we would undertake a, you know, a serious review of that question and look at both regulations and also supervisory practices, and we’d be prepared to adjust those in ways that might encourage liquidity to flow more easily in the system, as long as it didn’t undermine safety and soundness.  And so we’ve undertaken that.  We’ve done a ton of work.  Actually, we don’t have anything to announce here today.  But I feel good about the—what we’ve learned there.  I think you mentioned other factors, we will be announcing our findings.  I’m not going to give you a time, but we’re well along in that assessment at this time.  
I think we also found out, though, that the level of reserves that we need in the system to conduct our operations without frequent resort to open market operations was higher than we thought and was higher than others have thought, too.  We learned that we can’t let reserves—we shouldn’t let reserves go below one-and-a-half trillion—roughly, the level of early September— kat any point.  And that means that reserves will move through, in a range over the course of the year that will be substantially higher than one-and-a-half, but they won’t ever go below.  So oneand-a-half is not a target level, it is the bottom of a range in which reserves will be expected to move.  
CHRISTOPHER RUGABER.  Hi, Mr. Chairman, I just wanted to ask you about how your balance sheet operations and repo, temporary repos, how they affect the system, and who they’re helping?  Clearly, they’re mostly designed, as you said, to get, keep, the fed funds rate in the range you’re looking for.  But certainly, the repo market is also used heavily by hedge funds and other Wall Street institutions, and so how would you explain to, sort of, mainstream, why you’re doing all this for that market?  And how would you address criticism that it is helping mostly Wall Street along with everything else? 
CHAIR POWELL.  Well, let me just stress that we have a very specific and important reason for caring about money market operations generally and that just is that we are—our monetary policy decisions are transmitted through the financial markets, through the money markets into other financial markets and into broader financial conditions.  So, we care that money markets are operating smoothly, and they stopped operating smoothly, briefly, back in September.  And so we acted.  This is a one-time thing that we’re doing to adjust the level of reserves so that the money markets will be able to operate smoothly on an ongoing basis.  
Repo markets are important because that’s where Treasury securities—the purchase of Treasury securities, which is the way you know, the federal, part of the way the federal government is funding its operations.  It’s the way those are financed.  So these are largely Treasury securities that have been purchased by dealers for distribution to, and buyers to a substantial extent, that’s what’s going on in the Treasury repo market.  So it’s just the financing for that.  Now, again, we don’t—that activity is a market activity.  We’re not looking to eliminate volatility or protect anybody from volatility at all.  What we care about is that volatility in the repo market can affect the transmission of our policy decisions to federal funds rate.  And that really is important for the public. 
also:
BRIAN CHEUNG.  Hi, I’m Brian Cheung here, Yahoo Finance.  So the combination of T-bill purchases and repo operations had been described colloquially as liquidity.  I’m just wondering if you semantically agree with that description, then secondly, what the impact of that has been on risk assets.  I don’t know if that’s something that you know the Board or Reserve Banks are formally looking into or just looking at what the effect of it has been, how do you kind of think about that going forward?  Thanks.  
CHAIR POWELL.  Well, so two questions.  I mean, in terms of liquidity, I think what we’re doing is what I said, we’re trying to raise the level of reserves back up to a level so that banks can meet their reserve requirements and that there’s enough reserves in the system that we don’t see reserve scarcity.  And we don’t have to use repo operations to provide additional resource.  So I think as I mentioned, we believe we can get to that state at the current pace at sometime in the second quarter.  
In terms of effects on risk assets, as I said earlier, it’s very hard to say what is affecting financial markets with any precision or confidence at a given time.  It’s not our intention to change the stance of monetary policy.  These were designed to provide more reserves, and really to do that in order to enable better transmission of our rate decisions into the economy under our chosen framework.  That’s really the purpose of what we’re doing.
also:
DON LEE.  Don Lee with the L.A. Times.  I wanted to ask you about the stock market.  By historical comparison, as you know, valuations are conservatively high.  And I just wonder how much discussion and concern you and your colleagues have about that, and what risk you see for the economy? 
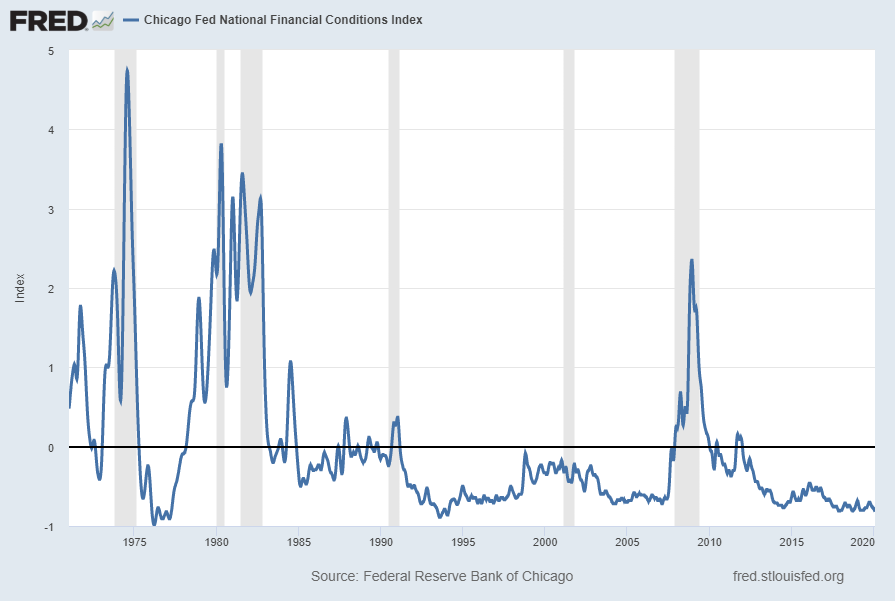
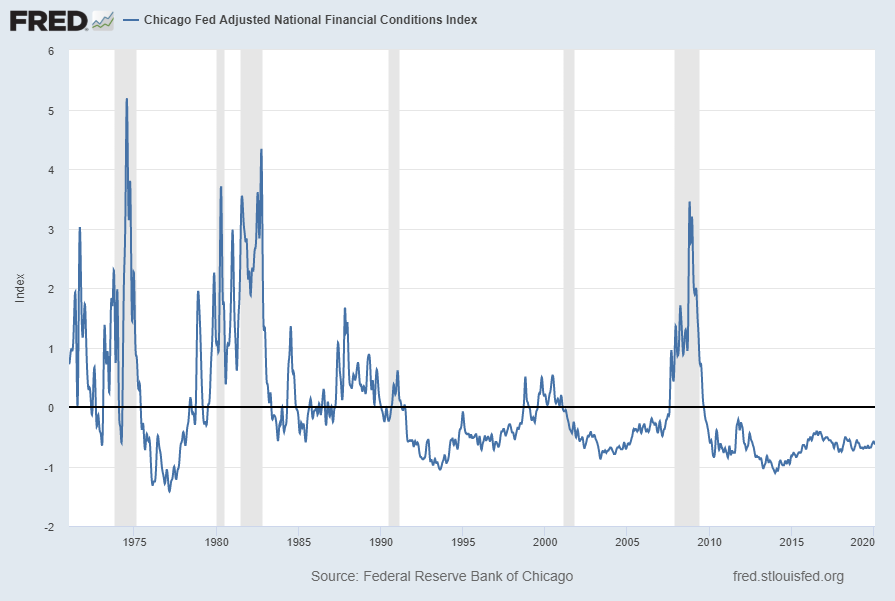
CHAIR POWELL.  Do we—we look at very broad range of financial conditions where there isn’t anyone financial condition that we look at.  And when we look at financial conditions, what matters for the real economy is substantial changes in, or material changes, in financial conditions that are sustained over a period of time.  
If I can, maybe I’ll answer that in the context of our overall substantial financial stability framework.  That’s one way to look at it.  So we look at—when we look at financial stability, we look at, really, we’ve got four pillars to that.  The first of which is leverage in the financial system that is at a comfortable level.  Our banks, particular large banks have high levels of capital.  
The second is leverage in the nonfinancial sector, and that divides into households and businesses.  Households’ debt to GDP is—has been coming down since the financial crisis.  It’s not moving up.  It’s at low levels compared to what it was before the crisis.  So, not every household, but in the aggregate household, debt is in a good place, a very good place.  
Business debt has been moving up.  We’ve been calling that out for more than a year, substantially more than a year, and it’s something we’re focused on, and we’ve taken appropriate measures, and we’re monitoring carefully.  But we think it’s not something that would threaten financial stability but more be an amplifier.  
The other one is asset purchases getting to your—sorry, the asset prices getting to your question.  We do see asset valuations as being somewhat elevated—I do—somewhat elevated, if you look at risk spreads, they’re narrow, if you look at PEs, they’re high.  I think, the way to think about—a good way—one way to think about equity prices though, is what’s the premium you’re getting paid to own equities rather than risk-free debt.  And that’s also at fairly low levels but not extremely low levels.  So, valuations are high but not at extremes.  
The final factor is funding risk, our big financial institutions and other players in the financial system funded with stable funding or is there a lot of run risk?  And the answer is very stable funding, for the most part.  So, if you look at overall, what you see in my view is vulnerabilities to the financial—to financial stability are moderate overall. 
_____
_____
The Special Note summarizes my overall thoughts about our economic situation
SPX at 3277.43 as this post is written 

Real GDP Chart Since 1947 With Trendline – 4th Quarter 2019

For reference purposes, below is a chart from the Doug Short site post of January 30, 2020 titled “Q4 GDP Advance Estimate: Real GDP at 2.1%” reflecting Real GDP, with a trendline, as depicted.  This chart incorporates the Gross Domestic Product, Fourth Quarter and Year 2019 (Advance Estimate) of January 30, 2020:
GDP since 1947 chart
_________
I post various indicators and indices because I believe they should be carefully monitored.  However, as those familiar with this site are aware, I do not necessarily agree with what they depict or imply.
_____
The Special Note summarizes my overall thoughts about our economic situation
SPX at 3247.65 as this post is written

Wednesday, January 29, 2020

Chicago Fed National Financial Conditions Index (NFCI)

The St. Louis Fed’s Financial Stress Index (STLFSI) is one index that is supposed to measure stress in the financial system.  Its reading as of the January 23, 2020 update (reflecting data through January 17, 2020) is -1.567.
Of course, there are a variety of other measures and indices that are supposed to measure financial stress and other related issues, both from the Federal Reserve as well as from private sources.
Two other indices that I regularly monitor include the Chicago Fed National Financial Conditions Index (NFCI) as well as the Chicago Fed Adjusted National Financial Conditions Index (ANFCI).
Here are summary descriptions of each, as seen in FRED:
The National Financial Conditions Index (NFCI) measures risk, liquidity and leverage in money markets and debt and equity markets as well as in the traditional and “shadow” banking systems. Positive values of the NFCI indicate financial conditions that are tighter than average, while negative values indicate financial conditions that are looser than average.
The adjusted NFCI (ANFCI). This index isolates a component of financial conditions uncorrelated with economic conditions to provide an update on how financial conditions compare with current economic conditions.
For further information, please visit the Federal Reserve Bank of Chicago’s web site:
Below are the most recently updated charts of the NFCI and ANFCI, respectively.
The NFCI chart below was last updated on January 29, 2020 incorporating data from January 8, 1971 through January 24, 2020, on a weekly basis.  The January 24 value is -.82:
NFCI
Data Source: FRED, Federal Reserve Economic Data, Federal Reserve Bank of St. Louis; accessed January 29, 2020: 
http://research.stlouisfed.org/fred2/series/NFCI
The ANFCI chart below was last updated on January 29, 2020 incorporating data from January 8, 1971 through January 24, 2020, on a weekly basis.  The January 24 value is -.63:
ANFCI
Data Source: FRED, Federal Reserve Economic Data, Federal Reserve Bank of St. Louis; accessed January 29, 2020: 
http://research.stlouisfed.org/fred2/series/ANFCI
_________
I post various indicators and indices because I believe they should be carefully monitored.  However, as those familiar with this site are aware, I do not necessarily agree with what they depict or imply.
_____
The Special Note summarizes my overall thoughts about our economic situation
SPX at 3286.21 as this post is written

Tuesday, January 28, 2020

Durable Goods New Orders – Long-Term Charts Through December 2019

Many people place emphasis on Durable Goods New Orders as a prominent economic indicator and/or leading economic indicator.
For reference, below are two charts depicting this measure.
First, from the St. Louis Fed site (FRED), a chart through December 2019, updated on January 28, 2020. This value is $245,484 ($ Millions):
(click on charts to enlarge images)
Durable Goods New Orders
Second, here is the chart depicting this measure on a “Percentage Change from a Year Ago” basis, with a last value of -3.7%:
Durable Goods New Orders Percent Change From Year Ago
Data Source: FRED, Federal Reserve Economic Data, Federal Reserve Bank of St. Louis: Manufacturers’ New Orders:  Durable Goods [DGORDER]; U.S. Department of Commerce: Census Bureau; accessed January 28, 2020;
http://research.stlouisfed.org/fred2/series/DGORDER
_________
I post various indicators and indices because I believe they should be carefully monitored.  However, as those familiar with this site are aware, I do not necessarily agree with what they depict or imply.
_____
The Special Note summarizes my overall thoughts about our economic situation
SPX at 3259.79 as this post is written

Monday, January 27, 2020

January 23, 2020 Gallup Poll Results On Economic Confidence – Notable Excerpts

On January 23, 2020 Gallup released the poll results titled “U.S. Economic Confidence at Highest Point Since 2000.”
Notable excerpts include:
Americans’ confidence in the U.S. economy is higher than at any point in about two decades. The latest figure from Gallup’s Economic Confidence Index is +40, the highest reading recorded since +44 in October 2000.
also:
Gallup’s Economic Confidence Index is the average of two components: Americans’ ratings of current economic conditions and their views on whether the economy is getting better or getting worse. The index has a theoretical maximum of +100, achieved if all Americans believe the economy is excellent or good and getting better. The theoretical minimum is -100, if all Americans say the economy is poor and getting worse.
The current conditions component score of +54 is the result of 62% of Americans saying the economy is “excellent” or “good” and 8% describing it as “poor.” Meanwhile, the economic outlook component score of +26 is the result of 59% saying the economy is “getting better” and 33% saying it is “getting worse.”
Also of note is other commentary, including a section titled “Mentions of Economic Issues as Greatest U.S. Problem at a Record Low.”
Here is an accompanying chart of the Gallup Economic Confidence Index from 1992-2020:
Gallup's Economic Confidence Index 1992-2020
_____
The Special Note summarizes my overall thoughts about our economic situation
SPX at 3251.63 as this post is written

Thursday, January 23, 2020

Money Supply Charts Through December 2019

For reference purposes, below are two sets of charts depicting growth in the money supply.
The first shows the MZM (Money Zero Maturity), defined in FRED as the following:
M2 less small-denomination time deposits plus institutional money funds.
Money Zero Maturity is calculated by the Federal Reserve Bank of St. Louis.
Here is the “MZM Money Stock” (seasonally adjusted) chart, updated on January 16, 2020 depicting data through December 2019, with a value of $17,067.8 Billion:
MZMSL chart
Here is the “MZM Money Stock” chart on a “Percent Change From Year Ago” basis, with a current value of 8.7%:
MZMSL Percent Change From Year Ago chart
Data Source: FRED, Federal Reserve Economic Data, Federal Reserve Bank of St. Louis; accessed January 23, 2020;
https://research.stlouisfed.org/fred2/series/MZMSL
The second set shows M2, defined in FRED as the following:
M2 includes a broader set of financial assets held principally by households. M2 consists of M1 plus: (1) savings deposits (which include money market deposit accounts, or MMDAs); (2) small-denomination time deposits (time deposits in amounts of less than $100,000); and (3) balances in retail money market mutual funds (MMMFs). Seasonally adjusted M2 is computed by summing savings deposits, small-denomination time deposits, and retail MMMFs, each seasonally adjusted separately, and adding this result to seasonally adjusted M1.
Here is the “M2 Money Stock” (seasonally adjusted) chart, updated on January 16, 2020, depicting data through December 2019, with a value of $15,401.8 Billion:
M2SL chart
Here is the “M2 Money Stock” chart on a “Percent Change From Year Ago” basis, with a current value of 7.2%:
M2SL Percent Change From Year Ago chart
Data Source: FRED, Federal Reserve Economic Data, Federal Reserve Bank of St. Louis; accessed January 23, 2020;
https://research.stlouisfed.org/fred2/series/M2SL
_____
The Special Note summarizes my overall thoughts about our economic situation
SPX at 3306.26 as this post is written