On Wednesday, January 26, 2022 FOMC Chairman Jerome Powell gave his scheduled January 2022 FOMC Press Conference. (link of video and related materials)
Below are Jerome Powell’s comments I found most notable – although I don’t necessarily agree with them – in the order they appear in the transcript. These comments are excerpted from the “Transcript of Chairman Powell’s Press Conference“ (preliminary)(pdf) of January 26, 2022, with the accompanying “FOMC Statement.”
Excerpts from Chairman Powell’s opening comments:
CHAIR POWELL. Good afternoon. At the Federal Reserve, we are strongly committed to achieving the monetary policy goals that Congress has given us: maximum employment and price stability.
Today, in support of these goals, the Federal Open Market Committee kept its policy interest rate near zero and stated its expectation that an increase in this rate would soon be appropriate. The Committee also agreed to continue reducing its net asset purchases on the schedule we announced in December, bringing them to an end in early March. As I will explain, against a backdrop of elevated inflation and a strong labor market, our policy has been adapting to the evolving economic environment, and it will continue to do so.
Economic activity expanded at a robust pace last year, reflecting progress on vaccinations and the reopening of the economy, fiscal and monetary policy support, and the healthy financial positions of households and businesses. Indeed, the economy has shown great strength and resilience in the face of the ongoing pandemic. The recent sharp rise in COVID cases associated with the Omicron variant will surely weigh on economic growth this quarter. High-frequency indicators point to reduced spending in COVID-sensitive sectors, such as travel and restaurants. And activity more broadly may also be affected as many workers are unable to report for work because of illness, quarantines, or caregiving needs. Fortunately, health experts are finding that the Omicron variant has not been as virulent as previous strains of the virus, and they expect that cases will drop off rapidly. If the wave passes quickly, the economic effects should as well, and we would see a return to strong growth. That said, the implications for the economy remain uncertain. And we have not lost sight of the fact that for many afflicted individuals and families, and for the healthcare workers on the front lines, the virus continues to cause great hardship.
also:
Inflation remains well above our longer-run goal of 2 percent. Supply and demand imbalances related to the pandemic and the reopening of the economy have continued to contribute to elevated levels of inflation. In particular, bottlenecks and supply constraints are limiting how quickly production can respond to higher demand in the near term. These problems have been larger and longer lasting than anticipated, exacerbated by waves of the virus.
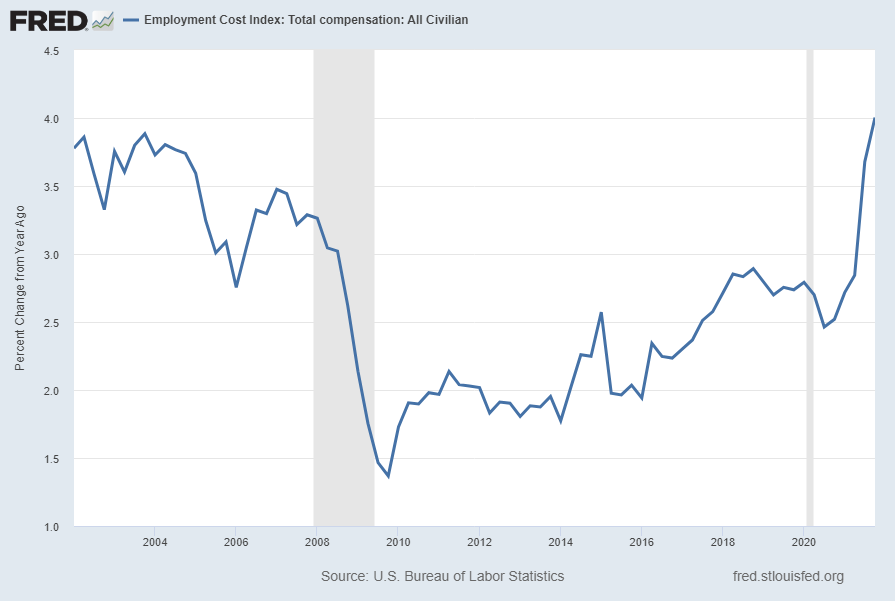
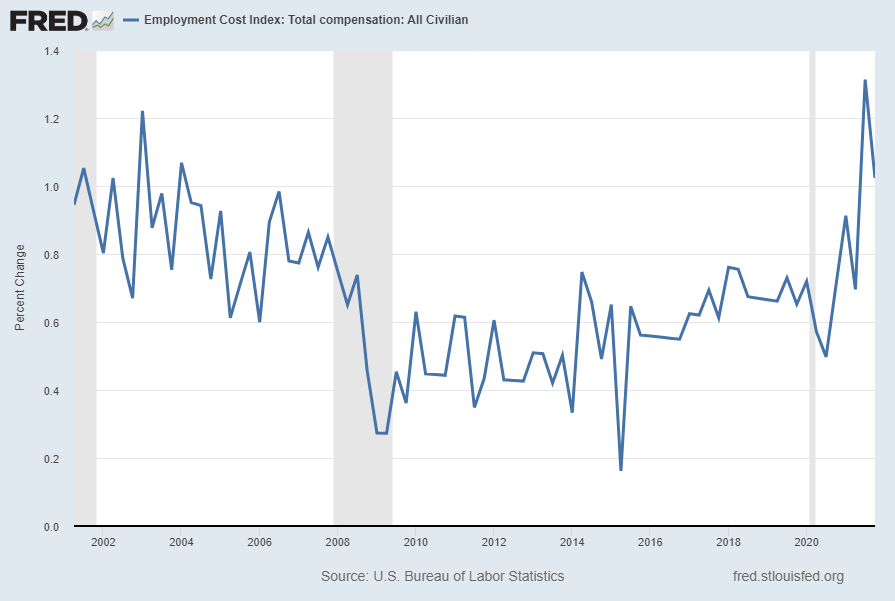
While the drivers of higher inflation have been predominantly connected to the dislocations caused by the pandemic, price increases have now spread to a broader range of goods and services. Wages have also risen briskly, and we are attentive to the risks that persistent real wage growth in excess of productivity could put upward pressure on inflation. Like most forecasters, we continue to expect inflation to decline over the course of the year.
Excerpts of Jerome Powell’s responses as indicated to various questions:
VICTORIA GUIDA. Hi, Chair Powell. I wanted to ask, you were talking about the health of the labor market. And I’m curious whether you would characterize where we’re at right now as maximum employment? And also, along those same lines, obviously, rate hikes on the table this year, do you think that the Fed can raise rates, bring inflation under control without hurting jobs and wages?
CHAIR POWELL. Sorry. Just getting both parts of your question written down. So, I would say — and this view is widely held on the Committee — that both sides of the mandate are calling for us to move steadily away from the very highly accommodative policies we put in place during the challenging economic conditions that the economy faced earlier in the pandemic. And I would say that most FOMC participants agree that labor market conditions are consistent with maximum employment in the sense of the highest level of employment that is consistent with price stability. And that is my personal view. And, again, very broad support on the Committee for the judgement that it will soon be appropriate to raise the target range for the federal funds rate. The other thing is maximum employment will evolve over time and through the course of a business cycle. In the particular situation we’re in now, it may well increase max – the level of maximum employment that’s consistent with stable prices may increase. And we hope that it will as more people come back into the labor market, as participation gradually rises. And the policy path that we’re broadly contemplating would be supportive of that comment — that outcome as well. So, the thing about the labor market right now is that there are — there are many millions of more job openings than there are unemployed people. So you ask whether we can — whether we can raise rates and move to a less accommodative and even tight financial conditions without hurting the labor market. I think there’s quite a bit of room to raise interest rates without threatening the labor market. This is, by so many measures, a historically tight labor market, record levels of job openings, of quits. Wages are moving up at the highest pace they have in decades. If you look at surveys of workers, they find jobs plentiful. Look at surveys of companies, they find workers scarce. And all of those readings are at levels really that we haven’t seen in a long time and, in some cases, ever. So, this is a very, very strong labor market. And my strong sense is that we can move rates up without having to, you know, severely undermine it. I also would point out that there are other forces at work this year, which should also help bring down inflation. We hope including improvement on the supply side, which will ultimately come at the timing and pace of that are uncertain. And also, fiscal policy is going to be less supportive of growth this year, not at the level of economic activity but the fiscal impulse to growth will be significantly lower. So there are multiple forces which should be working over the course of the year for inflation to come down. We do realize that the timing and pace of that are highly uncertain and that inflation has persisted longer than we thought. And, of course, we’re prepared to use our tools to assure that higher inflation does not become entrenched.
also:
NICK TIMIRAOS. So, if I could follow on that, raising rates and reducing the balance sheet both restrain the economy, both tighten monetary policy. How should we think about the relationship between the two? For example, how much passive runoff is equal to every quarter percentage point increase in your benchmark rate?
CHAIR POWELL. So, again, we think of the balance sheet as moving in a predictable manner, sort of in the background, and that the active tool meeting to meeting is not — both of them, it’s the federal funds rate. There are rules of thumbs. I’m reluctant to land on one of them that equate this. And there’s also an element of uncertainty around the balance sheet. I think we have a much better sense, frankly, of how rate increases affect financial conditions and, hence, economic conditions. Balance sheet is still a relatively new thing for the markets and for us, so we’re less certain about that. So, again, our — I think our — the pattern we’ll follow is to arrive at a, you know, a timing and a pace and composition and all those things and then announce that with advance notice, and it will start in the background. And then we will look to have that just running in the background and have the interest rates, again, be the active tool of monetary policy. That’s at least the plan. I can’t tell you much more about any of the very good issues about size, pace, composition, those sorts of things. But we’ll be turning to all of those at coming meetings.
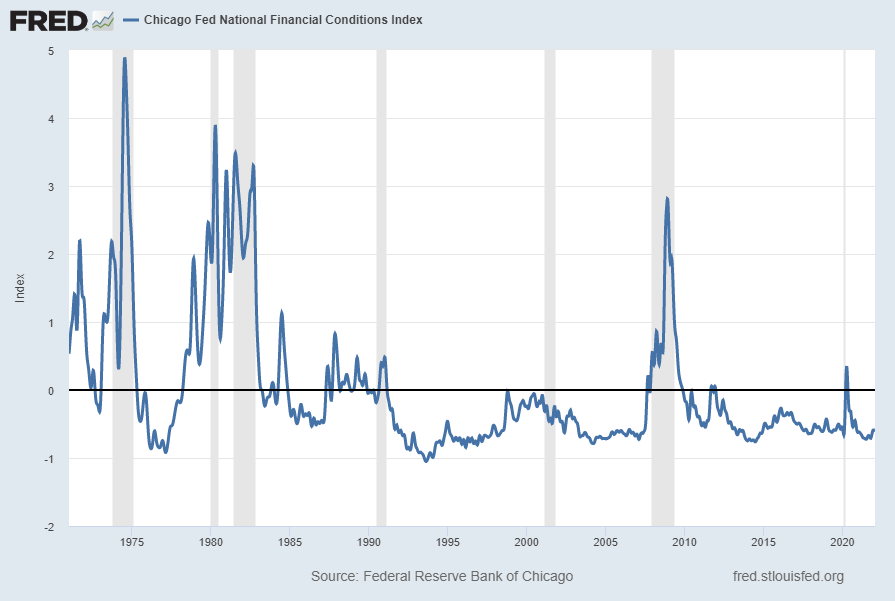
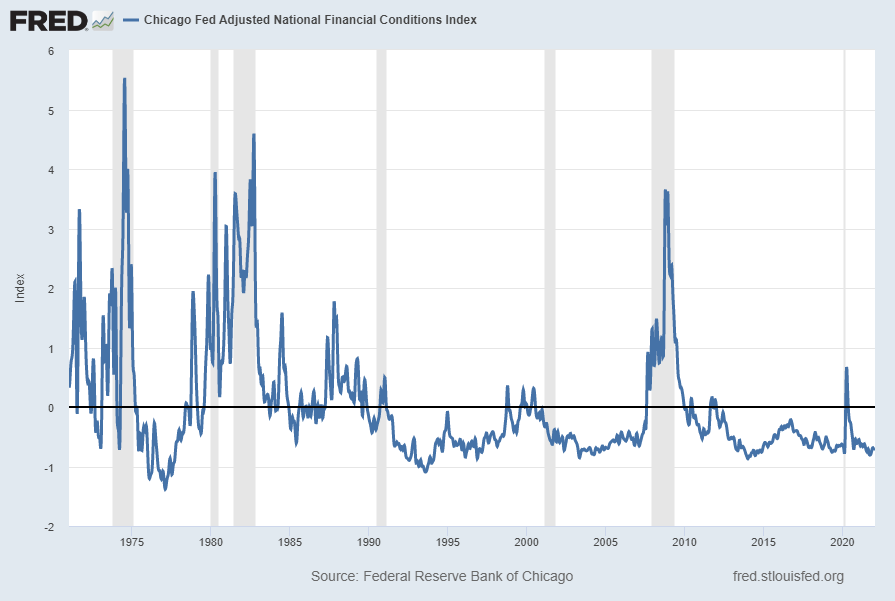
NEIL IRWIN. Thank you, Chair Powell. It’s Neil Irwin from Axios. Glad to be back. Sir, I was wondering if the volatility we’ve seen in the financial markets in the last few weeks strikes you as anything alarming or that might affect the trajectory of policy. Conversely, to the degree that financial conditions have tightened some, might that be desirable in some ways in achieving your tightening goals?
CHAIR POWELL. So, as you know, the ultimate focus that we have is on the real economy, maximum employment, and price stability. And financial conditions matter to the extent that they have implications for achieving the dual mandate. And you also know that we look at broader financial conditions, not one or two things, one or two markets. And what we’re always asking ourselves is, are we seeing changes that are both persistent and material enough that — of a change in financial conditions that they are inconsistent with the achievement of our goals? So that’s how we’re looking at that. And I don’t want to comment on today’s financial conditions broadly, but we’re not looking at any one market or so. So that’s how we’re thinking. In terms of what we’ve seen, I would say this. We — you know, we said at our last meeting we published the summary of economic projections, the meaning of which the median participant expected three rate increases this year. And, you know, it’s six weeks, seven weeks later now. And you have seen that our communication channel with the markets is working. Markets are now pricing in a number of rate increases. Surveys show that market participants are expecting a balance sheet runoff to begin, you know, at the appropriate time sometime later this year perhaps. We haven’t made that decision yet. So, we feel like the communications we have with market participants and with the general public are working and that financial conditions are reflecting in advance the decisions that we make. And monetary policy works significantly through expectations. So that in and of itself is appropriate.
also:
JEANNA SMIALEK. Thanks for taking our questions, Chair Powell. And sorry for my tech issues. I wonder if you could tell us a little bit about where your thinking on inflation stands today. You know, the last time we saw an SEP back in September, we saw that you and your colleagues were projecting that inflation would sort of sink back down quite close to target by the end of the year. And I wonder if you still think that projection from December is a reasonable one. And if your thinking has changed at all, I wonder how you’re thinking about that. And I also wonder if you could talk a little bit about the pathway to getting to that deceleration? Like, how do we get from here, 7 percent CPI to where you expect to be at the end of the year.
CHAIR POWELL. So I’d say, you know, since the December meeting, I would say that the inflation situation is about the same but probably slightly worse. I’d be inclined to raise my own estimate of 2022 core PCE inflation, let’s just go with that, by a few tenths today. But we’re not writing down an SEP at this meeting, but I think it’s — it hasn’t gotten better. It’s probably gotten just a bit worse, and that’s been the pattern. That’s been the pattern. So I think if you look at the FOMC participants are — there’s a range there. And that range has been moving to the right for a year now. And, by the way, if you look at other forecasters, essentially all other macro forecasters who do this for a living you’ve seen the same pattern. So what do we think about that? Well, I think we — you know, we wrote down rate increases in the December meetings, each of us individually. And I think to the extent the situation deteriorates further, our policy will have to address that, if it deteriorates meaningfully further, either in the time dimension or in the size of the inflation dimension. So that’s how we’re thinking about it. I — as I mentioned, though, I think it’s part of this will be that us, the Fed moving away from a very highly accommodative policy to a substantially less accommodative policy and then, over time, to a policy that’s not accommodative in time. I don’t know when that will be. That’s — those are the things that we’re thinking about. That’s part of it. Another part of it is that fiscal policy provided an impulse to growth over the last two years. That impulse will be less, in fact, will be negative this year. And so that’s another thing. The other one is we will eventually get relief on the supply side. And, you know, the ports will be cleared up. And there will be semiconductors and things like that. Now, what we’re learning is it’s just taking much longer. So I think — longer than expected. And that I think does raise the risk, that high inflation will be more persistent. I do think we’ll come off of the highs that we saw in the early part of this episode in the spring last year. But really, what’s — the question is going to be what is inflation running at? And so we’ll be watching that. And I — you know, we, our objective is to get inflation back down to 2 percent. It’s also to provide enough support to keep the labor market healthy. The labor market is very, very strong right now, and I think that strength will continue. There’s a — there’s really a shortage of workers. We see it, particularly among production and nonsupervisory workers and people in the lowest quartile. You see very large wage increases. I mentioned some of the other indicators. So I think that’s what we’re looking at. And we’re also — you know, we realize, I think, as everyone does that this outlook is quite uncertain and that we’re going to have to adapt. And we’re going to communicate as clearly as we can. But we’re going to have to be adaptable, and you know, move as appropriate.
also:
MICHAEL DERBY. Thank you for taking my question. I want to ask you, with the benefit of hindsight, and I realize, I mean, that is what it is. But do you feel that, you know, monetary policy and fiscal policy maybe did too much to react to the crisis and that part of the inflation problem that we’re having right now is because the government response, you know, collectively was more than what the economy ended up needing?
CHAIR POWELL. So I think it’s too soon to write that history, really. But what I would say is this. The — if you remember what it felt like at the beginning of the pandemic, literally the global economy shutting down in large part, including our own economy and people going to their homes for weeks on end and masks, and there are no vaccines and it could be a really long time to get them, you know — and then, you know, you have economic activity drops by a shocking amount in one — so there was a real risk of lasting damage. And I think Congress responded remarkably with the CARES Act, incredibly timely, very powerful. People will — there’ll always be flaws in these things but, in real time, it was a remarkable achievement. And we responded. And what we were able to do was, you know, stave off a collapse of the financial system at the beginning and make time for what really needed to happen, which was the income replacement and then the recovery that Congress enabled with the CARES Act. So, now, that was a lot of — that was a lot, and what we did was a lot. And, you know, now — so what we have now is we have the strongest recovery of any country. And we have a recovery that looks completely unlike other recoveries that we’ve had because we put so much support behind the recovery. And we’re managing the relatively high-class problems that come with that, which are high inflation and a labor shortage. So — and these are serious problems, very serious problems that we — you know, we’re working as hard as we can on. Was it too much? Again, I’m going to leave that to the historians and, but it — look. In 25 years, we’ll look back at this incident, which will be a, you know, 2-, 3-, 4-, 5-year period. And we’ll say, you know, we’ll have a much better basis to make a judgement about the actions that people took. But it was all founded, though, in a very strong reaction to a — you know, to a unique historical event. And I guess I’ll have to leave it at that. I look for — I hope I’ll be around to see how that looks in 25 years.
also:
BRIAN CHEUNG. Yeah. Within the context of other hiking cycles, it seems like worries about asset bubbles emerging as a result of easing rates has been part of that. I didn’t know if that was part of the discussion today.
CHAIR POWELL. I would just say this. We, of course, have a financial stability framework. And what it shows is a number of positive aspects of financial stability. But you mentioned really asset prices is one of the four. So asset prices are somewhat elevated, and they reflect a high-risk appetite and that sort of thing. I don’t really think asset prices themselves represent a significant threat to financial stability, and that’s because households are in good shape financially than they have been. Businesses are in good shape financially. Defaults on business loans are low and that kind of thing. The banks are highly capitalized with high liquidity and quite resilient and strong. There are some concerns in the non-bank financial sector around — still around money market funds, although the SEC is making — has made some very positive proposals there. And we also saw some things in the Treasury market during the acute phase of the crisis which we’re looking at ways to address. But, overall, the financial stability vulnerabilities are manageable, are manageable, I would say.
_____
_____
The Special Note summarizes my overall thoughts about our economic situation
SPX at 4409.59 as this post is written