Thursday, December 27, 2018

Consumer Confidence Surveys – As Of December 27, 2018

The Doug Short site had a post of December 27, 2018 (“Consumer Confidence Declined Again in December“) that displays the latest Conference Board Consumer Confidence and Thomson/Reuters University of Michigan Consumer Sentiment Index charts.  They are presented below:
(click on charts to enlarge images)
Conference Board Consumer Confidence
University of Michigan Consumer Sentiment
There are a few aspects of the above charts that I find highly noteworthy.  Of course, until the sudden upswing in 2014, the continued subdued absolute levels of these two surveys was disconcerting.
Also, I find the “behavior” of these readings to be quite disparate as compared to the other post-recession periods, as shown in the charts between the gray shaded areas (the gray areas denote recessions as defined by the NBER.)
While I don’t believe that confidence surveys should be overemphasized, I find these readings to be notable, especially in light of a variety of other highly disconcerting measures highlighted throughout this site.
_____
The Special Note summarizes my overall thoughts about our economic situation
SPX at 2426.22 as this post is written

misc. note – corrections of blog posts

In the July 2, 2010 post I explained my policy with regard to changing the content of posts after the day the posts have been published on the blog.
While I change bad links and incorrect formatting without notification, I believe that changing blog posts’ content warrants disclosure.
Over time I have made corrections to content on various blog posts.  These corrections generally have been for reasons of (factual) accuracy and – for better readability – to correct typos and/or incorrect extraneous wording.
A list of these corrections is seen below.  This list indicates the posts corrected and the reason for such corrections.  The error as seen in the original posting is seen in bold:

Wednesday, December 26, 2018

Updates Of Economic Indicators December 2018

Here is an update of various indicators that are supposed to predict and/or depict economic activity. These indicators have been discussed in previous blog posts:
The December 2018 Chicago Fed National Activity Index (CFNAI) updated as of December 24, 2018:
The CFNAI, with current reading of .22:
CFNAI
source:  Federal Reserve Bank of Chicago, Chicago Fed National Activity Index [CFNAI], retrieved from FRED, Federal Reserve Bank of St. Louis, December 24, 2018;
https://fred.stlouisfed.org/series/CFNAI
The CFNAI-MA3, with current reading of .12:
CFNAIMA3
source:  Federal Reserve Bank of Chicago, Chicago Fed National Activity Index: Three Month Moving Average [CFNAIMA3], retrieved from FRED, Federal Reserve Bank of St. Louis, December 24, 2018;
https://fred.stlouisfed.org/series/CFNAIMA3
As of December 21, 2018 (incorporating data through December 14, 2018) the WLI was at 144.7 and the WLI, Gr. was at -3.9%.
A chart of the WLI,Gr., from the Doug Short’s site ECRI update post of December 21, 2018:
ECRL WLI,Gr.
Here is the latest chart, depicting the ADS Index from December 31, 2007 through December 15, 2018:
ADS Index
The Conference Board Leading (LEI), Coincident (CEI) Economic Indexes, and Lagging Economic Indicator (LAG):
As per the December 20, 2018 press release, titled “The Conference Board Leading Economic Index (LEI) for the U.S. Increased Slightly in November” (pdf) the LEI was at 111.8, the CEI was at 104.9, and the LAG was 106.0 in November.
An excerpt from the release:
“The LEI increased slightly in November, but its overall pace of improvement has slowed in the last two months,” said Ataman Ozyildirim, Director of Economic Research at The Conference Board. “Despite the recent volatility in stock prices, the strengths among the leading indicators have been widespread. Solid GDP growth at about 2.8 percent should continue in early 2019, but the LEI suggests the economy is likely to moderate further in the second half of 2019.”
Here is a chart of the LEI from the Doug Short’s site Conference Board Leading Economic Indexupdate of December 20, 2018:
Conference Board LEI

_________
I post various indicators and indices because I believe they should be carefully monitored.  However, as those familiar with this site are aware, I do not necessarily agree with what they depict or imply.
_____
The Special Note summarizes my overall thoughts about our economic situation
SPX at 2351.10 as this post is written

Friday, December 21, 2018

S&P500 Price Projections – Livingston Survey December 2018

The December 2018 Livingston Survey (pdf) published on December 21, 2018 contains, among its various forecasts, a S&P500 forecast.  It shows the following price forecast for the dates shown:
Dec. 31, 2018  2754.4
Jun. 28, 2019   2829.9
Dec. 31, 2019  2900.0
Dec. 31, 2020 3000.0
These figures represent the median value across the forecasters on the survey’s panel.
_____
I post various economic forecasts because I believe they should be carefully monitored.  However, as those familiar with this site are aware, I do not agree with many of the consensus estimates and much of the commentary in these forecast surveys.
_____
The Special Note summarizes my overall thoughts about our economic situation
SPX at 2476.57 as this post is written

Money Supply Charts Through November 2018

For reference purposes, below are two sets of charts depicting growth in the money supply.
The first shows the MZM (Money Zero Maturity), defined in FRED as the following:
M2 less small-denomination time deposits plus institutional money funds.
Money Zero Maturity is calculated by the Federal Reserve Bank of St. Louis.
Here is the “MZM Money Stock” (seasonally adjusted) chart, updated on December 21, 2018 depicting data through November 2018, with a value of $15,631.3 Billion:
MZM money supply chart
Here is the “MZM Money Stock” chart on a “Percent Change From Year Ago” basis, with a current value of 3.0%:
MZM money stock Percent Change From Year Ago
Data Source: FRED, Federal Reserve Economic Data, Federal Reserve Bank of St. Louis; accessed December 21, 2018;
https://research.stlouisfed.org/fred2/series/MZMSL
The second set shows M2, defined in FRED as the following:
M2 includes a broader set of financial assets held principally by households. M2 consists of M1 plus: (1) savings deposits (which include money market deposit accounts, or MMDAs); (2) small-denomination time deposits (time deposits in amounts of less than $100,000); and (3) balances in retail money market mutual funds (MMMFs). Seasonally adjusted M2 is computed by summing savings deposits, small-denomination time deposits, and retail MMMFs, each seasonally adjusted separately, and adding this result to seasonally adjusted M1.
Here is the “M2 Money Stock” (seasonally adjusted) chart, updated on December 20, 2018, depicting data through November 2018, with a value of $14,318.1 Billion:
M2 Money Stock chart
Here is the “M2 Money Stock” chart on a “Percent Change From Year Ago” basis, with a current value of 3.9%:
M2 Money Stock Percent Change From A Year Ago chart
Data Source: FRED, Federal Reserve Economic Data, Federal Reserve Bank of St. Louis; accessed December 21, 2018;
https://research.stlouisfed.org/fred2/series/M2SL
_____
The Special Note summarizes my overall thoughts about our economic situation
SPX at 2488.81 as this post is written

Durable Goods New Orders – Long-Term Charts Through November 2018

Many people place emphasis on Durable Goods New Orders as a prominent economic indicator and/or leading economic indicator.
For reference, below are two charts depicting this measure.
First, from the St. Louis Fed site (FRED), a chart through November 2018, updated on December 21, 2018. This value is $250,827 ($ Millions):
(click on charts to enlarge images)
Durable Goods New Orders chart
Second, here is the chart depicting this measure on a “Percentage Change from a Year Ago” basis, with a last value of 5.3%:
Durable Goods New Orders Percent Change From Year Ago
Data Source: FRED, Federal Reserve Economic Data, Federal Reserve Bank of St. Louis: Manufacturers’ New Orders:  Durable Goods [DGORDER]; U.S. Department of Commerce: Census Bureau; accessed December 21, 2018;
http://research.stlouisfed.org/fred2/series/DGORDER
_________
I post various indicators and indices because I believe they should be carefully monitored.  However, as those familiar with this site are aware, I do not necessarily agree with what they depict or imply.
_____
The Special Note summarizes my overall thoughts about our economic situation
SPX at 2477.27 as this post is written

The U.S. Economic Situation – December 21, 2018 Update

Perhaps the main reason that I write of our economic situation is that I continue to believe, based upon various analyses, that our economic situation is in many ways misunderstood.  While no one likes to contemplate a future rife with economic adversity, current and future economic problems must be properly recognized and rectified if high-quality, sustainable long-term economic vitality is to be realized.
There are an array of indications and other “warning signs” – many readily apparent – that current economic activity and financial market performance is accompanied by exceedingly perilous dynamics.
I have written extensively about this peril, including in the following:
Building Financial Danger” (ongoing updates)
My analyses continues to indicate that the growing level of financial danger will lead to the next stock market crash that will also involve (as seen in 2008) various other markets as well.  Key attributes of this next crash is its outsized magnitude (when viewed from an ultra-long term historical perspective) and the resulting economic impact.  This next financial crash is of tremendous concern, as my analyses indicate it will lead to a Super Depression – i.e. an economy characterized by deeply embedded, highly complex, and difficult-to-solve problems.
For long-term reference purposes, here is a chart of the Dow Jones Industrial Average since 1900, depicted on a monthly basis using a LOG scale (updated through December 14, 2018, with a last value of 24100.51):
(click on chart to enlarge image)(chart courtesy of StockCharts.com)
_____
The Special Note summarizes my overall thoughts about our economic situation
SPX at 2467.42 as this post is written

Thursday, December 20, 2018

Deflation Probabilities – December 20, 2018 Update

While I do not agree with the current readings of the measure – I think the measure dramatically understates the probability of deflation, as measured by the CPI – the Federal Reserve Bank of Atlanta maintains an interesting data series titled “Deflation Probabilities.”
As stated on the site:
Using estimates derived from Treasury Inflation-Protected Securities (TIPS) markets, described in a technical appendix, this weekly report provides two measures of the probability of consumer price index (CPI) deflation through 2022.
A chart shows the trends of the probabilities.  As one can see in the chart, the readings are volatile.
As for the current weekly reading, the December 20, 2018 update states the following:
Both the 2017–22 deflation probability and the 2018–23 deflation probability were 7 percent on December 19, unchanged from December 12. These deflation probabilities, measuring the likelihoods of net declines in the consumer price index over the five-year periods starting in early 2017 and early 2018, are estimated from prices of the five-year Treasury Inflation-Protected Securities (TIPS) issued in April 2017 and April 2018 and the 10-year TIPS issued in July 2012 and July 2013. The next deflation probabilities update is scheduled for January 3, 2019.
_________
I post various economic indicators and indices because I believe they should be carefully monitored.  However, as those familiar with this site are aware, I do not necessarily agree with what they depict or imply.
_____
The Special Note summarizes my overall thoughts about our economic situation
SPX at 2478.77 as this post is written

Jerome Powell’s December 19, 2018 Press Conference – Notable Aspects

On Wednesday, December 19, 2018 Jerome Powell gave his scheduled December 2018 FOMC Press Conference. (link of video and related materials)
Below are Jerome Powell’s comments I found most notable – although I don’t necessarily agree with them – in the order they appear in the transcript.  These comments are excerpted from the “Transcript of Chairman Powell’s Press Conference“ (preliminary)(pdf) of December 19, 2018, with the accompanying “FOMC Statement” and “Economic Projections of Federal Reserve Board Members and Federal Reserve Bank Presidents, December 2018“ (pdf).
From Chairman Powell’s opening comments:
Over the past year, the economy has been growing at a strong pace, the unemployment rate has been near record lows, and inflation has been low and stable. All of those things remain true today. Since the September meeting of the FOMC, however, some crosscurrents have emerged. I’ll explain how my colleagues and I are incorporating those crosscurrents into our judgments about the outlook and the appropriate course of policy. 
Since September, the U.S. economy has continued to perform well, roughly in line with our expectations. The economy has been adding jobs at a pace that will continue bringing the unemployment rate down over time. Wages have moved up for workers across a wide range of occupations, a welcome development. Inflation has remained low and stable, and is ending the year a bit more subdued than most had expected. Although some American families and communities continue to struggle and some longer-term economic problems remain, the strong economy is benefiting many Americans. 
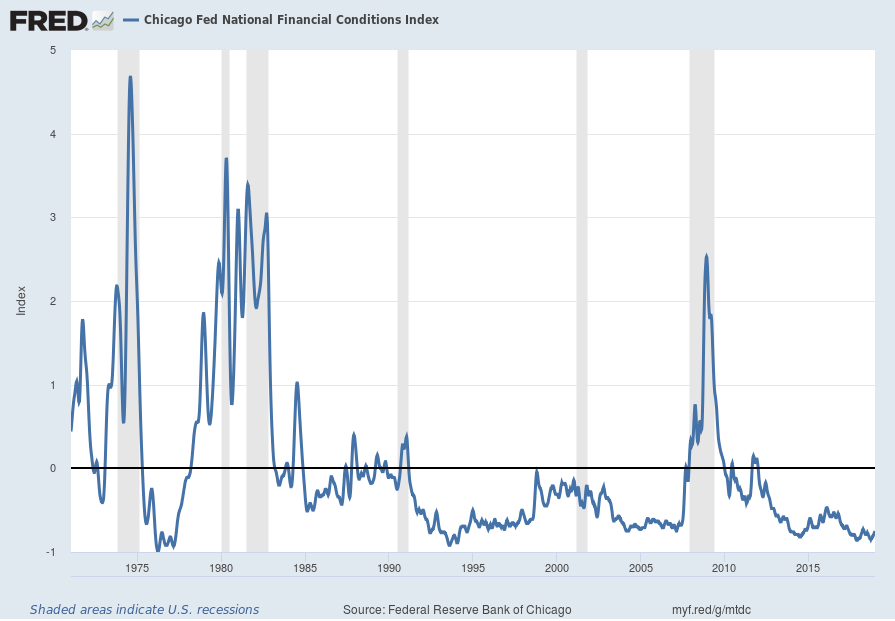
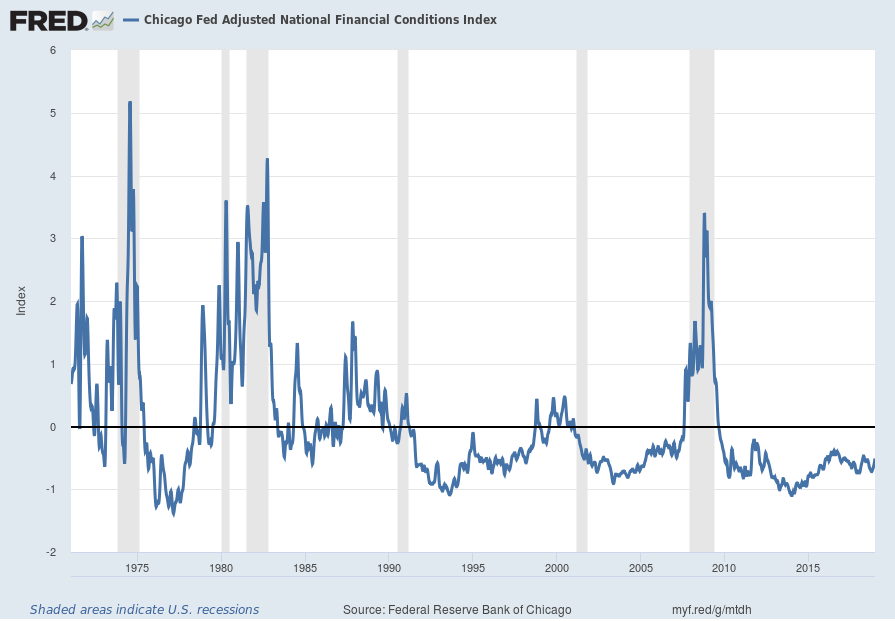
Despite this robust economic backdrop and our expectation for healthy growth, we have seen developments that may signal some softening relative to what we were expecting a few months ago. Growth in other economies around the world has moderated somewhat over the course of 2018, albeit to still-solid levels. At the same time, financial market volatility has increased over the past couple of months, and overall financial conditions have tightened–that is, they have become less supportive of growth. 
In our view, these developments have not fundamentally altered the outlook. Most FOMC participants have, instead, modestly lowered their growth and inflation forecasts for next year. The projections of Committee participants released today show growth continuing at healthy levels, the unemployment rate falling a bit further next year, and inflation remaining near 2 percent. The projections also show a modestly lower path for the federal funds rate, which should support the economy and keep us near our goals. As the economy struggled to recover from the financial crisis and the subsequent recession, the Committee held our policy rate near zero for seven years to give the economy the best chance to recover. And the economy did recover steadily, if slowly at times. Three years ago the Committee came to the view that the best way to achieve our mandate was to gradually move interest rates back to levels that are more normal in a healthy economy. Today, we raised our target range for short-term interest rates by another quarter of a percentage point. As I’ve mentioned, most of my colleagues expect the economy to continue to perform well in the coming year. Many FOMC participants had expected that economic conditions would likely call for about three more rate increases in 2019. We have brought that down a bit and now think it is more likely that the economy will grow in a way that will call for two interest rate increases over the course of next year.
Jerome Powell’s responses as indicated to the various questions:
BINYAMIN APPLEBAUM. Binyamin Applebaum, The New York Times. You’re about to undershoot your inflation target for the seventh straight year. Your new forecasts say that you’re going to undershoot it for the eighth straight year. Should we interpret the dot plot is suggesting that some members of your Committee believe that policy should be in a restrictive range by the end of next year? And if so, can you help us to understand why people would be advocating restrictive monetary policy at a time of persistent inflation undershoots?
CHAIRMAN POWELL. Well, we, as a Committee, we do not desire inflation undershoots. And you’re right, inflation has continued to surprise to the downside, not by a lot though, I think. We’re very close to 2 percent, and you know, we do believe it’s a symmetric goal for us. Inflation is symmetric around 2 percent, and that’s how we’re going to look at it. We’re not trying to be under 2 percent. We’re trying to be symmetrically around 2 percent, and I don’t, you know, I’ve never said that I feel like we’ve achieved that goal yet. The only way to achieve inflation symmetrically around 2 percent is to have inflation symmetrically around 2 percent, and we’ve been close to that. We haven’t gotten there yet, and we have not declared victory on that. So, that remains to be accomplished.
JEANNA SMIALEK. Hi, Jeanna Smialek, Bloomberg News. Just following up on Binyamin’s question. I guess if you haven’t achieved 2 percent inflation and you don’t see an overshoot, which would be sort of implied by a symmetrical target, what’s the point in raising rates again at all? 
CHAIRMAN POWELL. So again, I go back to the health of the economy. When you look at 2018, as I mentioned, this the best year since the financial crisis. You’ve had growth well above trend. You’ve got unemployment dropping. You’ve got inflation moving up to 2 percent. And we also have a positive forecast, as I mentioned, and in that context, we think this move was appropriate for what is a very healthy economy. 
Policy at this point does not need to be accommodative. It can move to neutral. It seems appropriate that it be neutral. We’re now at the bottom end of range of estimates of neutral. So that’s the basis upon which we made the decision. I also think we took onboard, you know, the risks to that, and, you know, we’re certainly cognizant of them. 
also:
NANCY MARSHALL-GENZER. Nancy Marshall-Genzer with Marketplace. Do you still think core PCE is a good measure of whether the economy is overheating? What do you think of other measures like setting a target for economic growth and relying more on that? 
CHAIRMAN POWELL. Well, I think we look at both, but core PCE is a good indicator. It has, what’s happened over really 50 years is that inflation has become much less reactive to changes in growth. There was a time when inflation reacted really quickly to changes in growth and changes in unemployment. And that time is behind us. And that is often attributed to the success of central banks in anchoring inflation expectations so that people believe that inflation will come back to the target or around the target so it doesn’t go down as much, inflation doesn’t go down as much, and a downturn doesn’t go up as much when the, you know, when the economy is strong.  It’s really true, though, that inflation has not reacted a lot on a road from 10 percent unemployment to now 3.7 percent unemployment. Now it did move up last year. But in terms of just targeting growth, you know, I think actually think our dual mandate works very well, which is maximum employment and stable prices. Most of the time, those two things work together. When they work temporarily in different ways, we take a balanced approach. But I think that approach has served us well, and I think we can work well with it.
also:
COURTENAY BROWN. Hi Chairman, Courtenay Brown from Axios. I’m wondering if you could clear up what’s become a little bit of a debate in the financial community. You said in October in an interview with PBS that interest rates were a long way from neutral. A month later you said interest rates were just below neutral. And I think a lot of people interpreted that as a shift in tone from you. Were they right to interpret it that way? 
CHAIRMAN POWELL. You know, monetary policy is a forward-looking exercise, and I’m going to, I’m just going to stick with that. It’s, where we are right now is we’re at the lower end of the range of neutral. We’ve arrived effectively at the bottom end of that range. And, you know, there are implications of that. For that, as I mentioned, going forward, there’s real uncertainty about the path, the pace rather, and the destination for further rate increases. And we’re going to be letting incoming data inform our thinking about the appropriate path.
_____
_____
The Special Note summarizes my overall thoughts about our economic situation
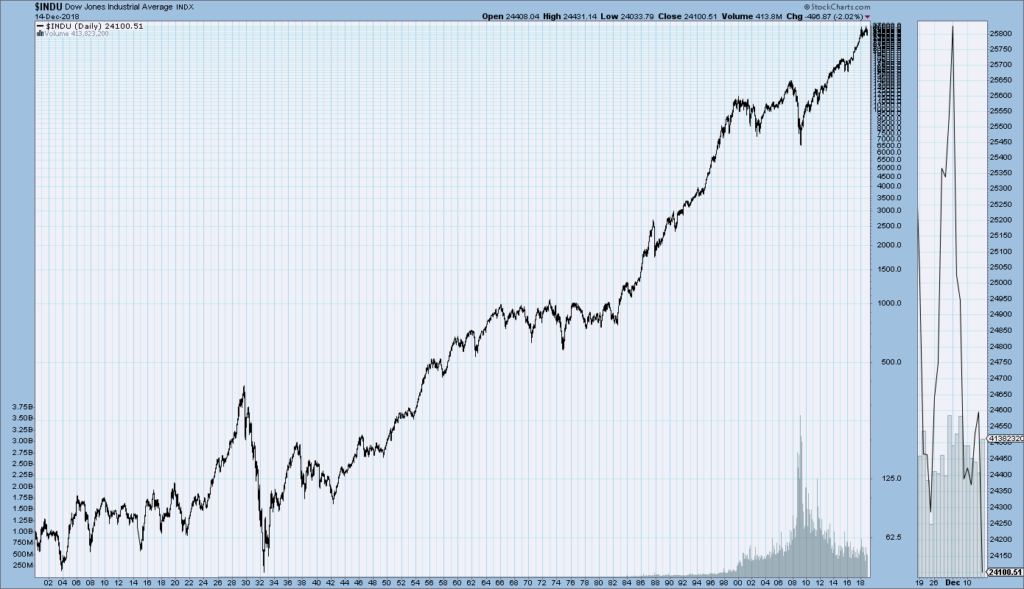
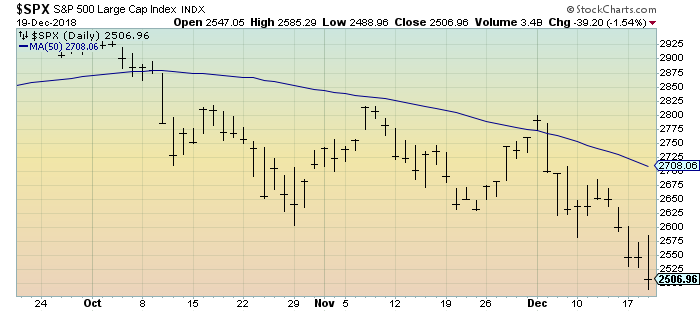
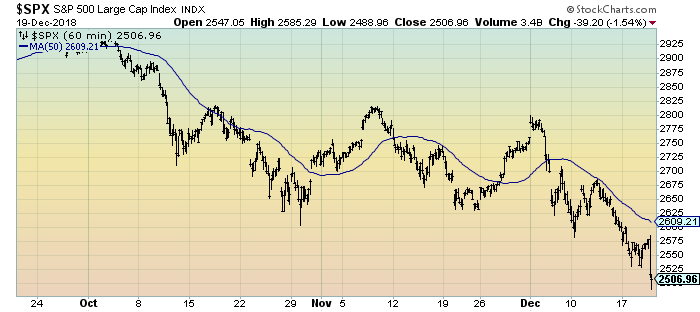
SPX at 2470.23 as this post is written

Four Charts Of Recent S&P500 Price Volatility – December 20, 2018

This post is an update to past posts regarding stock market volatility.
While I track many different measures of volatility, I find the following charts to be both simple and clear in depicting the recent volatility in the stock market.
Overall, my analyses indicates that there are many reasons for this volatility, and the volatility is highly significant.
First, a one-year daily depiction of the S&P500 through Wednesday’s (December 19, 2018) close, with a 50-day moving average (MA50) depicted by the blue line:
(click on chart to enlarge image)(charts courtesy of StockCharts.com)
Second, a three-month daily depiction of the S&P500 through Wednesday’s (December 19, 2018) close, with a 50-day moving average (MA50) depicted by the blue line:
S&P500 daily chart
Third, a three-month depiction of the S&P500 in 60-minute intervals through Wednesday’s (December 19, 2018) close, with a 50-hour moving average (MA50) depicted by the blue line:
S&P500 chart
Fourth, a one-month depiction of the S&P500 in 10-minute intervals through Wednesday’s (December 19, 2018) close, with a 50-period moving average (MA50) depicted by the blue line:
_____
The Special Note summarizes my overall thoughts about our economic situation
SPX at 2506.96 as this post is written

Wednesday, December 19, 2018

Chicago Fed National Financial Conditions Index (NFCI)

The St. Louis Fed’s Financial Stress Index (STLFSI) is one index that is supposed to measure stress in the financial system.  Its reading as of the December 13, 2018 update (reflecting data through December 7, 2018) is -.815.
Of course, there are a variety of other measures and indices that are supposed to measure financial stress and other related issues, both from the Federal Reserve as well as from private sources.
Two other indices that I regularly monitor include the Chicago Fed National Financial Conditions Index (NFCI) as well as the Chicago Fed Adjusted National Financial Conditions Index (ANFCI).
Here are summary descriptions of each, as seen in FRED:
The National Financial Conditions Index (NFCI) measures risk, liquidity and leverage in money markets and debt and equity markets as well as in the traditional and “shadow” banking systems. Positive values of the NFCI indicate financial conditions that are tighter than average, while negative values indicate financial conditions that are looser than average.
The adjusted NFCI (ANFCI). This index isolates a component of financial conditions uncorrelated with economic conditions to provide an update on how financial conditions compare with current economic conditions.
For further information, please visit the Federal Reserve Bank of Chicago’s web site:
Below are the most recently updated charts of the NFCI and ANFCI, respectively.
The NFCI chart below was last updated on December 19, 2018 incorporating data from January 8, 1971 through December 14, 2018, on a weekly basis.  The December 14 value is -.75:
NFCI
Data Source: FRED, Federal Reserve Economic Data, Federal Reserve Bank of St. Louis; accessed December 19, 2018: 
http://research.stlouisfed.org/fred2/series/NFCI
The ANFCI chart below was last updated on December 19, 2018 incorporating data from January 8, 1971 through December 14, 2018, on a weekly basis.  The December 14 value is -.51:
ANFCI
Data Source: FRED, Federal Reserve Economic Data, Federal Reserve Bank of St. Louis; accessed December 19, 2018: 
http://research.stlouisfed.org/fred2/series/ANFCI
_________
I post various indicators and indices because I believe they should be carefully monitored.  However, as those familiar with this site are aware, I do not necessarily agree with what they depict or imply.
_____
The Special Note summarizes my overall thoughts about our economic situation
SPX at 2506.96 as this post is written

Tuesday, December 18, 2018

Trends Of S&P500 Earnings Forecasts

S&P500 earnings trends and estimates are a notably important topic, for a variety of reasons, at this point in time.
FactSet publishes a report titled “Earnings Insight” that contains a variety of information including the trends and expectations of S&P500 earnings.
For reference purposes, here are two charts as seen in the “Earnings Insight” (pdf) report of December 14, 2018:
from page 24:
(click on charts to enlarge images)
S&P500 EPS forecasts
from page 25:
S&P500 annual EPS
_____
I post various economic forecasts because I believe they should be carefully monitored.  However, as those familiar with this site are aware, I do not agree with many of the consensus estimates and much of the commentary in these forecast surveys.
_____
The Special Note summarizes my overall thoughts about our economic situation
SPX at 2545.94 as this post is written