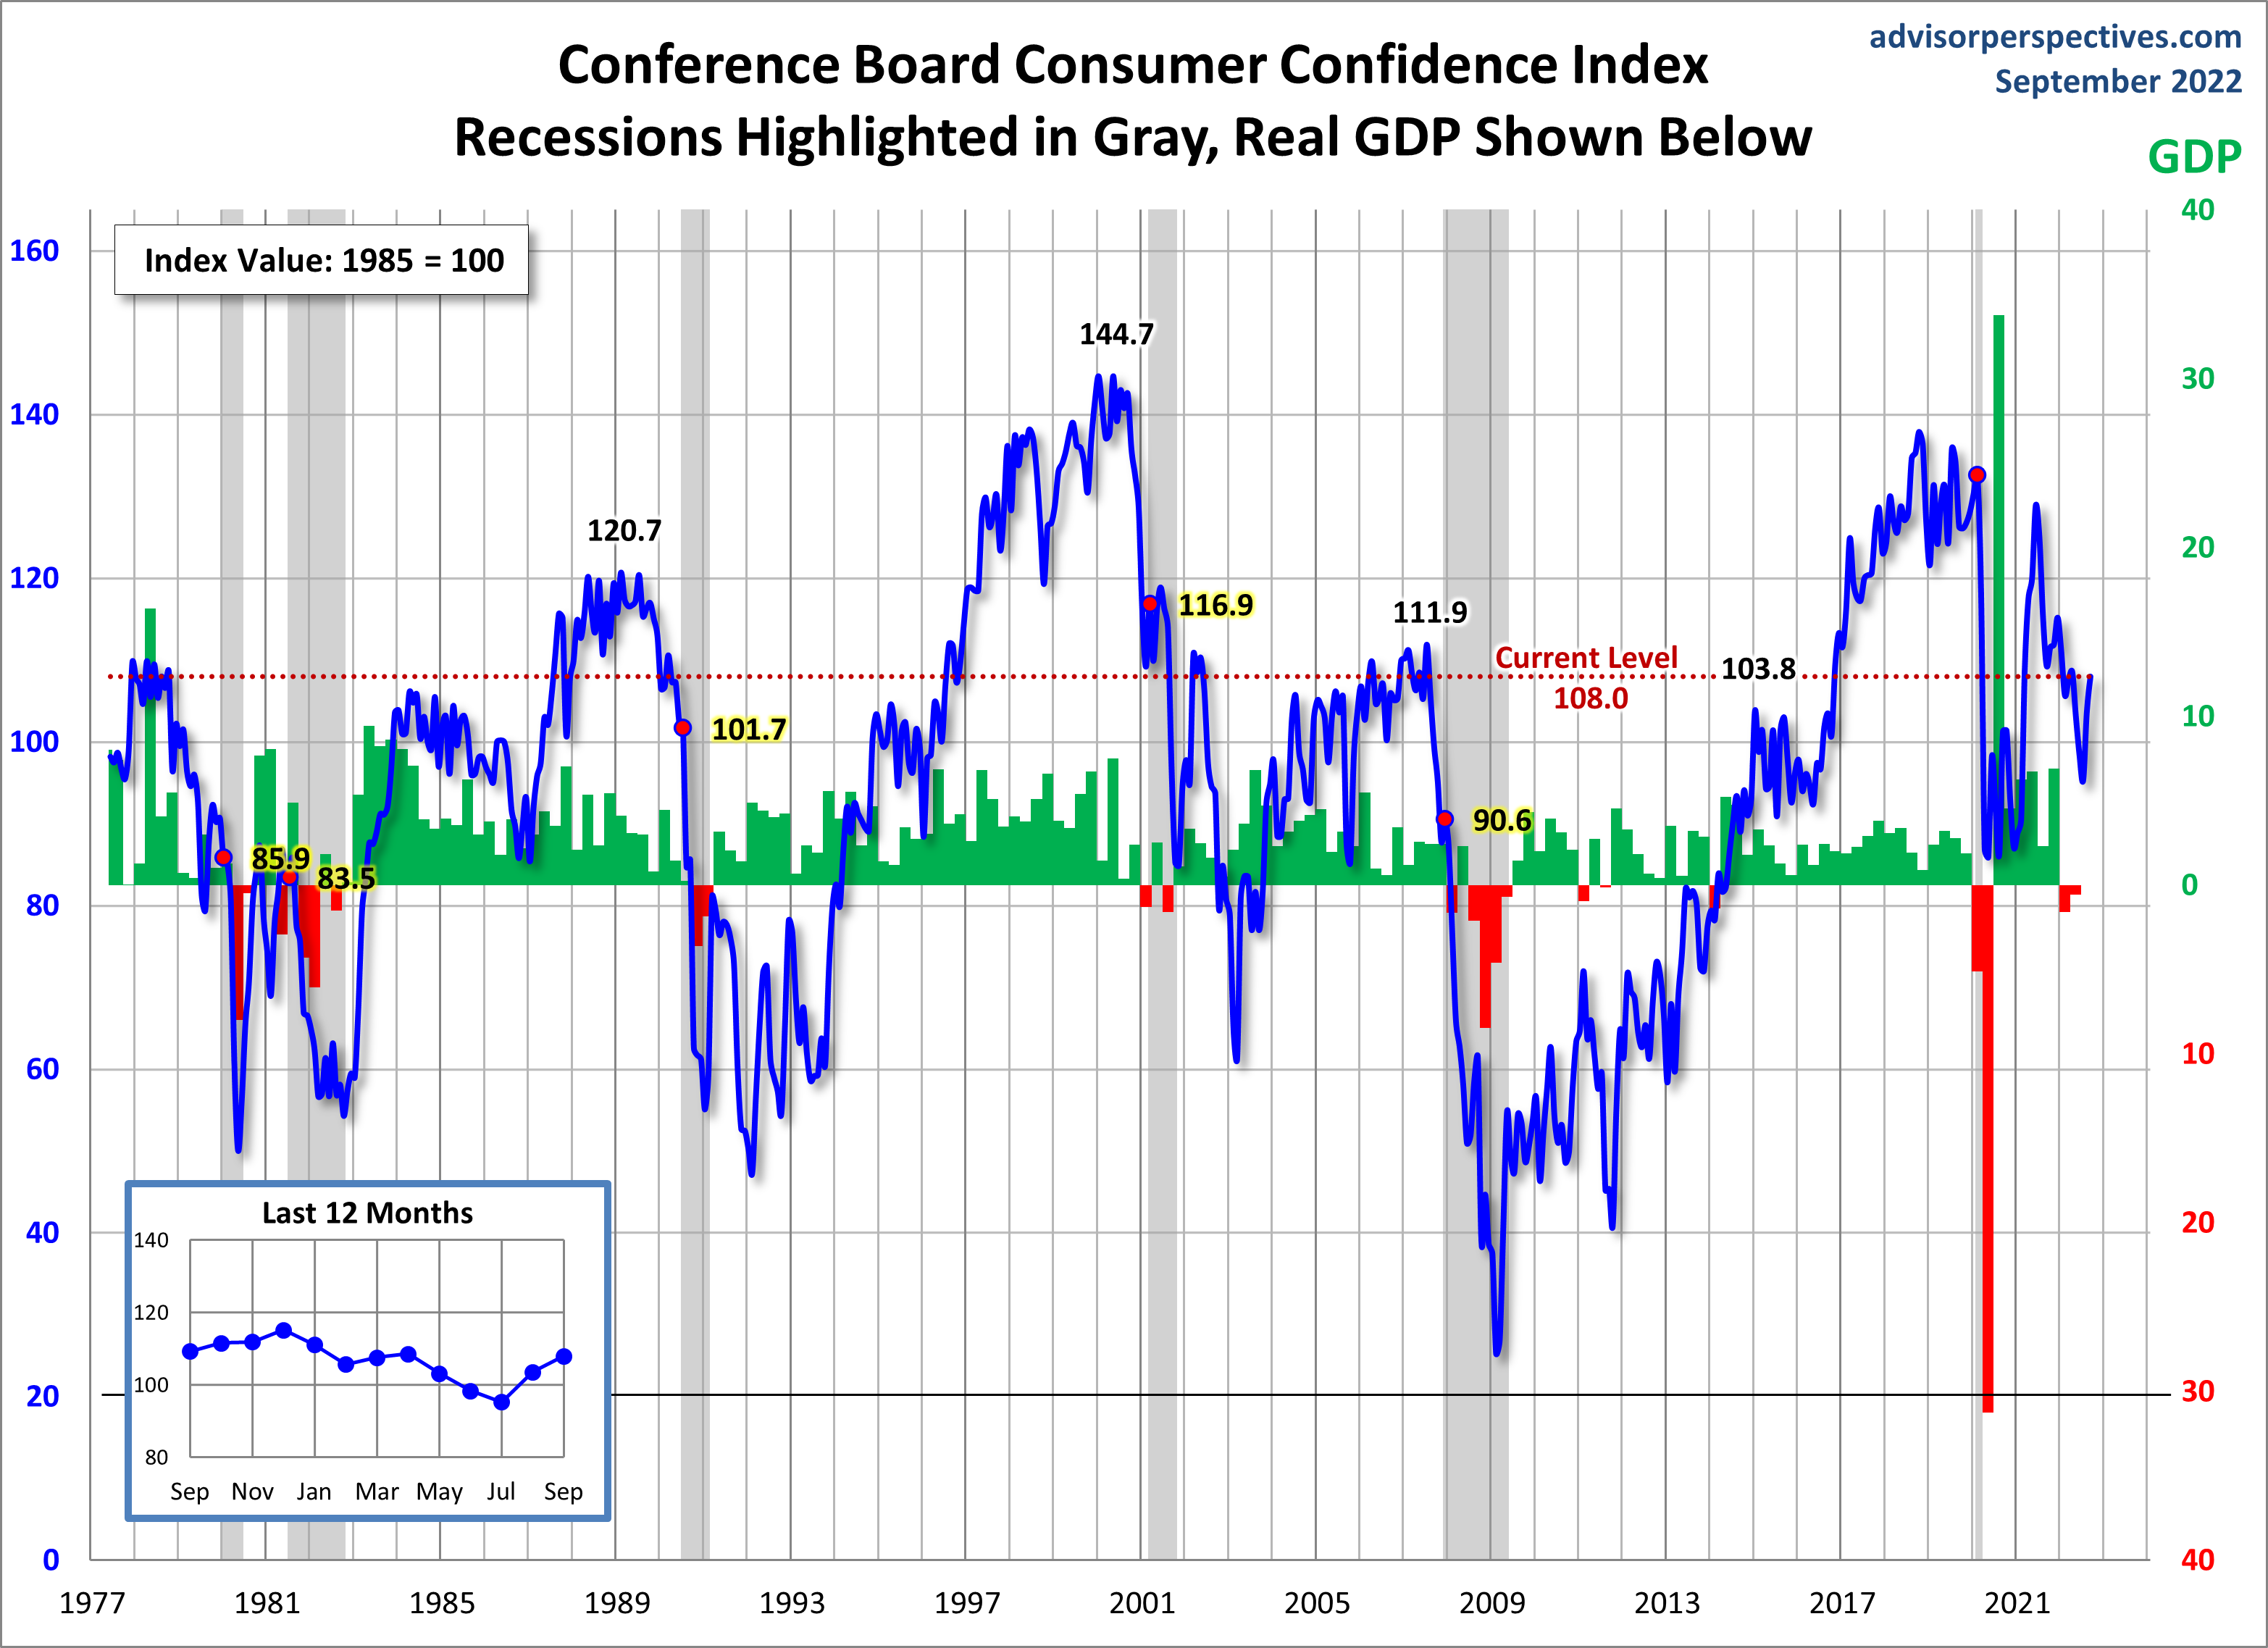
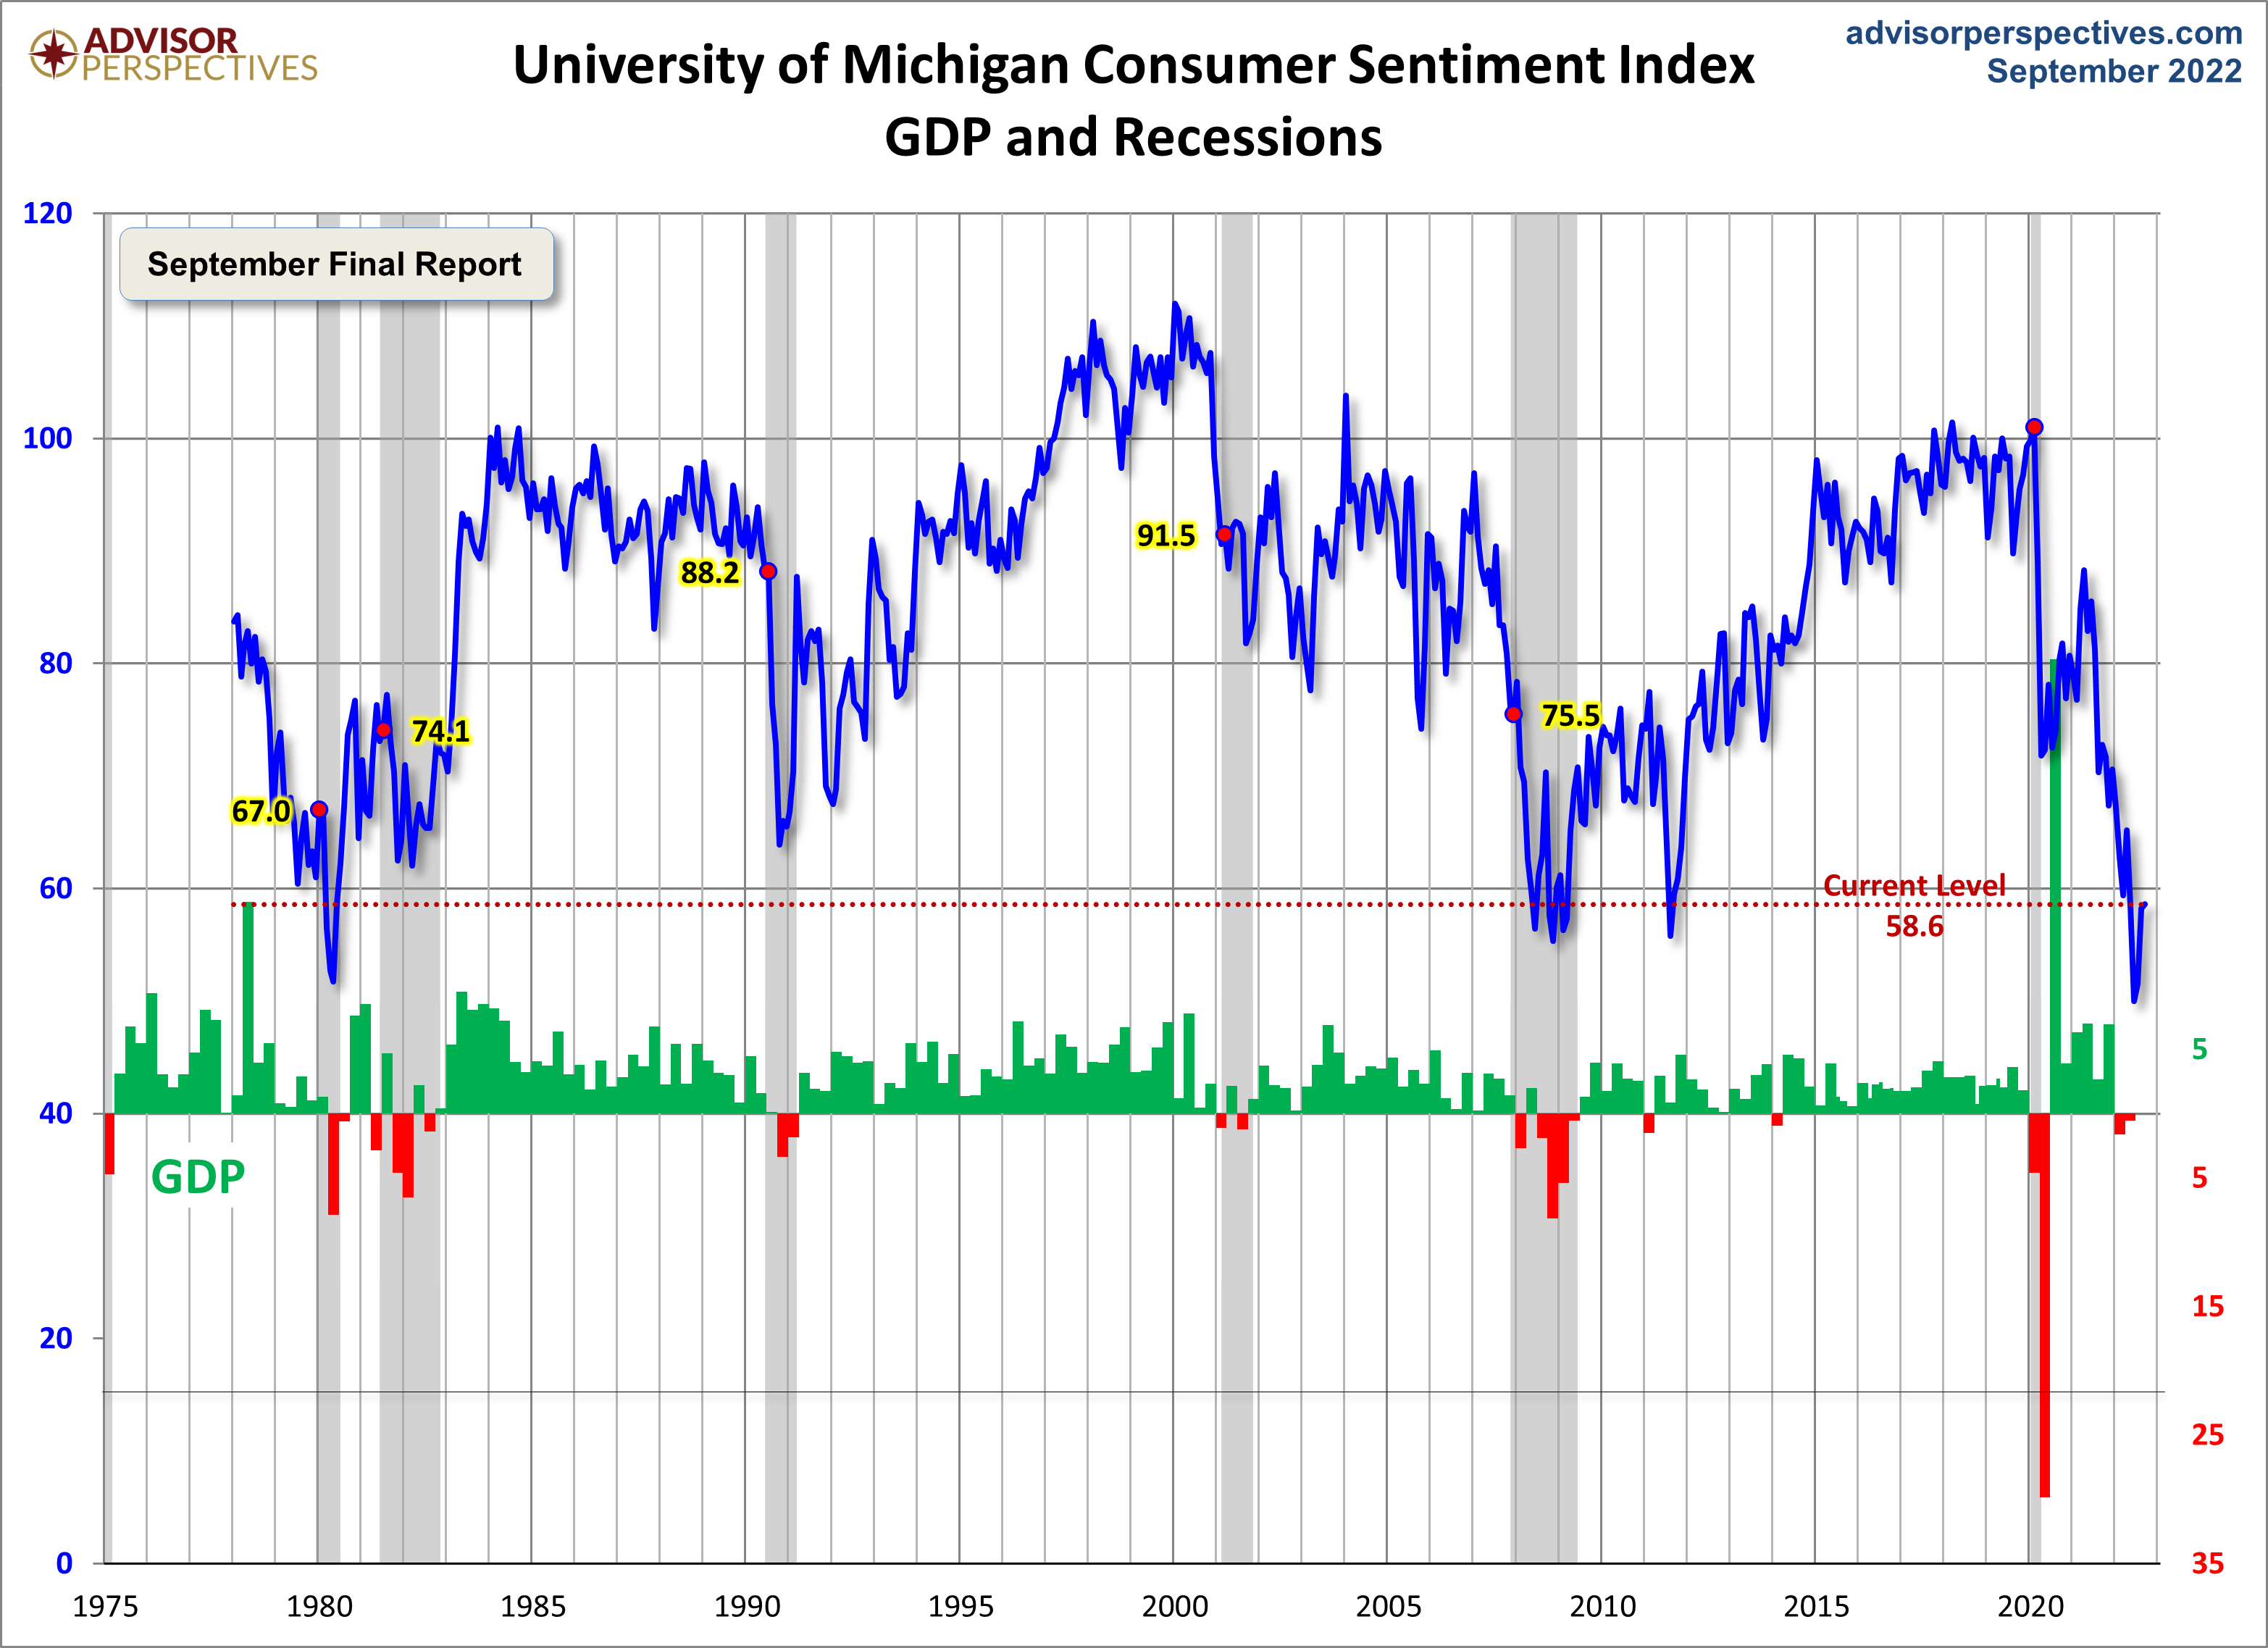
Advisor Perspectives had a post of September 30, 2022 (“Michigan Consumer Sentiment Mostly Unchanged in September“) that displays the latest Conference Board Consumer Confidence and University of Michigan Consumer Sentiment Index charts. They are presented below:
(click on charts to enlarge images)
–
While I don’t believe that confidence surveys should be overemphasized, I find these readings and trends to be notable, especially in light of a variety of other highly disconcerting measures highlighted throughout this site.
_____
The Special Note summarizes my overall thoughts about our economic situation
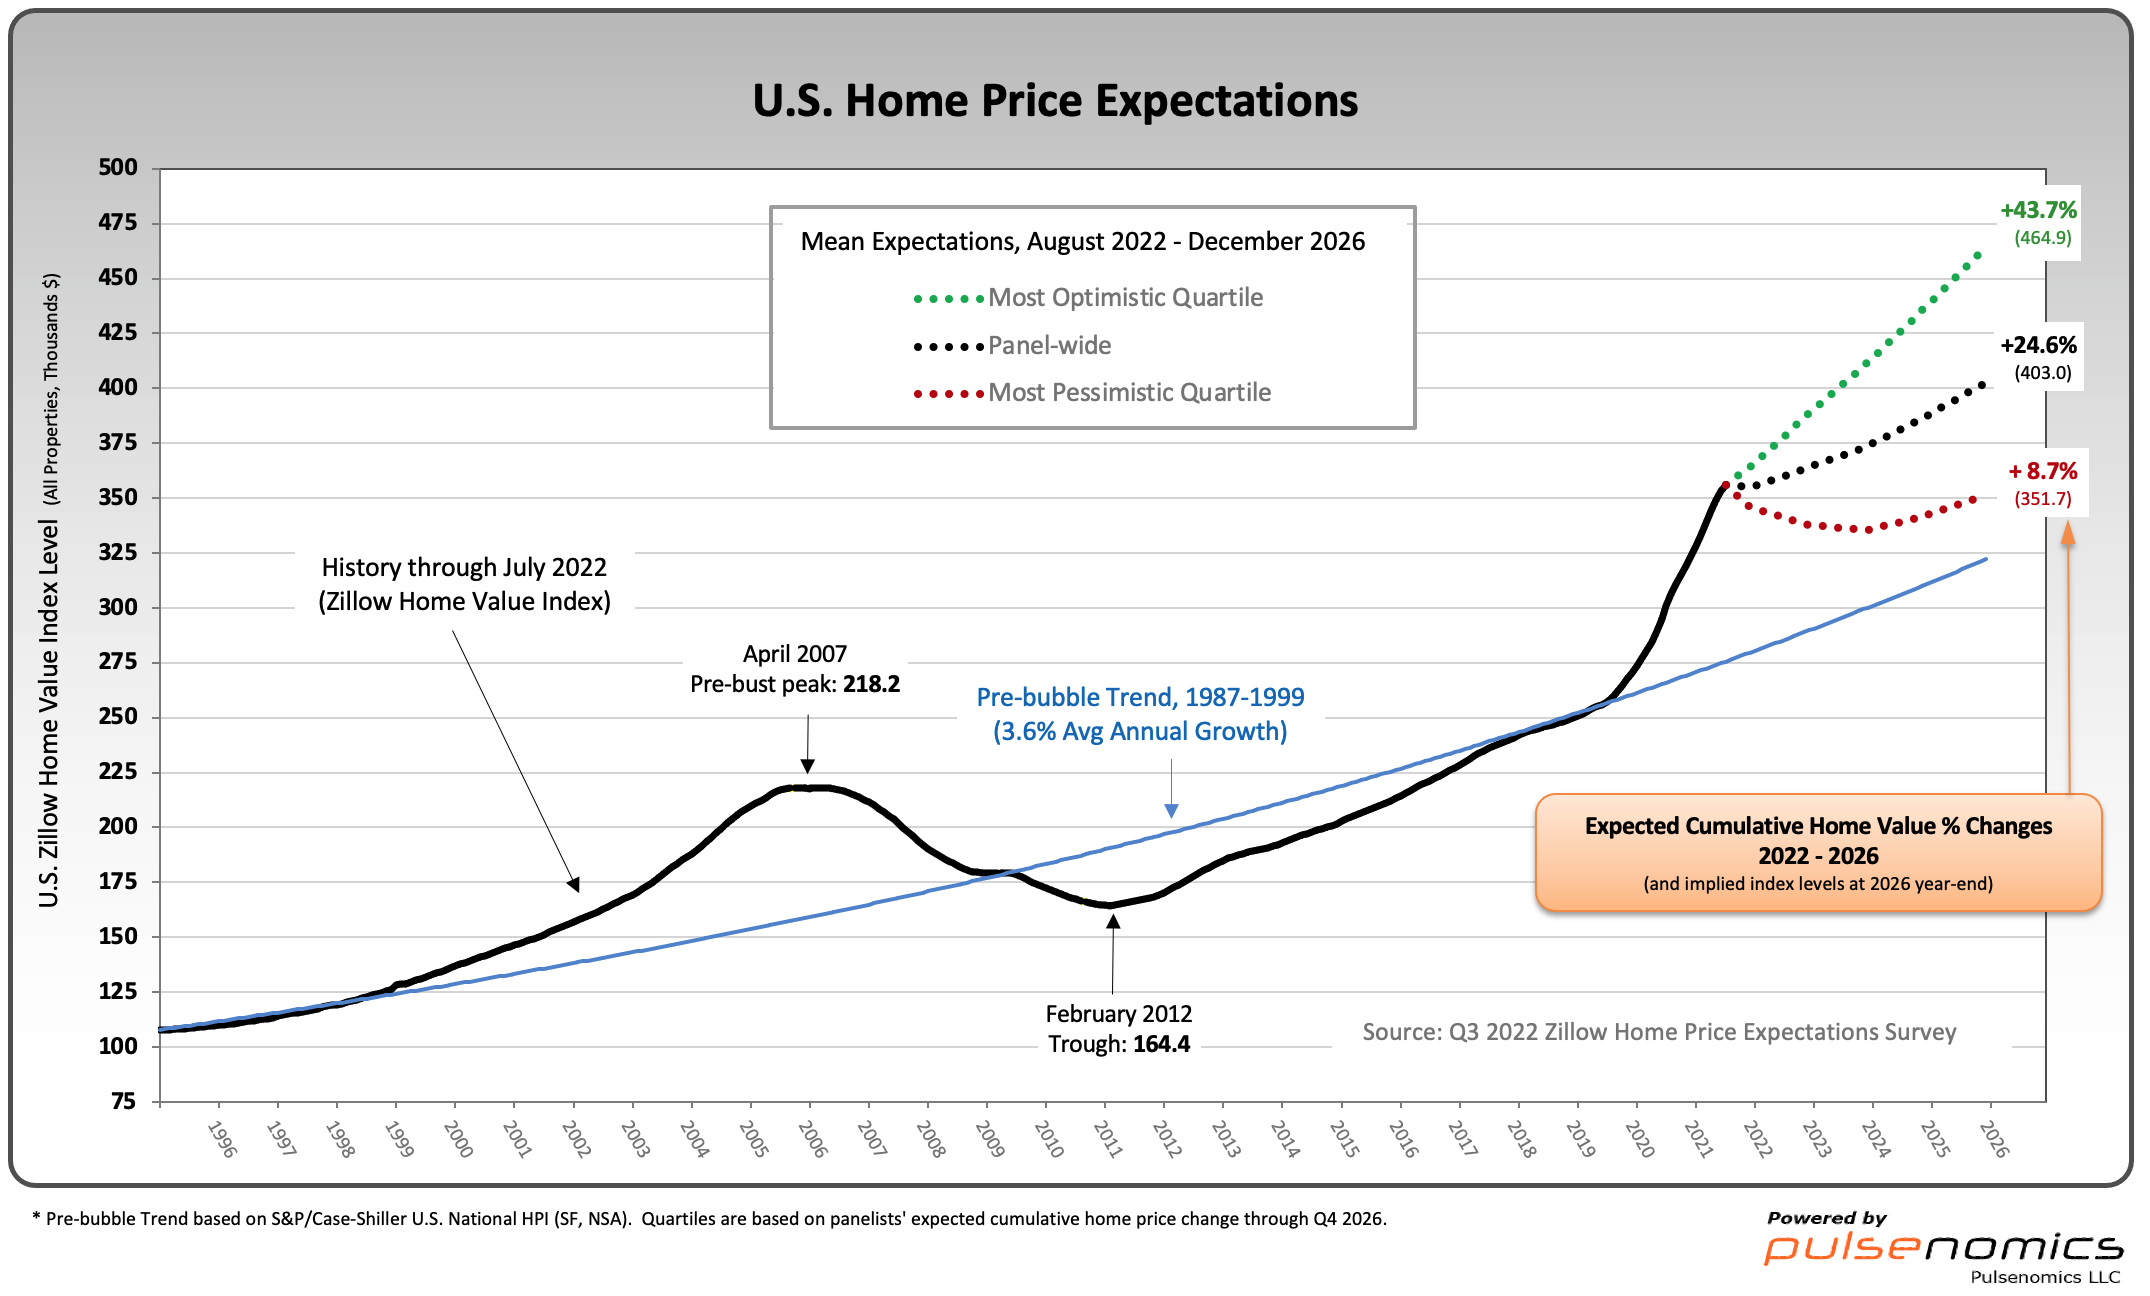
Although the panel-wide 2022 expected home price appreciation rate ticked up to 9.8% from 9.3% in this most recent survey, all 107 survey respondents project home price deceleration in 2023. The share of panelists who believe their long-term outlook might be too optimistic jumped up to 67% from 56% last quarter.
“U.S. home price appreciation is clearly easing up in response to the historic surge in mortgage rates,” said Terry Loebs, founder of Pulsenomics. “Our expert panel’s mean projections indicate that residential rent price growth is expected to outpace headline CPI inflation over the coming three years and exceed home price growth through at least 2025. Despite softening house prices, this implies that affordability hurdles for prospective first-time homeowners will remain high and persist for years to come.”
As one can see from the above chart, the average expectation is that the residential real estate market, as depicted by the U.S. Zillow Home Value Index, will continually climb.
The detail of the Q3 2022 Home Price Expectations Survey is interesting. Of the 107 survey respondents, only five (of the displayed responses) forecasts a cumulative price decrease through 2026.
The Median Cumulative Home Price Appreciation for years 2022-2026 is seen as 9.50%, 13.30%, 16.50%, 19.02%, and 23.37%, respectively.
For a variety of reasons, I continue to believe that these forecasts will prove far too optimistic in hindsight.
I have written extensively about the residential real estate situation. For a variety of reasons, it is exceedingly complex. While many people continue to have an optimistic view regarding future residential real estate prices, in my opinion such a view is unsupported on an “all things considered” basis. Residential real estate is an exceedingly large asset bubble. As such, from these price levels there exists potential for a price decline of outsized magnitude.
_____
The Special Note summarizes my overall thoughts about our economic situation
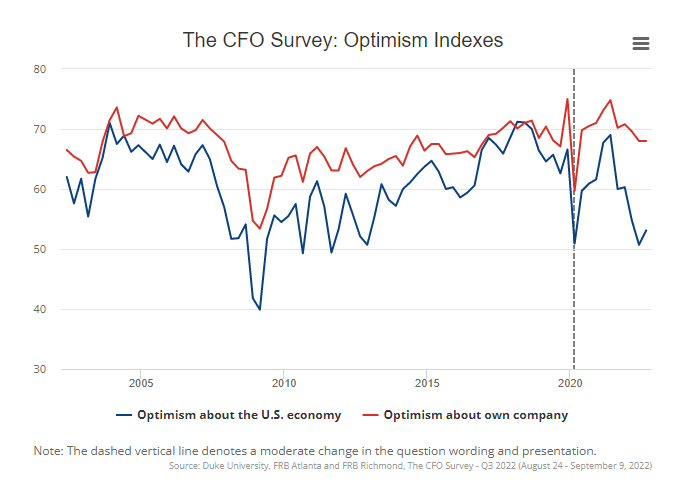
On September 28, 2022 The CFO Survey (formerly called the “Duke/CFO Global Business Outlook”) was released. It contains a variety of statistics regarding how CFOs view business and economic conditions.
In this CFO Survey press release, I found the following to be the most notable excerpts – although I don’t necessarily agree with them:
Financial decision-makers lowered their expectations for real growth in gross domestic product during the third quarter amid concerns over inflation and trouble finding skilled labor, according to the results of The CFO Survey, a collaboration of Duke University’s Fuqua School of Business and the Federal Reserve Banks of Richmond and Atlanta.
At the same time, CFOs said their optimism about the overall economy rose modestly from its recent low. Optimism about their own firms, though well below levels from a year ago, remained steady alongside some improvement in expectations for revenue, employment and cost growth.
CFOs said inflation was the most pressing concern facing their firms. Firms revised unit cost growth during 2022 down to 8.9 percent from 10.2 percent in the prior survey. These costs remain at elevated levels, and nearly all firms reported experiencing larger-than-normal cost increases.
As seen in the report’s detail:
CFOs on average expect real GDP to grow 0.9 percent over the next 12 months, down from an expectation of 1.5 percent last quarter. Across CFOs, the average probability of negative GDP growth over the next 12 months was 30 percent, compared to a 21 percent probability last quarter.
This CFO Survey contains an Optimism Index chart, with the blue line showing U.S. Optimism (with regard to the economy) at 53.1, as seen below:
—
It should be interesting to see how well the CFOs predict business and economic conditions going forward. I discussed past various aspects of this, and the importance of these predictions, in the July 9, 2010 post titled “The Business Environment”.
(past posts on CEO and CFO surveys can be found under the “CFO and CEO Confidence” label)
_____
I post various economic forecasts because I believe they should be carefully monitored. However, as those familiar with this site are aware, I do not necessarily agree with many of the consensus estimates and much of the commentary in these forecast surveys.
_____
The Special Note summarizes my overall thoughts about our economic situation
For reference purposes, below are two sets of charts depicting growth in the money supply.
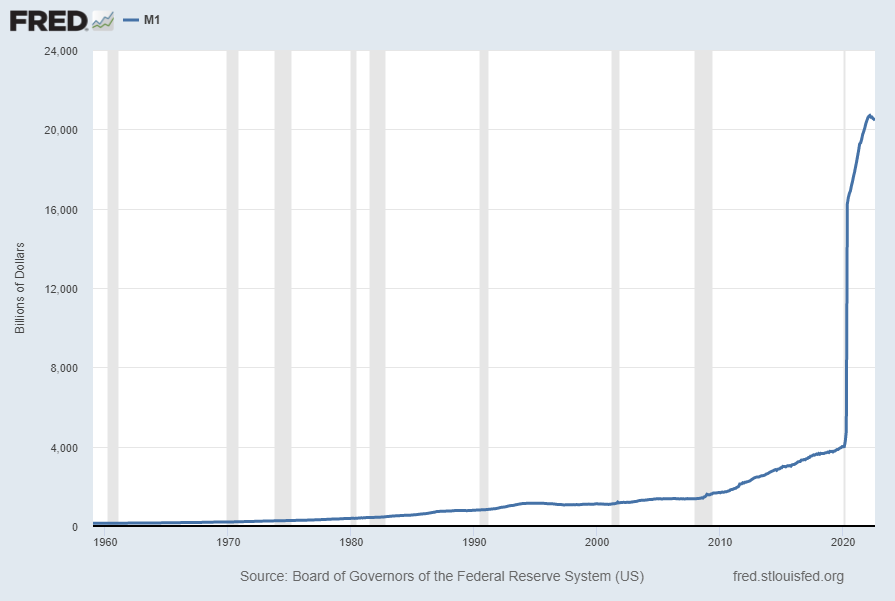
The first shows the M1, defined in FRED as the following:
Before May 2020, M1 consists of (1) currency outside the U.S. Treasury, Federal Reserve Banks, and the vaults of depository institutions; (2) demand deposits at commercial banks (excluding those amounts held by depository institutions, the U.S. government, and foreign banks and official institutions) less cash items in the process of collection and Federal Reserve float; and (3) other checkable deposits (OCDs), consisting of negotiable order of withdrawal, or NOW, and automatic transfer service, or ATS, accounts at depository institutions, share draft accounts at credit unions, and demand deposits at thrift institutions.
Beginning May 2020, M1 consists of (1) currency outside the U.S. Treasury, Federal Reserve Banks, and the vaults of depository institutions; (2) demand deposits at commercial banks (excluding those amounts held by depository institutions, the U.S. government, and foreign banks and official institutions) less cash items in the process of collection and Federal Reserve float; and (3) other liquid deposits, consisting of OCDs and savings deposits (including money market deposit accounts). Seasonally adjusted M1 is constructed by summing currency, demand deposits, and OCDs (before May 2020) or other liquid deposits (beginning May 2020), each seasonally adjusted separately.
Here is the “M1 Money Stock” (seasonally adjusted) chart, updated on September 27, 2022 depicting data through August 2022, with a value of $20,452.9 Billion:
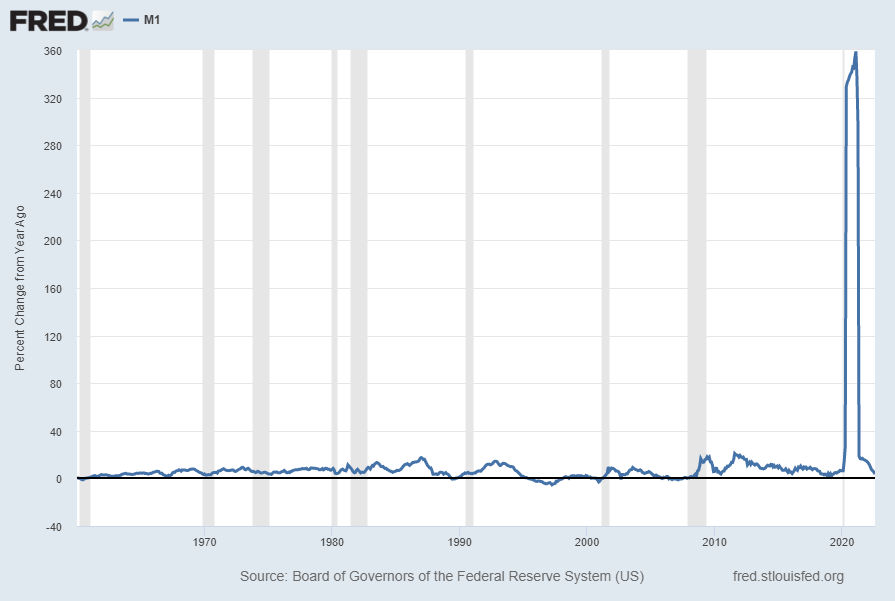
Here is the “M1 Money Stock” chart on a “Percent Change From Year Ago” basis, with a current value of 3.6%:
Data Source: Board of Governors of the Federal Reserve System (US), M1 Money Stock [M1SL], retrieved from FRED, Federal Reserve Bank of St. Louis; accessed September 27, 2022: https://fred.stlouisfed.org/series/M1SL
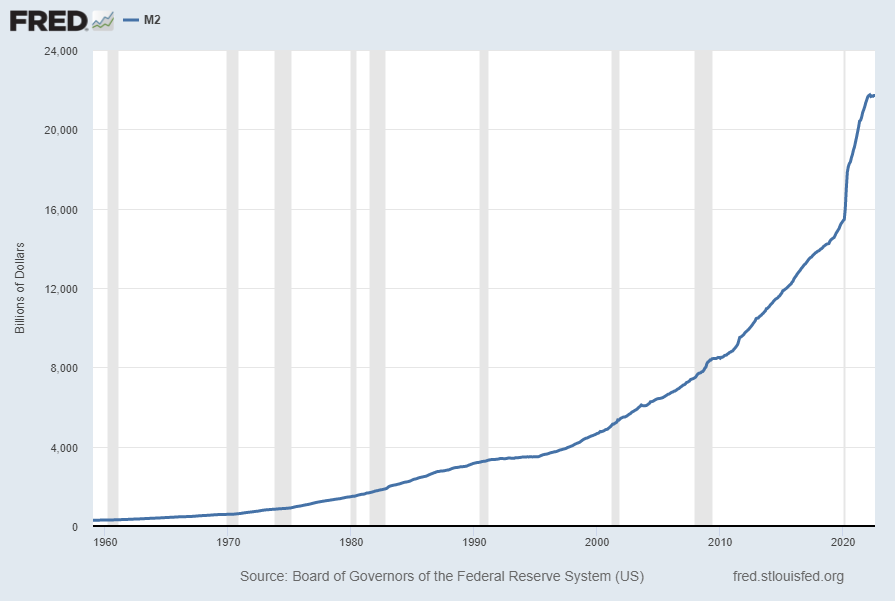
The second set shows M2, defined in FRED as the following:
Before May 2020, M2 consists of M1 plus (1) savings deposits (including money market deposit accounts); (2) small-denomination time deposits (time deposits in amounts of less than $100,000) less individual retirement account (IRA) and Keogh balances at depository institutions; and (3) balances in retail money market funds (MMFs) less IRA and Keogh balances at MMFs.
Beginning May 2020, M2 consists of M1 plus (1) small-denomination time deposits (time deposits in amounts of less than $100,000) less IRA and Keogh balances at depository institutions; and (2) balances in retail MMFs less IRA and Keogh balances at MMFs. Seasonally adjusted M2 is constructed by summing savings deposits (before May 2020), small-denomination time deposits, and retail MMFs, each seasonally adjusted separately, and adding this result to seasonally adjusted M1.
Here is the “M2 Money Stock” (seasonally adjusted) chart, updated on September 27, 2022, depicting data through August 2022, with a value of $21,711.4 Billion:
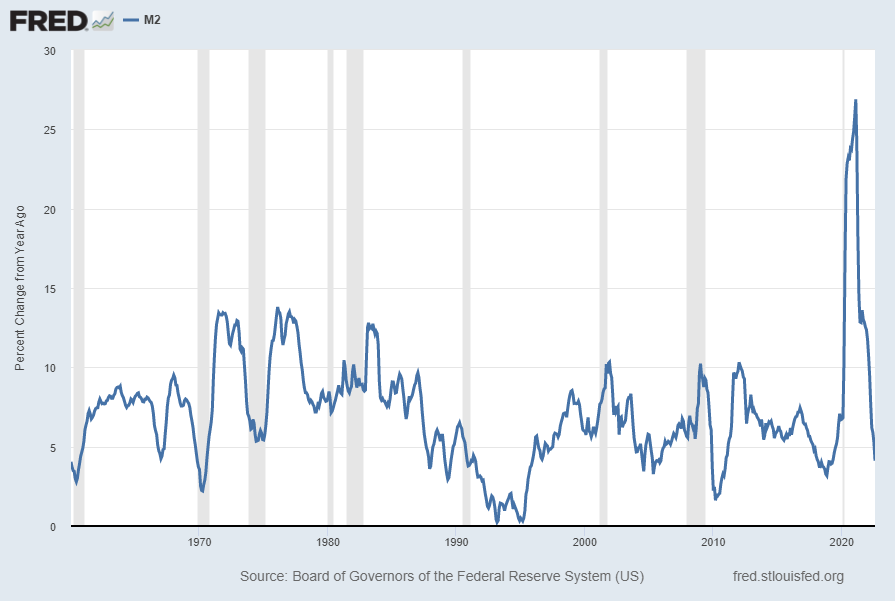
Here is the “M2 Money Stock” chart on a “Percent Change From Year Ago” basis, with a current value of 4.1%:
Data Source: Board of Governors of the Federal Reserve System (US), M2 Money Stock [M2SL], retrieved from FRED, Federal Reserve Bank of St. Louis; accessed September 27, 2022: https://fred.stlouisfed.org/series/M2SL
_____
The Special Note summarizes my overall thoughts about our economic situation
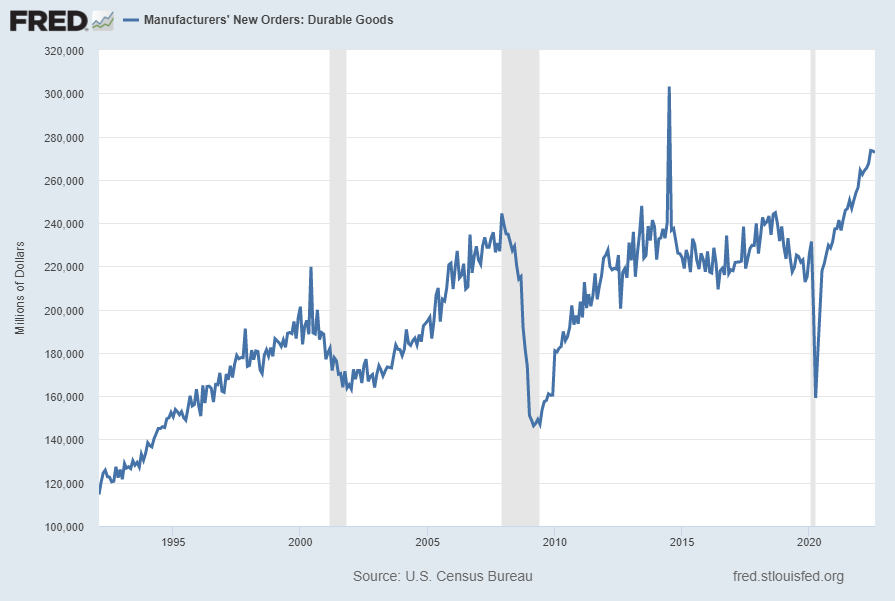
Many people place emphasis on Durable Goods New Orders as a prominent economic indicator and/or leading economic indicator.
For reference, below are two charts depicting this measure.
First, from the St. Louis Fed site (FRED), a chart through August 2022, updated on September 27, 2022. This value is $272,659 ($ Millions):
(click on charts to enlarge images)
–
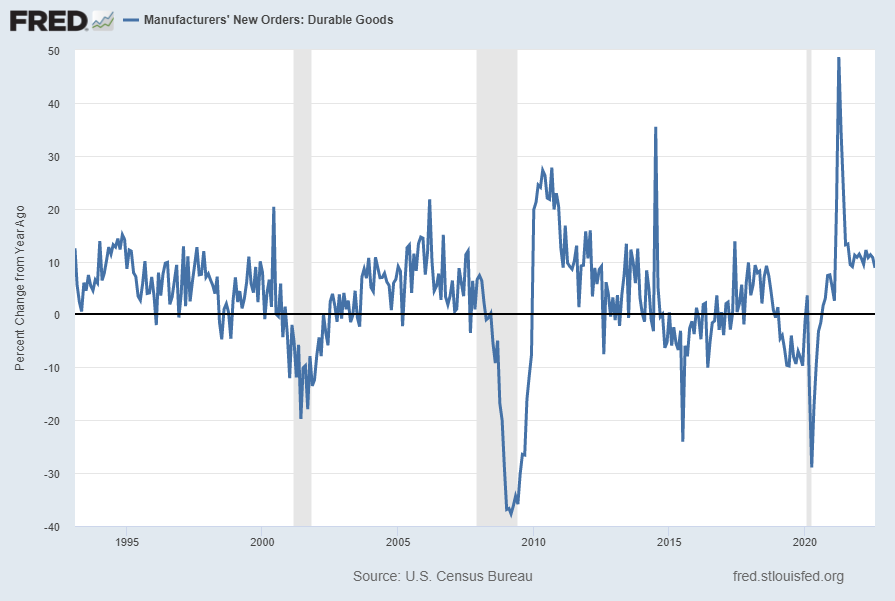
Second, here is the chart depicting this measure on a “Percent Change from a Year Ago” basis, with a last value of 8.8%:
Data Source: FRED, Federal Reserve Economic Data, Federal Reserve Bank of St. Louis: Manufacturers’ New Orders: Durable Goods [DGORDER]; U.S. Department of Commerce: Census Bureau; accessed September 27, 2022; http://research.stlouisfed.org/fred2/series/DGORDER
_________
I post various indicators and indices because I believe they should be carefully monitored. However, as those familiar with this site are aware, I do not necessarily agree with what they depict or imply.
_____
The Special Note summarizes my overall thoughts about our economic situation
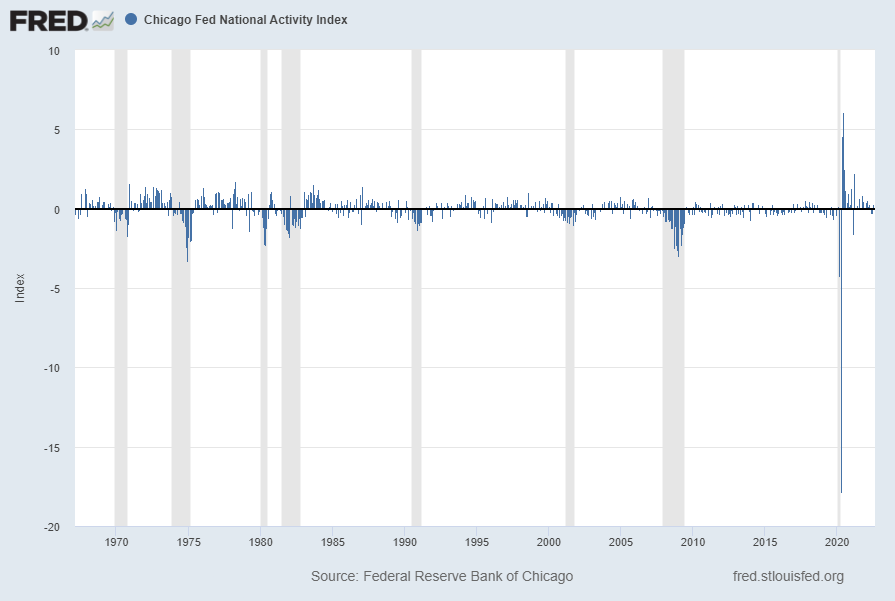
The following is an update of various indicators that are supposed to predict and/or depict economic activity. These indicators have been discussed in previous blog posts:
source: Federal Reserve Bank of Chicago, Chicago Fed National Activity Index [CFNAI], retrieved from FRED, Federal Reserve Bank of St. Louis; accessed September 26, 2022: https://fred.stlouisfed.org/series/CFNAI
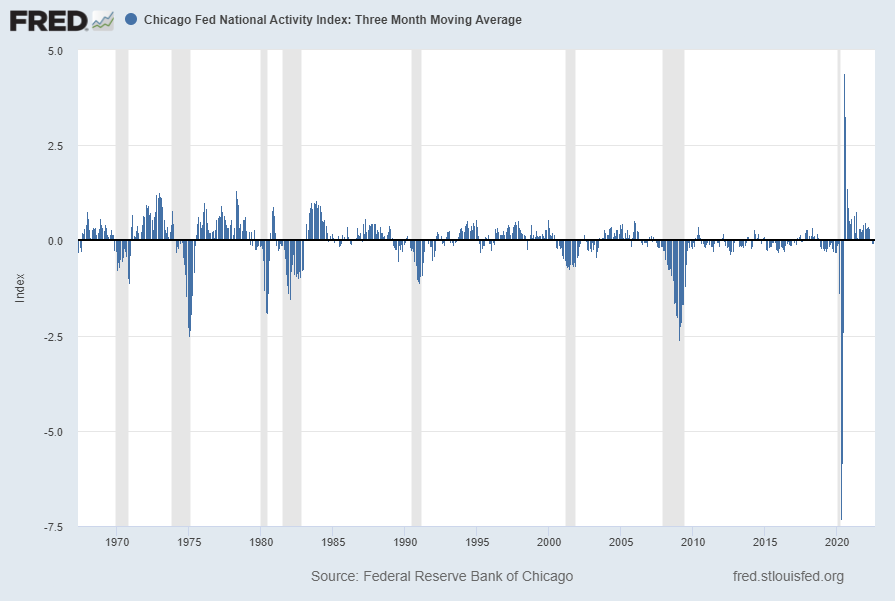
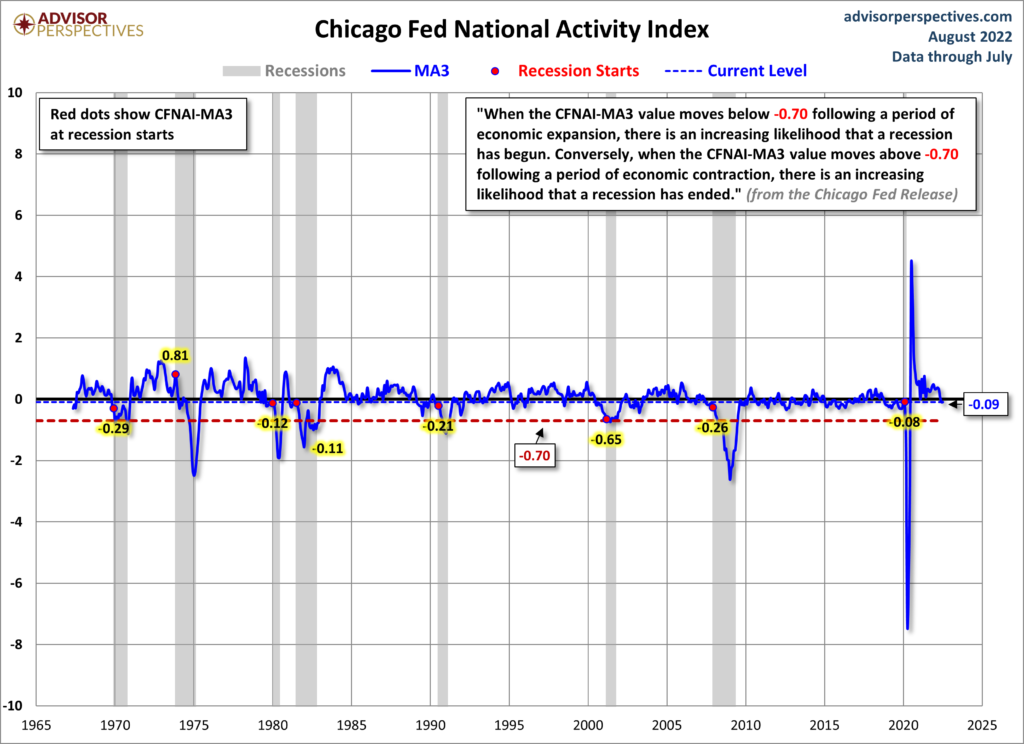
The CFNAI-MA3, with a current reading of .01:
source: Federal Reserve Bank of Chicago, Chicago Fed National Activity Index: Three Month Moving Average [CFNAIMA3], retrieved from FRED, Federal Reserve Bank of St. Louis; accessed September 26, 2022: https://fred.stlouisfed.org/series/CFNAIMA3
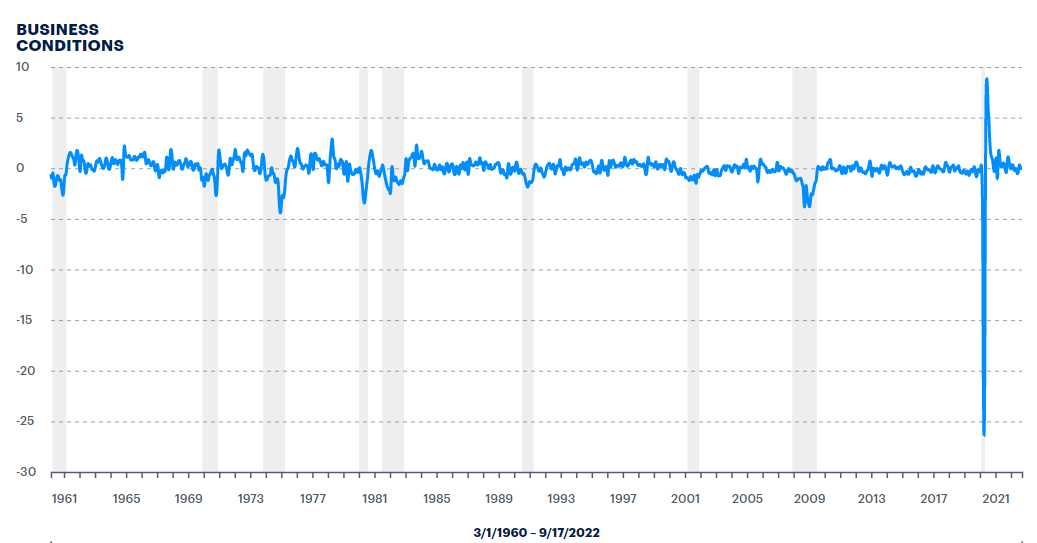
The ADS Index as of September 22, 2022, reflecting data from March 1, 1960 through September 17, 2022, with last value .0145106:
–
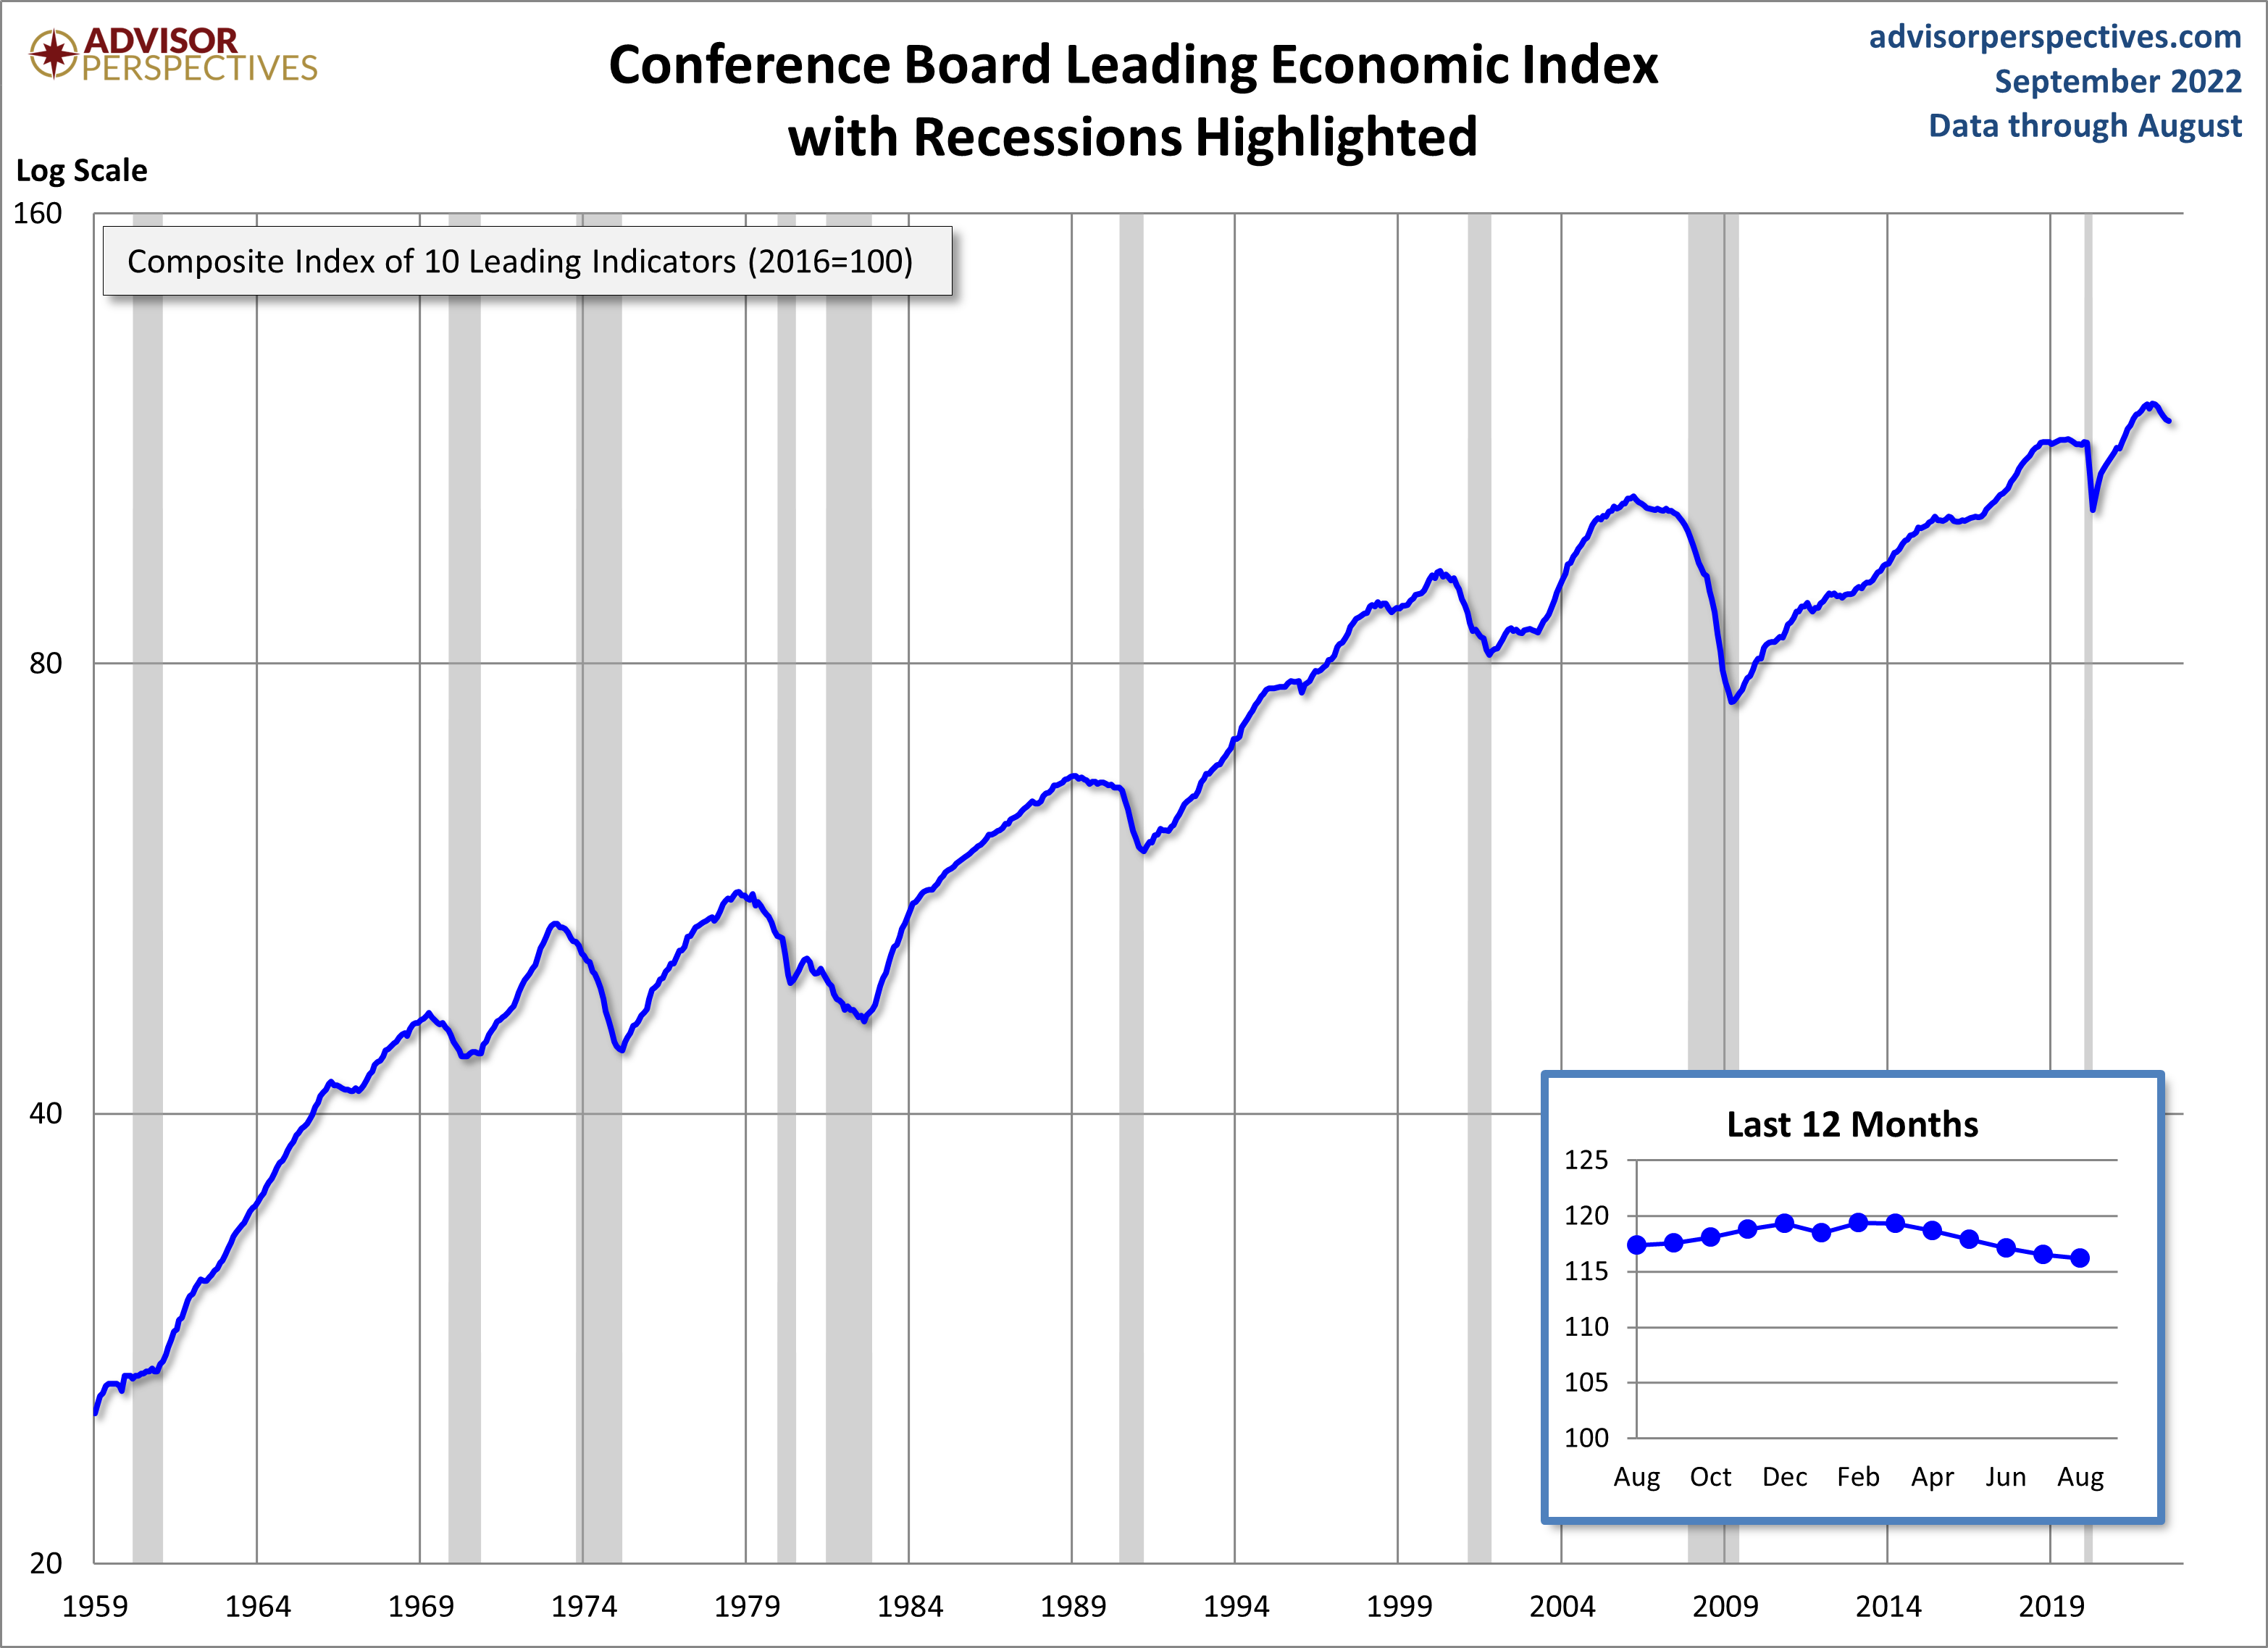
The Conference Board Leading Economic Index (LEI), Coincident Economic Index (CEI), and Lagging Economic Index (LAG):
As per the September 22, 2022 Conference Board press release the LEI was 116.2 in August, the CEI was 108.7 in August, and the LAG was 115.4 in August.
An excerpt from the release:
“The US LEI declined for a sixth consecutive month potentially signaling a recession,” Ataman Ozyildirim, Senior Director, Economics, at The Conference Board. “Among the index’s components, only initial unemployment claims and the yield spread contributed positively over the last six months—and the contribution of the yield spread has narrowed recently.”
“Furthermore, labor market strength is expected to continue moderating in the months ahead. Indeed, the average workweek in manufacturing contracted in four of the last six months—a notable sign, as firms reduce hours before reducing their workforce. Economic activity will continue slowing more broadly throughout the US economy and is likely to contract. A major driver of this slowdown has been the Federal Reserve’s rapid tightening of monetary policy to counter inflationary pressures. The Conference Board projects a recession in the coming quarters.”
I post various indicators and indices because I believe they should be carefully monitored. However, as those familiar with this site are aware, I do not necessarily agree with what they depict or imply.
_____
The Special Note summarizes my overall thoughts about our economic situation
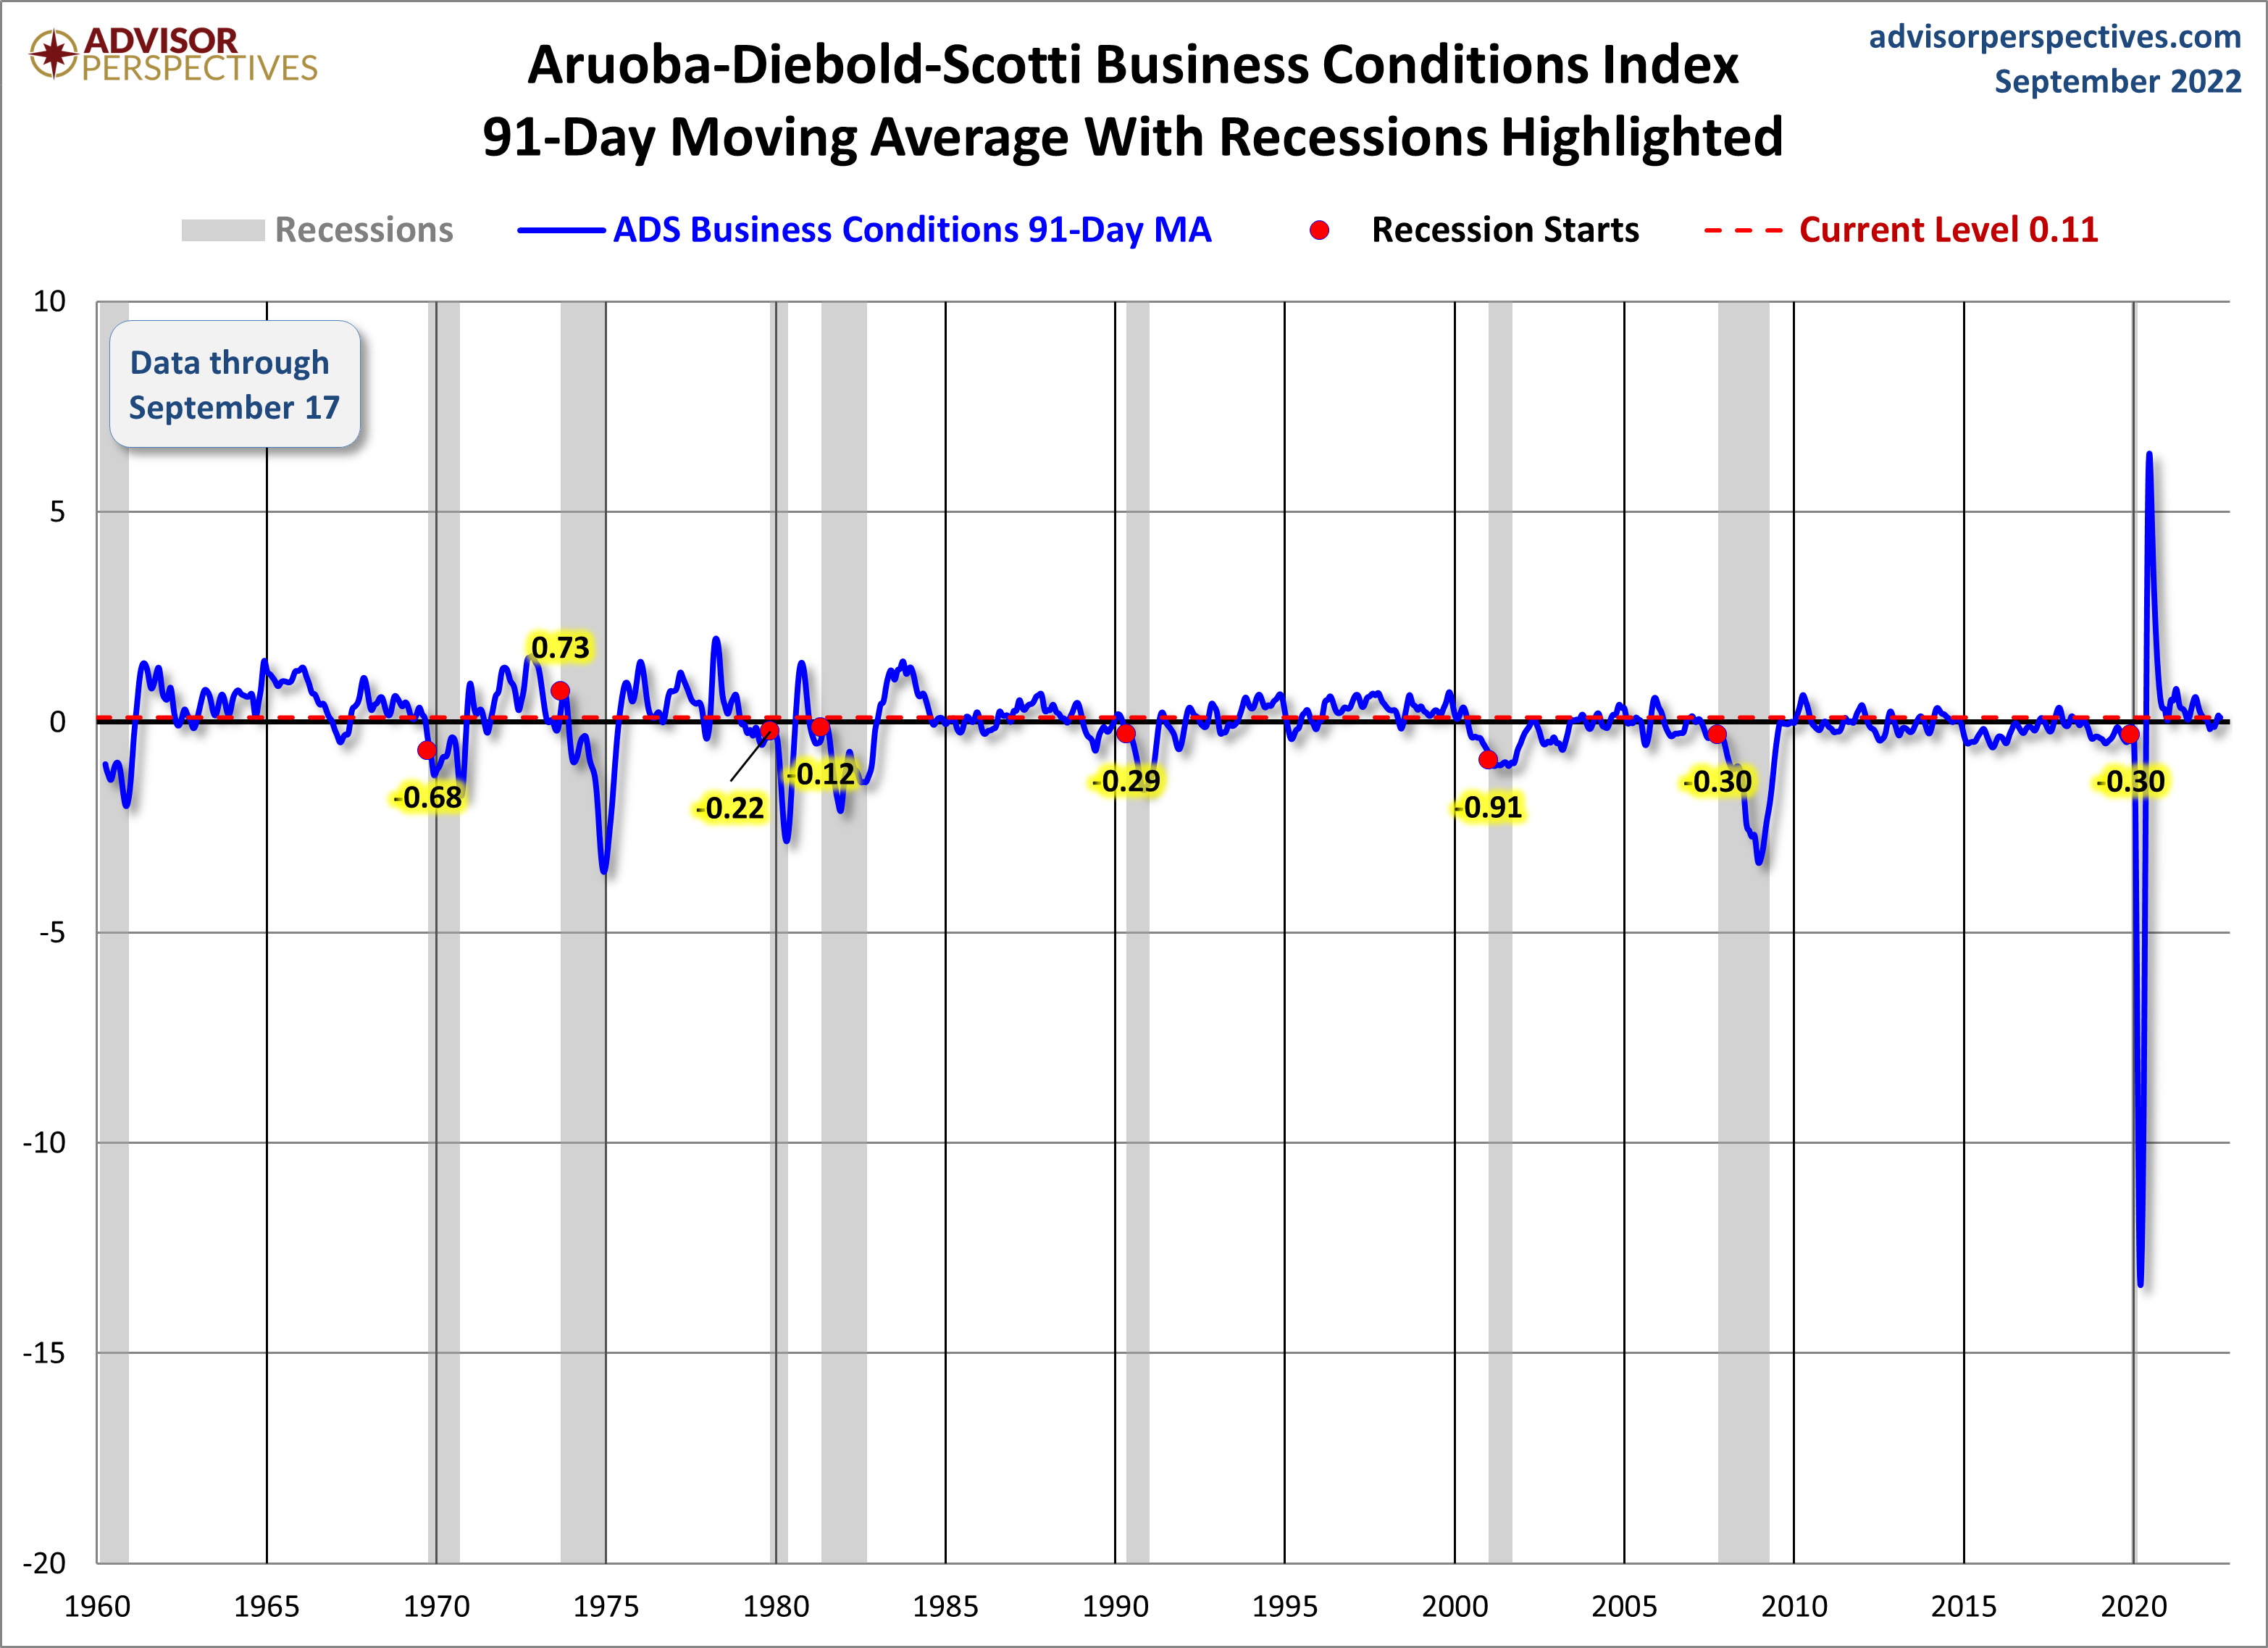
The Chicago Fed National Activity Index (CFNAI) and the Aruoba-Diebold-Scotti Business Conditions Index (ADS Index) are two broad-based economic indicators that I regularly feature in this site.
The short-term and long-term trends of each continue to be notable.
The Advisor Perspectives’ post of September 23, 2022, titled “The Philly Fed ADS Index Business Conditions Index Update” displays both the CFNAI MA-3 (CFNAI on a 3-month Moving Average) and ADS Index (91-Day Moving Average) from a variety of perspectives.
Of particular note, two of the charts, shown below, denote where the current levels of each reading is relative to the beginning of recessionary periods, as depicted by the red dots.
The CFNAI MA-3:
(click on charts to enlarge images)
–
The ADS Index, 91-Day MA:
–
Also shown in the aforementioned post is a chart of each with a long-term trendline (linear regression) as well as a chart depicting GDP for comparison purposes.
_________
I post various indicators and indices because I believe they should be carefully monitored. However, as those familiar with this site are aware, I do not necessarily agree with what they depict or imply.
_____
The Special Note summarizes my overall thoughts about our economic situation
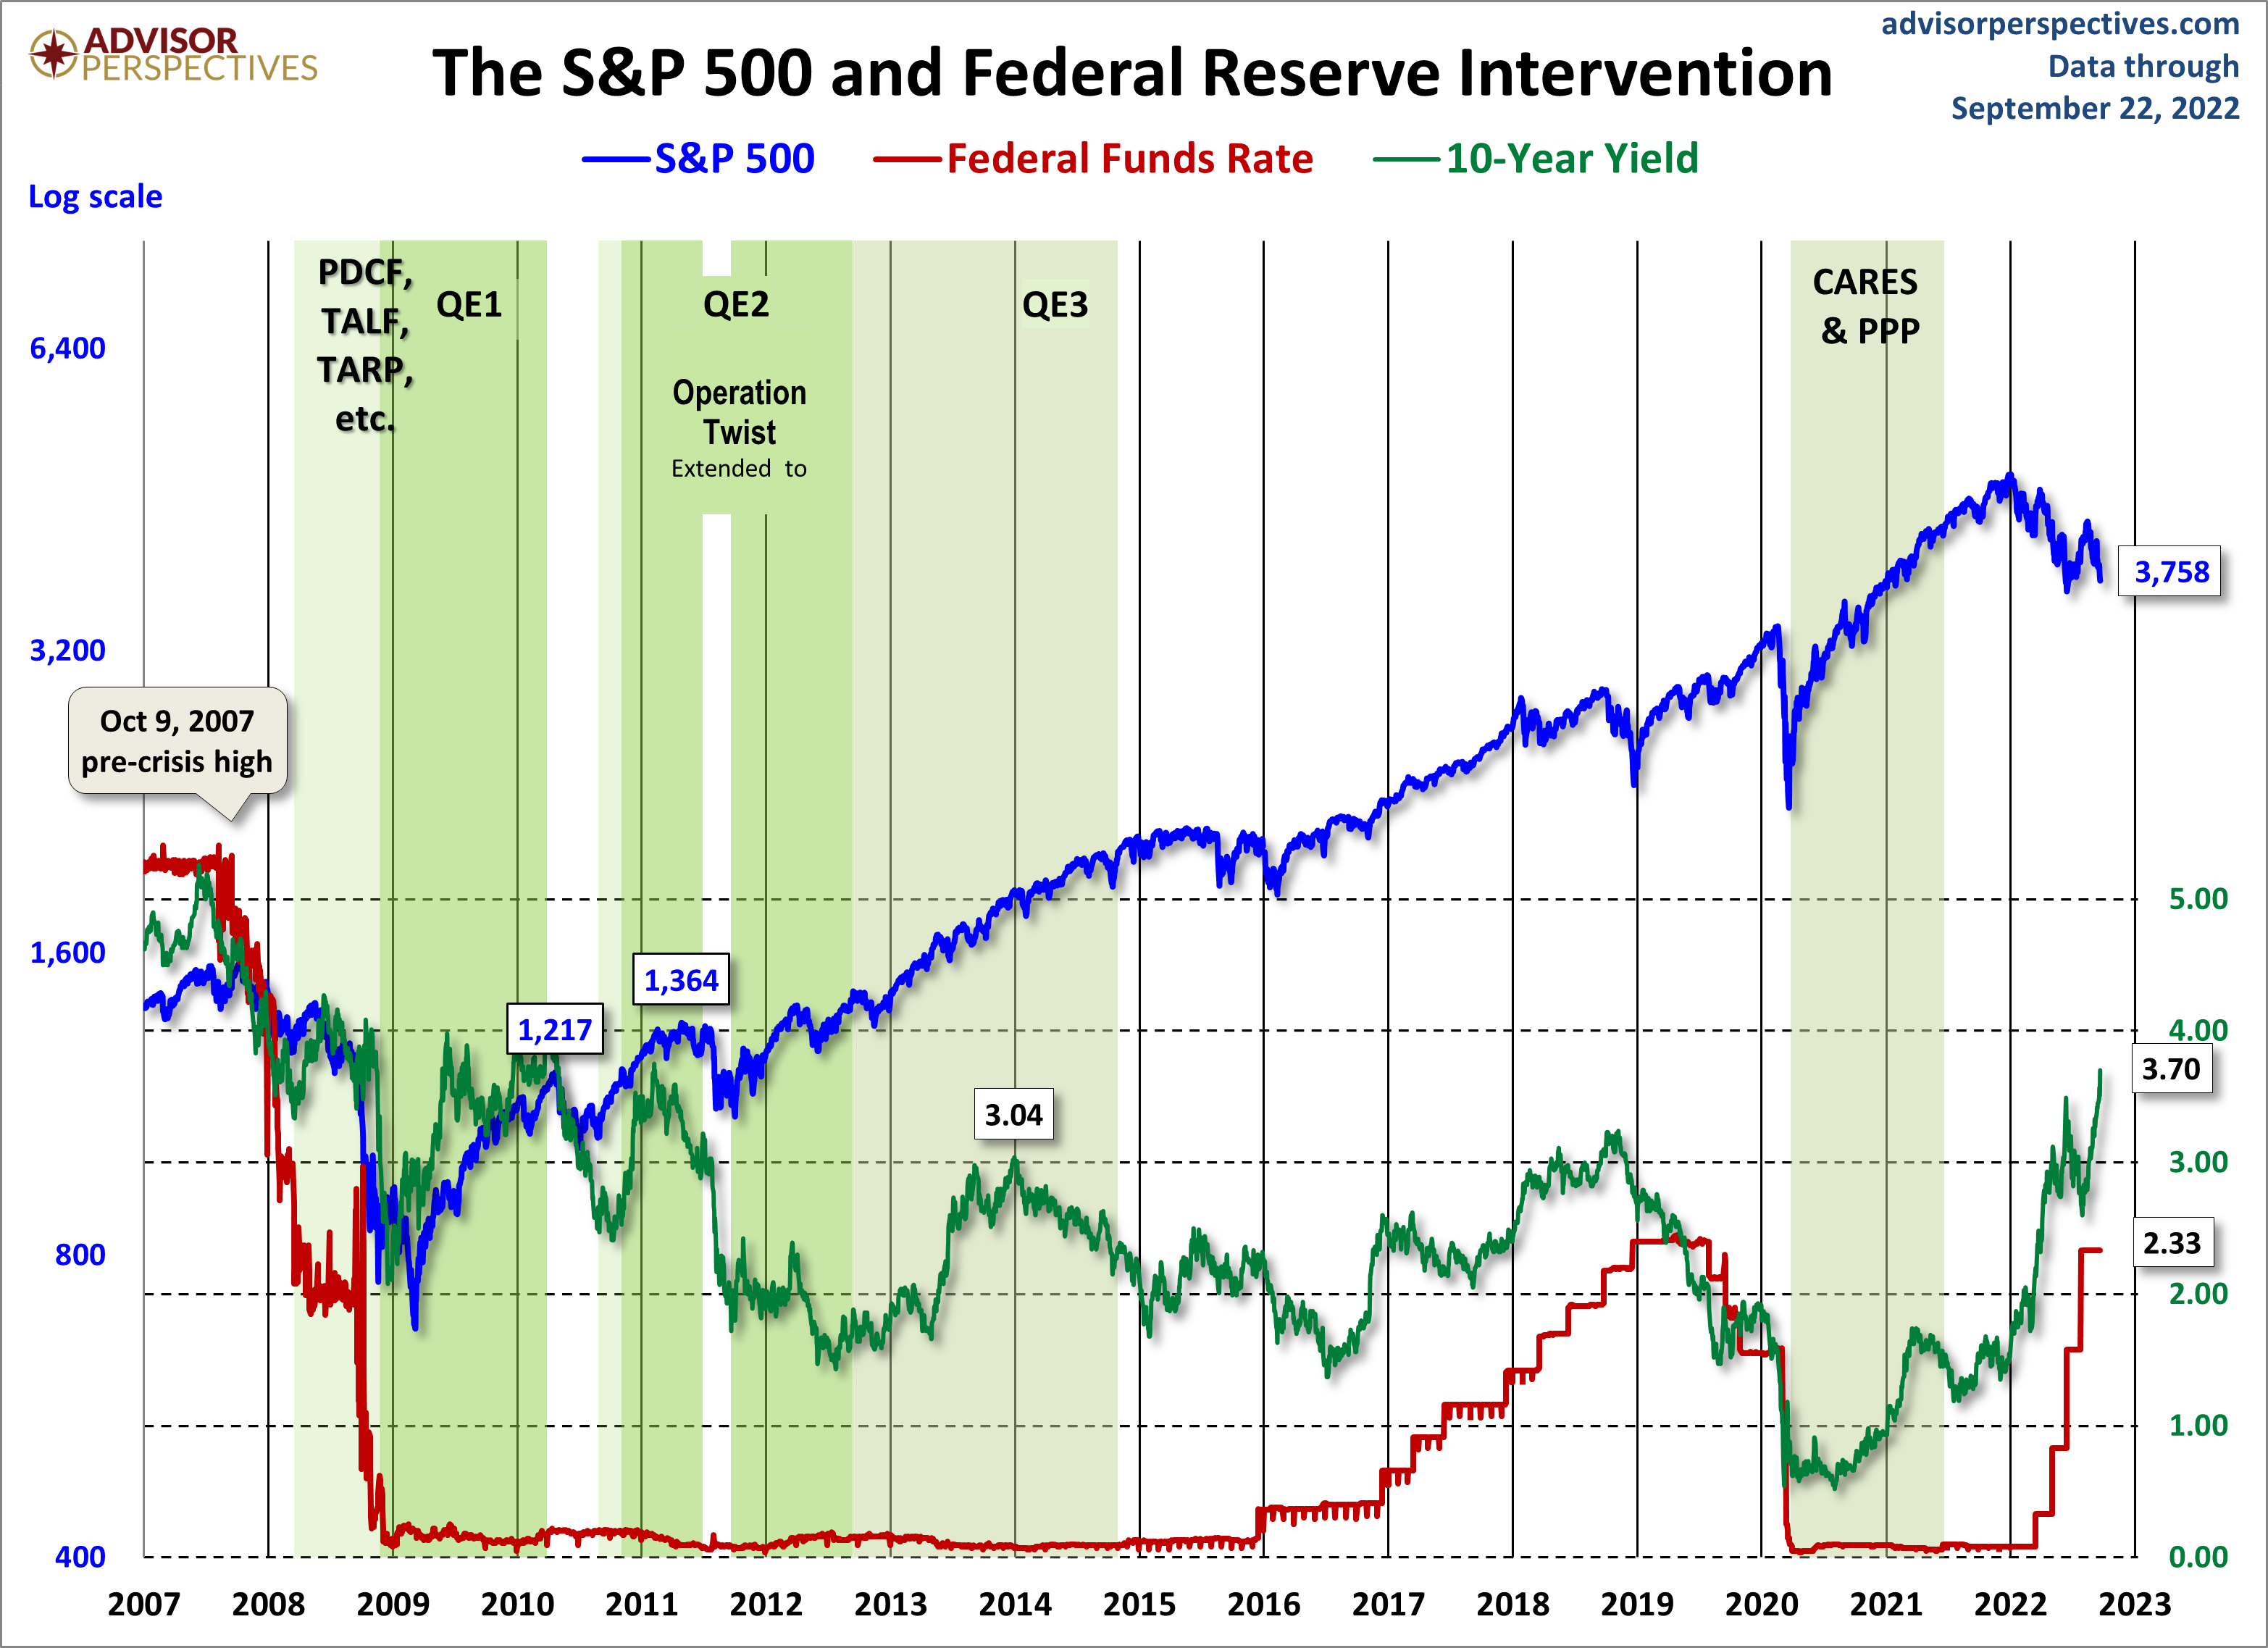
In the August 9, 2011 post (“QE3 – Various Thoughts“) I posted a chart that depicted the movements of the S&P500, 10-Year Treasury Yield and the Fed Funds rate spanning the periods of various Federal Reserve interventions since 2007.
For reference purposes, here is an updated chart (September 22, 2022) from the Advisor Perspectives’ site post of September 22, 2022 (“Treasury Snapshot…):
_____
The Special Note summarizes my overall thoughts about our economic situation
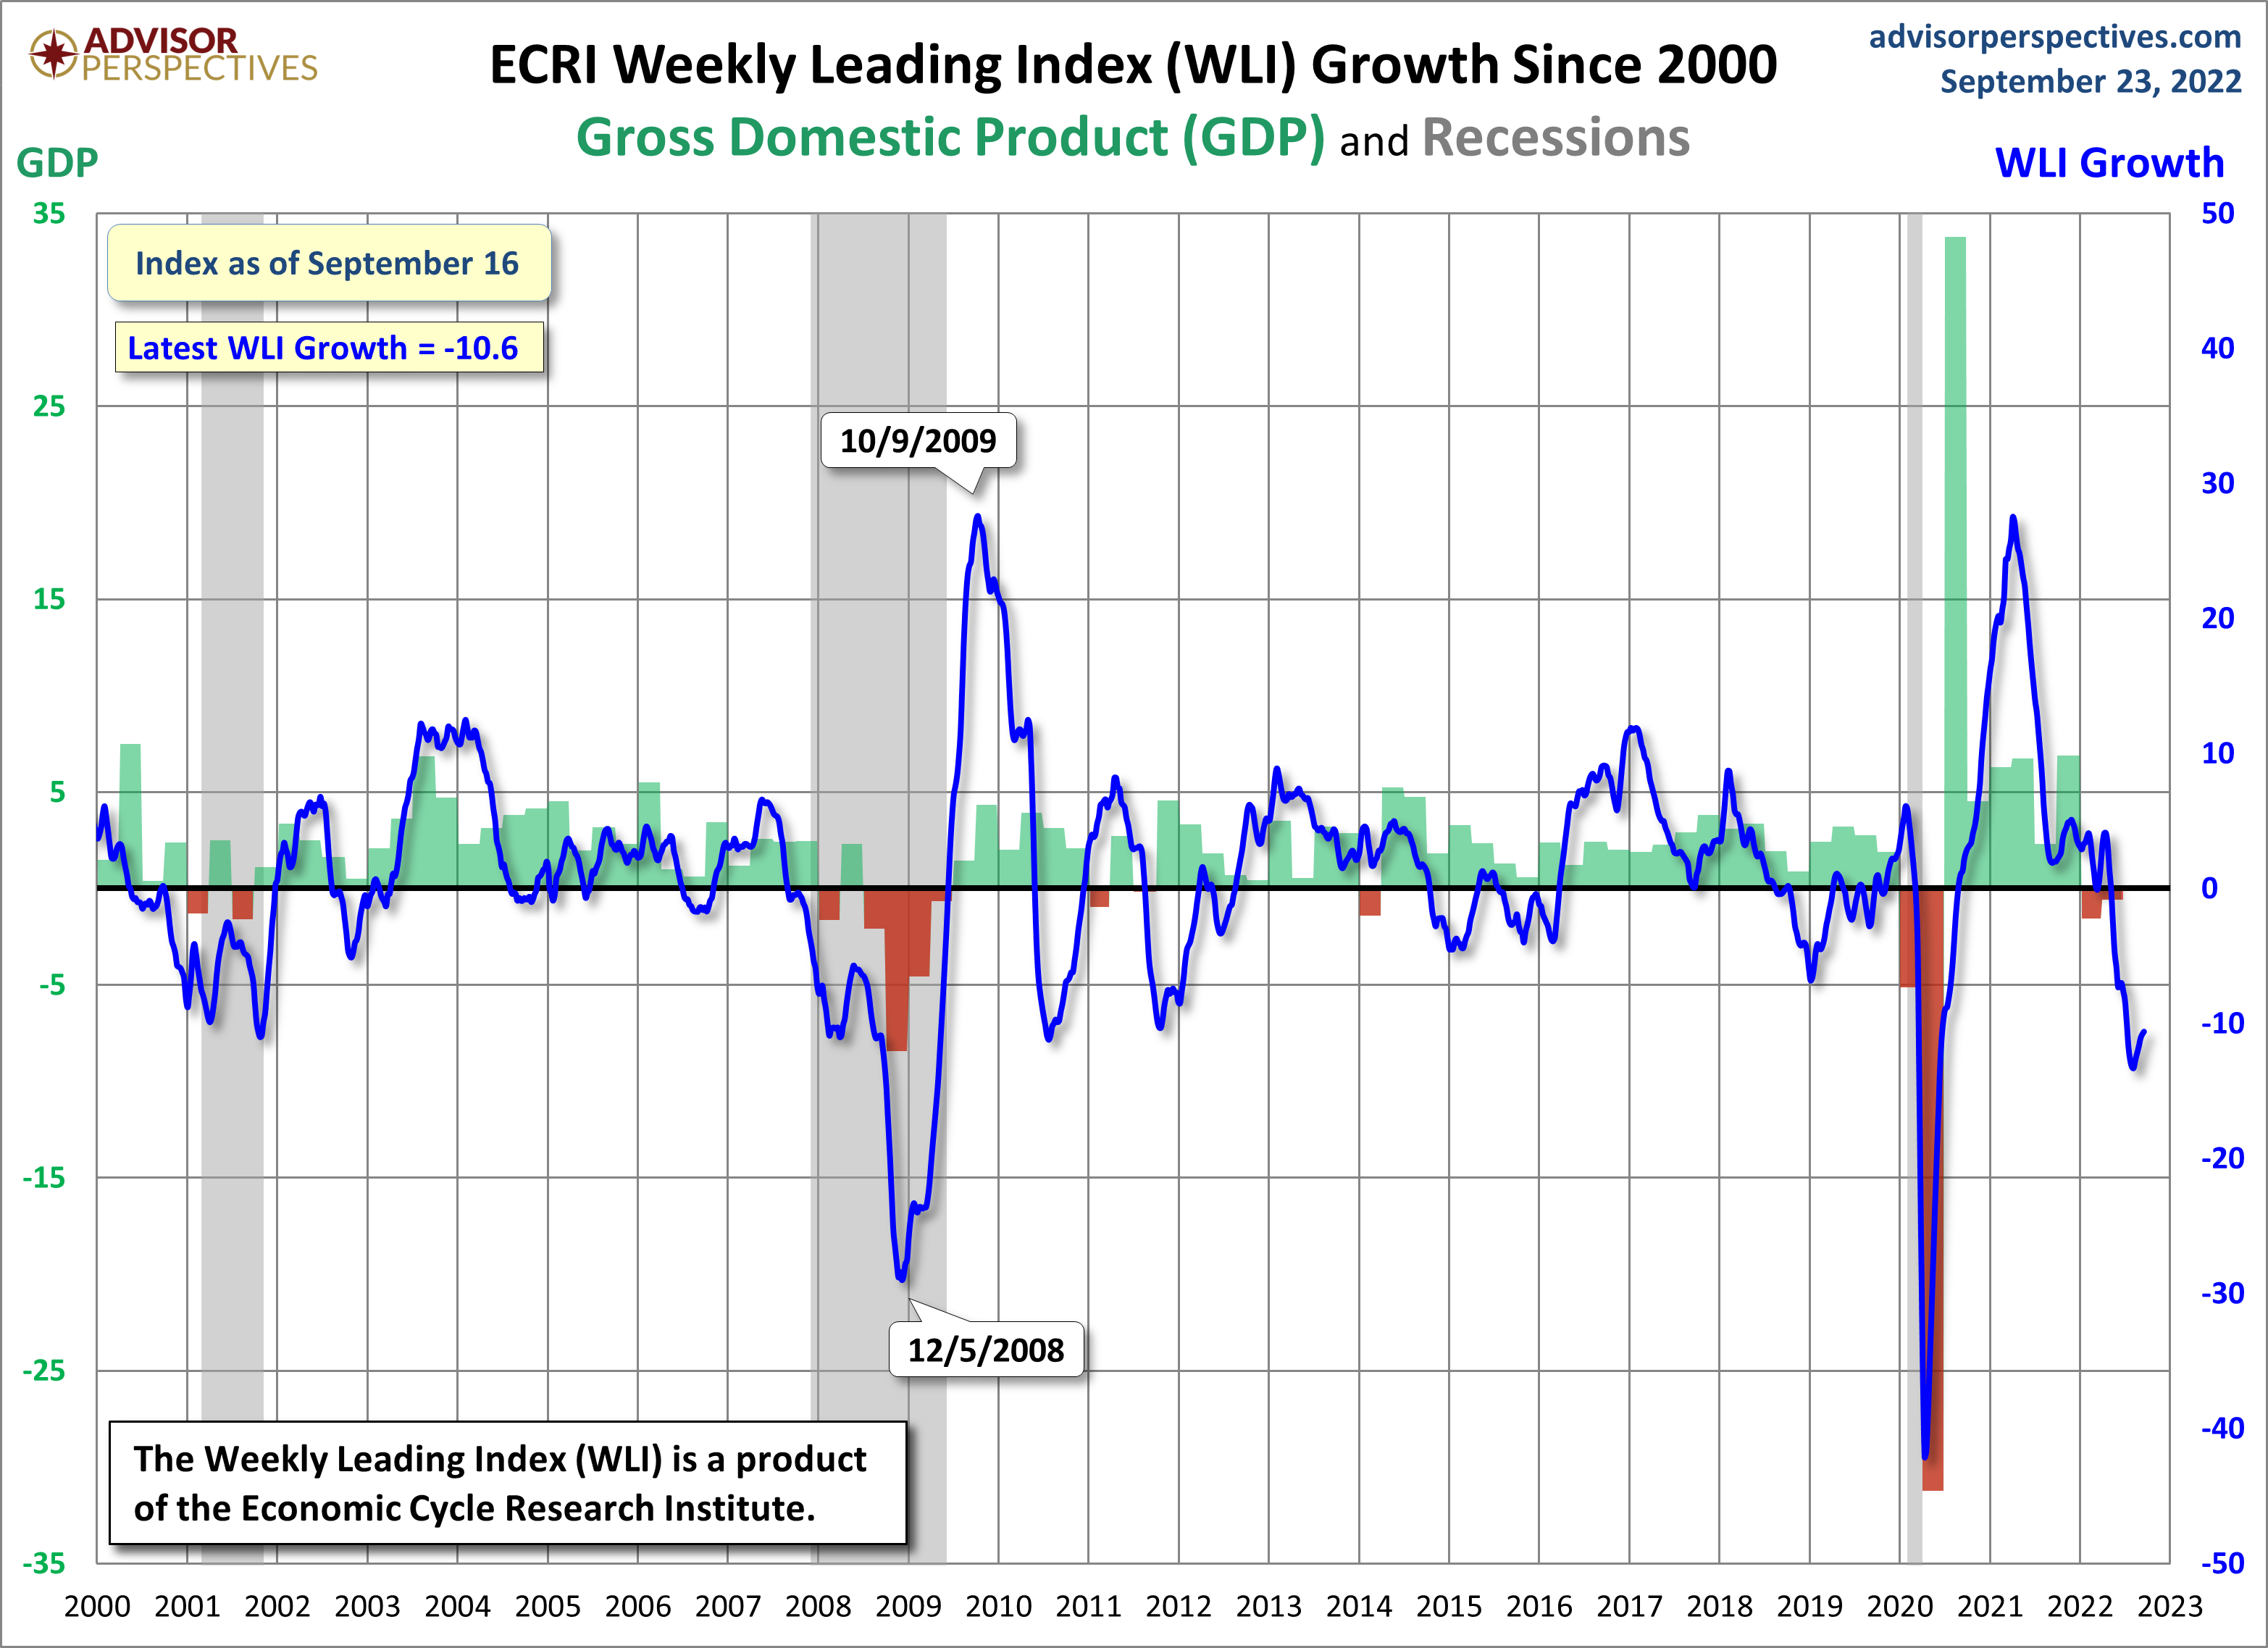
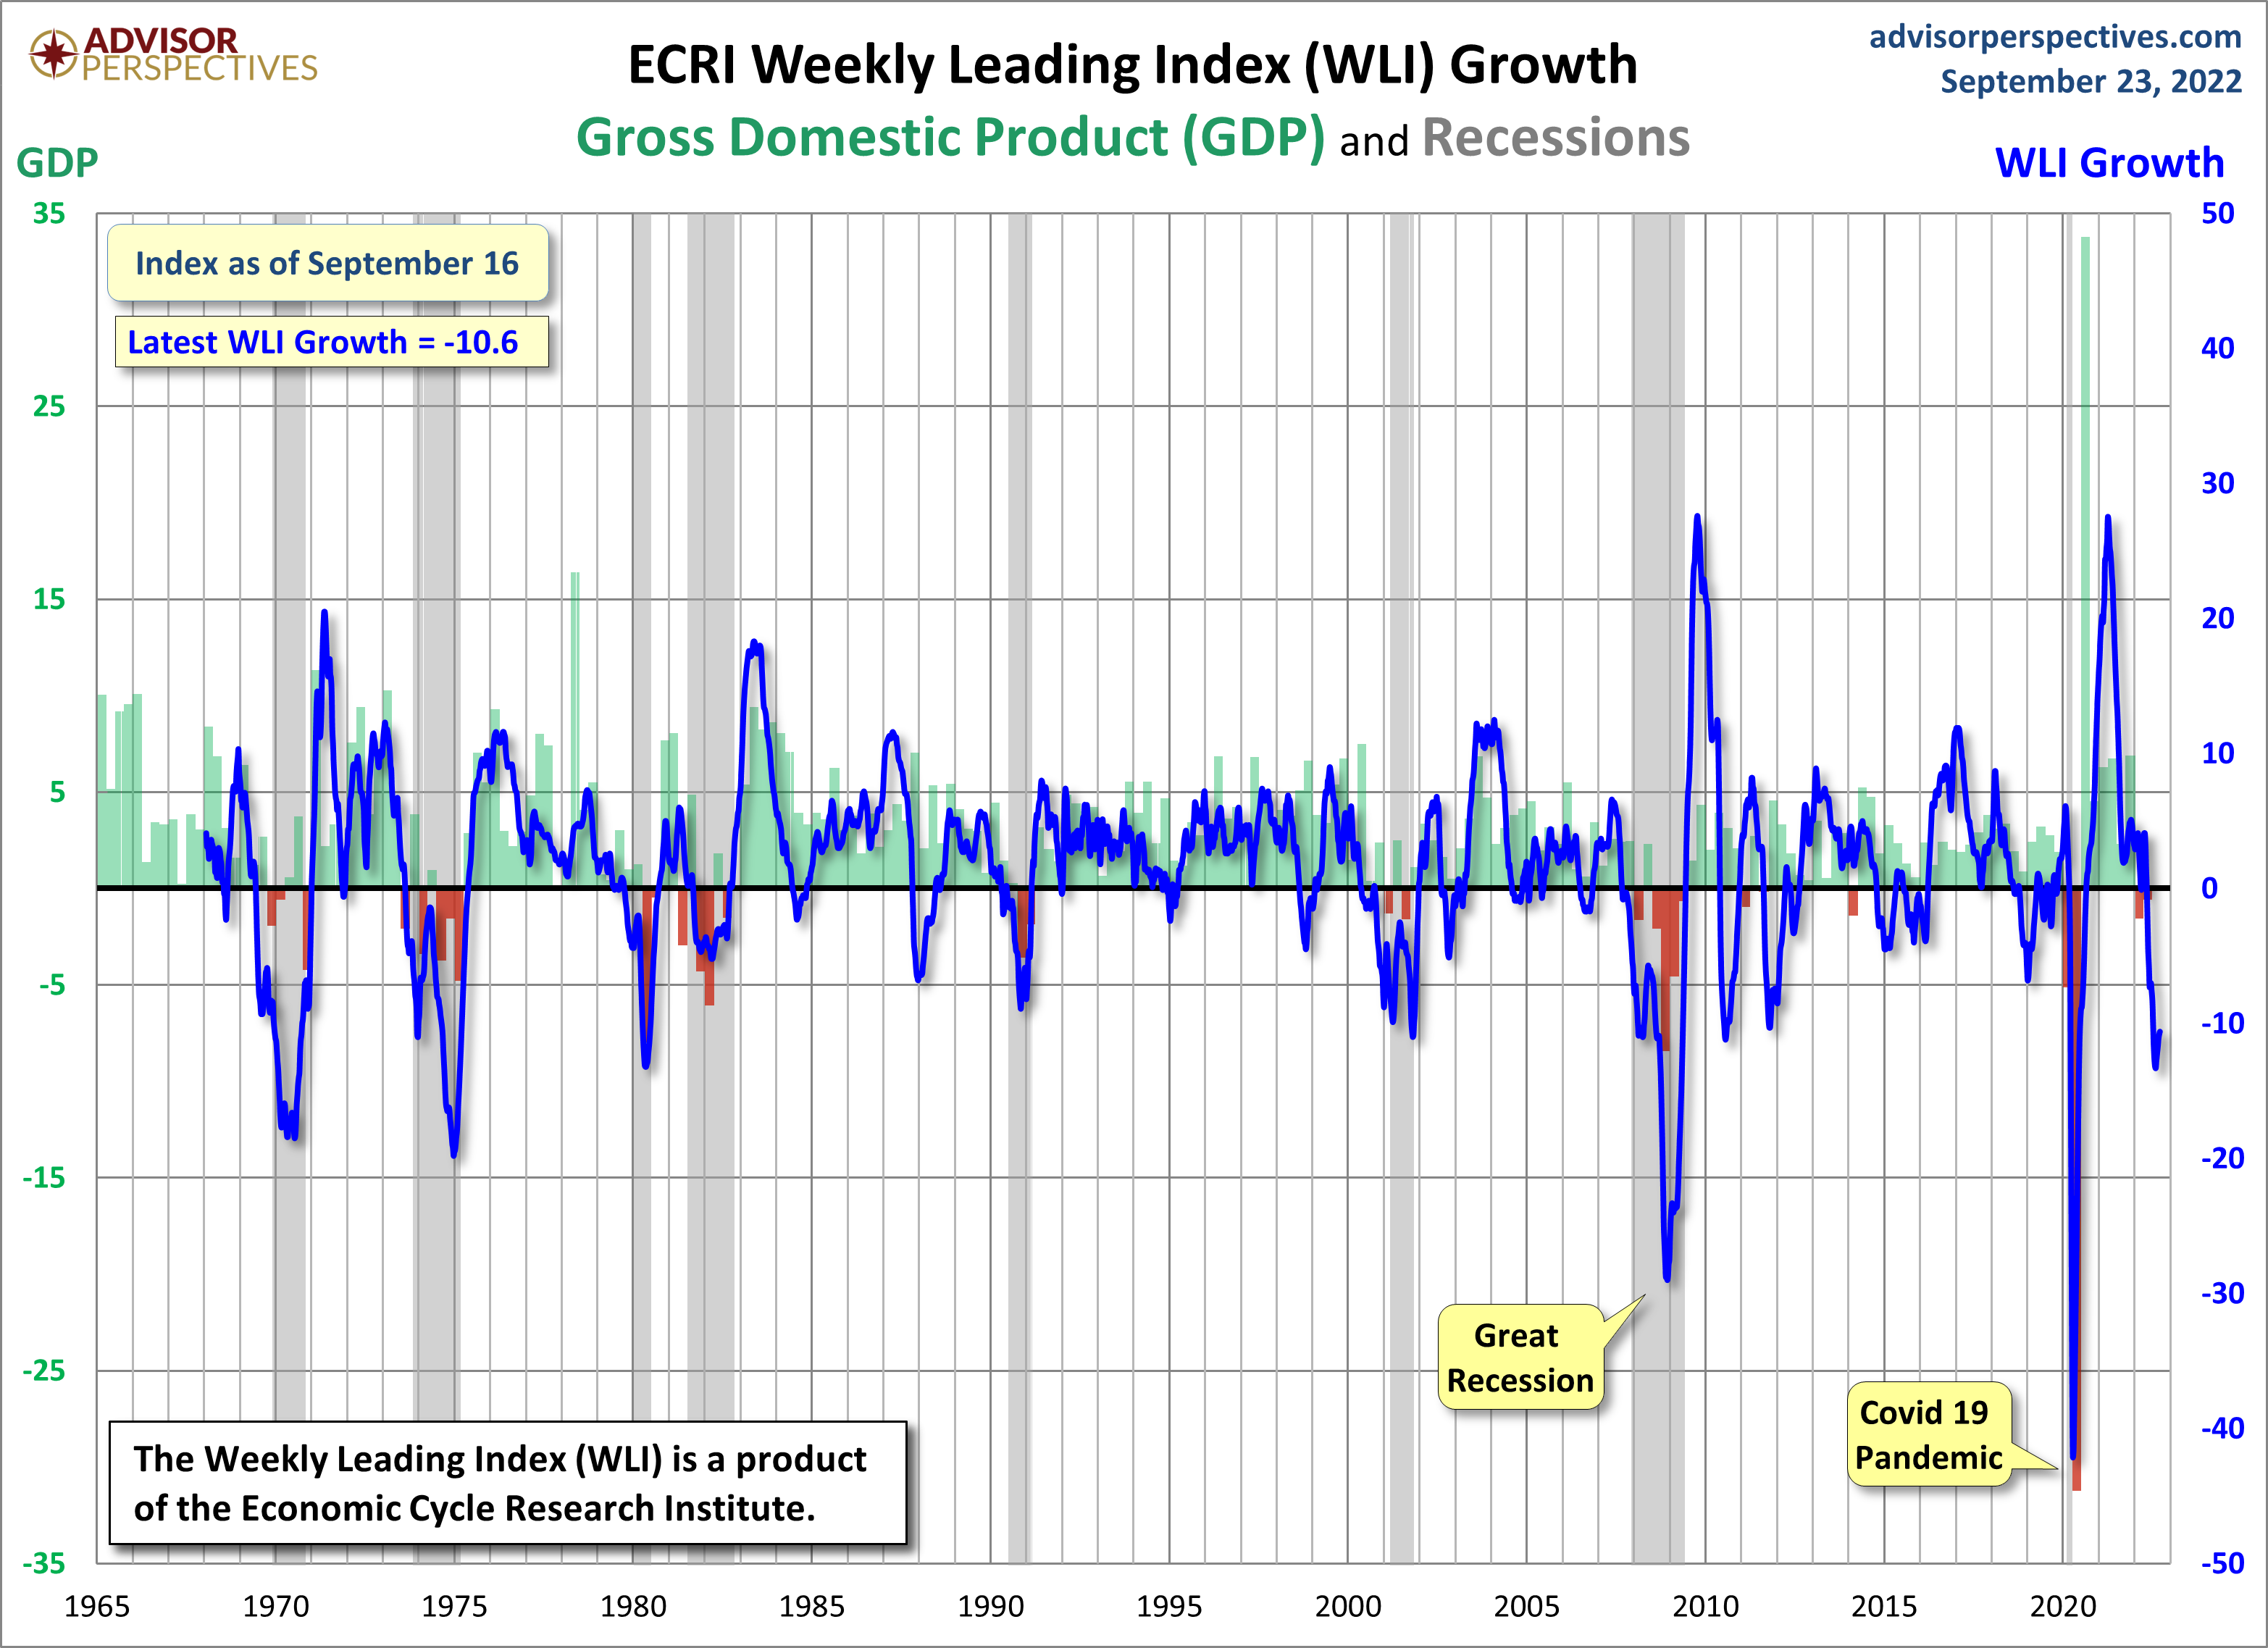
For a variety of reasons, I am not as enamored with ECRI’s WLI and WLI Growth measures as many are.
However, I do think the measures are important and deserve close monitoring and scrutiny.
Below are three long-term charts, from Advisor Perspectives’ ECRI update post of September 23, 2022 titled “ECRI Weekly Leading Index Update.” These charts are on a weekly basis as of the September 23, 2022 release, reflecting data through September 16, 2022.
This next chart depicts, on a long-term basis, the Year-over-Year change in the 4-week moving average of the WLI:
–
This last chart depicts, on a long-term basis, the WLI, Gr.:
_________
I post various economic indicators and indices because I believe they should be carefully monitored. However, as those familiar with this site are aware, I do not necessarily agree with what they depict or imply.
_____
The Special Note summarizes my overall thoughts about our economic situation