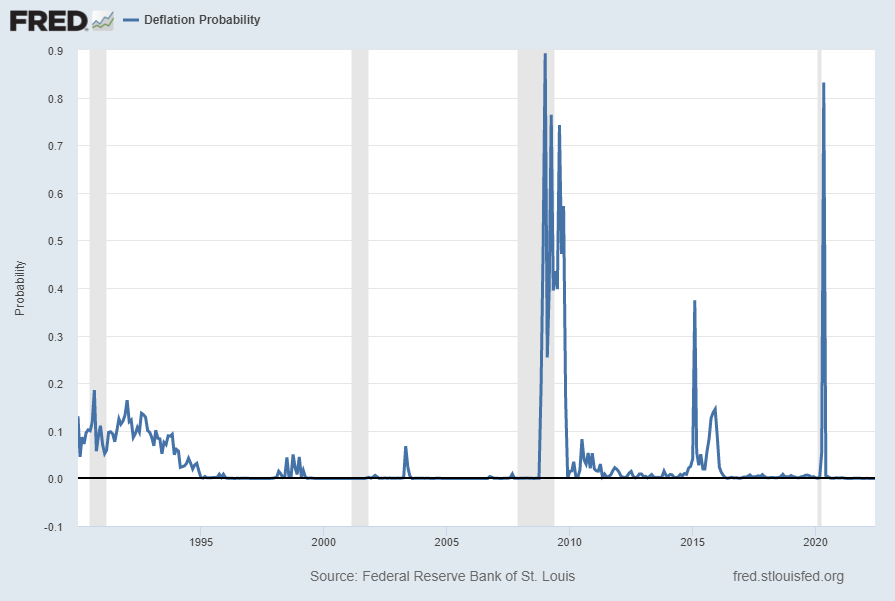
For reference, below is a chart of the St. Louis Fed Price Pressures Measures – Deflation Probability [FRED STLPPMDEF] through June 2022.
While I do not necessarily agree with the current readings of the measure, I view this as a proxy of U.S. deflation probability.
A description of this measure, as seen in FRED:
This series measures the probability that the personal consumption expenditures price index (PCEPI) inflation rate (12-month changes) over the next 12 months will fall below zero.
The chart, on a monthly basis from January 1990 – June 2022, with a last reading of .00001, last updated on June 30, 2022:
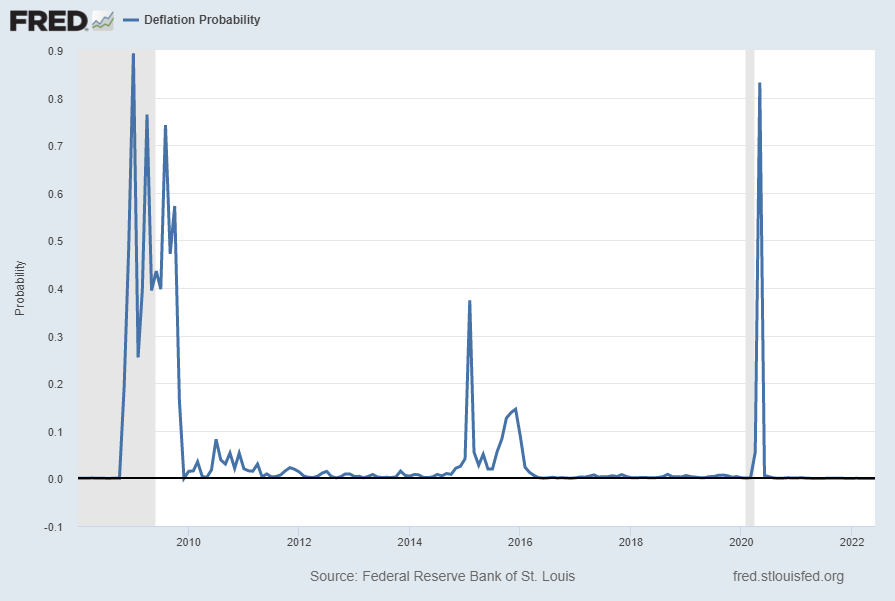
Here is this same U.S. deflation probability measure since 2008:
source: Federal Reserve Bank of St. Louis, Deflation Probability [STLPPMDEF], retrieved from FRED, Federal Reserve Bank of St. Louis; accessed June 30, 2022: https://fred.stlouisfed.org/series/STLPPMDEF
_________
I post various economic indicators and indices because I believe they should be carefully monitored. However, as those familiar with this site are aware, I do not necessarily agree with what they depict or imply.
_____
The Special Note summarizes my overall thoughts about our economic situation
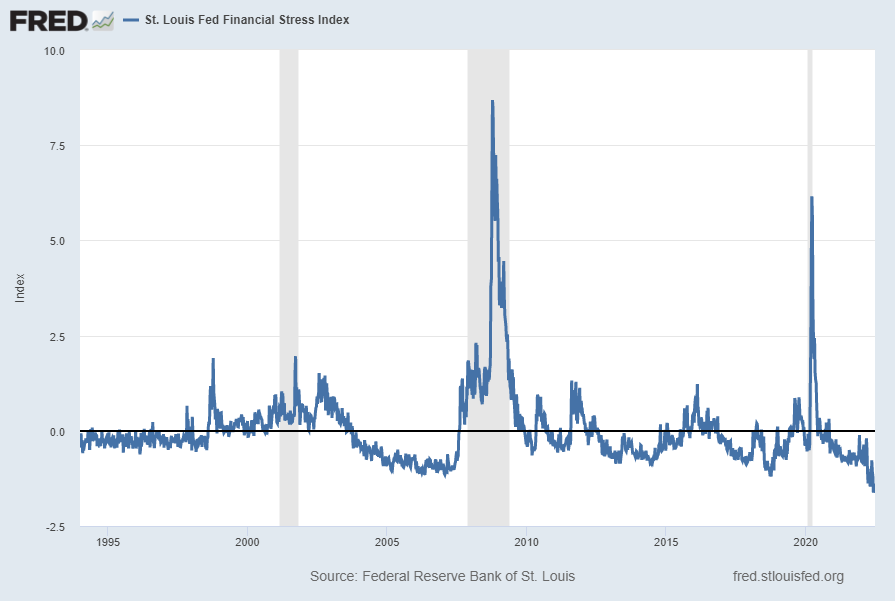
The St. Louis Fed’s Financial Stress Index (STLFSI3) is one index that is supposed to measure stress in the financial system. Its reading as of the June 30, 2022 update (reflecting data through June 24, 2022) is -1.3815:
source: Federal Reserve Bank of St. Louis, St. Louis Fed Financial Stress Index [STLFSI3], retrieved from FRED, Federal Reserve Bank of St. Louis; accessed June 30, 2022: https://fred.stlouisfed.org/series/STLFSI3
Of course, there are a variety of other measures and indices that are supposed to measure financial stress and other related issues, both from the Federal Reserve as well as from private sources.
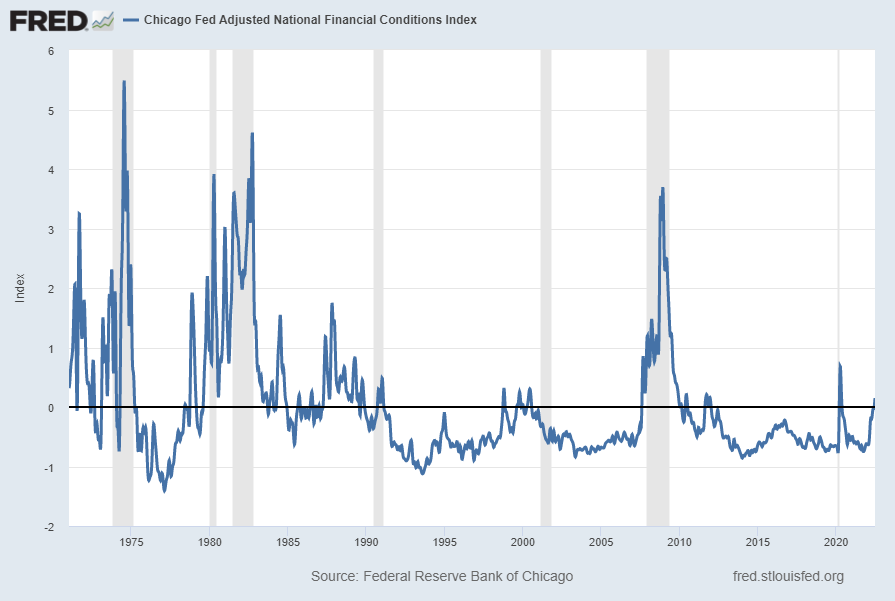
Two other indices that I regularly monitor include the Chicago Fed National Financial Conditions Index (NFCI) as well as the Chicago Fed Adjusted National Financial Conditions Index (ANFCI).
Here are summary descriptions of each, as seen in FRED:
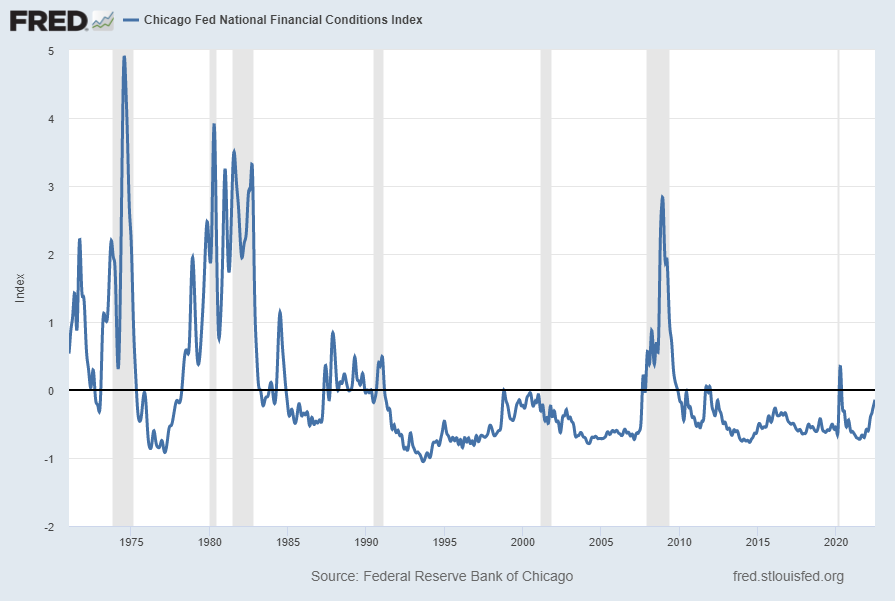
The National Financial Conditions Index (NFCI) measures risk, liquidity and leverage in money markets and debt and equity markets as well as in the traditional and “shadow” banking systems. Positive values of the NFCI indicate financial conditions that are tighter than average, while negative values indicate financial conditions that are looser than average.
The adjusted NFCI (ANFCI). This index isolates a component of financial conditions uncorrelated with economic conditions to provide an update on how financial conditions compare with current economic conditions.
For further information, please visit the Federal Reserve Bank of Chicago’s web site:
Below are the most recently updated charts of the NFCI and ANFCI, respectively.
The NFCI chart below was last updated on June 29, 2022 incorporating data from January 8, 1971 through June 24, 2022 on a weekly basis. The June 24 value is -.14310:
The ANFCI chart below was last updated on June 30, 2022 incorporating data from January 8, 1971 through June 24, 2022, on a weekly basis. The June 24, 2022 value is .14968:
I post various indicators and indices because I believe they should be carefully monitored. However, as those familiar with this site are aware, I do not necessarily agree with what they depict or imply.
_____
The Special Note summarizes my overall thoughts about our economic situation
On June 29, 2022 the latest CFO Survey (formerly called the “Duke/CFO Global Business Outlook”) was released. It contains a variety of statistics regarding how CFOs view business and economic conditions.
In this CFO Survey press release, I found the following to be the most notable excerpts – although I don’t necessarily agree with them:
Views on the economy among CFOs have worsened for 2022, according to the latest results of The CFO Survey, a joint project of Duke University’s Fuqua School of Business and the Federal Reserve Banks of Richmond and Atlanta.
“Price pressures have increased, real revenue growth has stalled, and optimism about the overall economy has fallen sharply,” said John Graham, a Fuqua finance professor and the survey’s academic director. “Monetary tightening is one of several factors dampening the economic outlook.”
also:
CFOs on average expect real GDP to grow 1.5 percent over the next 12 months, down from an expectation last quarter of 2.5 percent.
The average probability of negative GDP growth over the next 12 months was 21 percent, compared to a 12 percent probability last quarter.
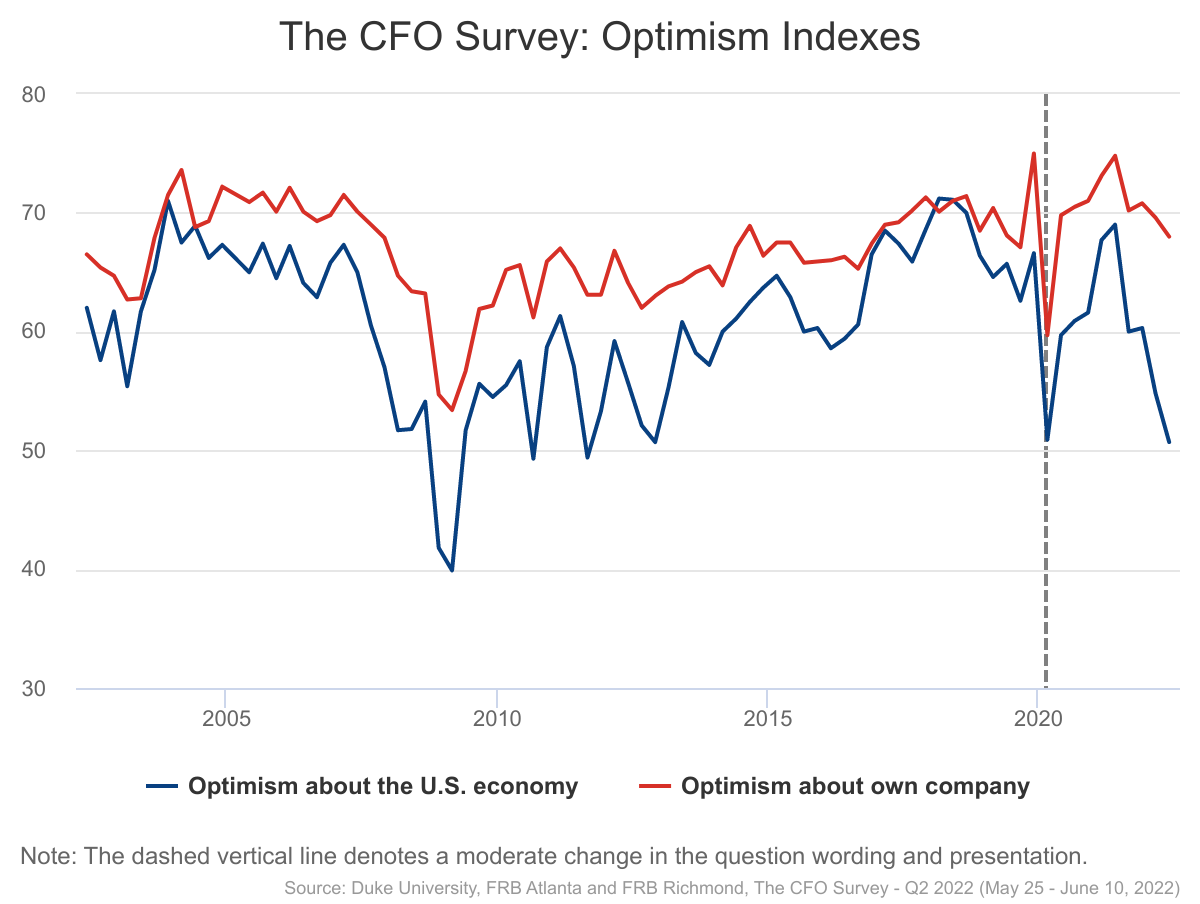
The CFO Optimism Index about the U.S. economy continued its steep decline. On a scale from 0 to 100, optimism fell to 50.7 this quarter, compared to 54.8 last quarter and 60.3 two quarters ago.
This CFO Survey contains an Optimism Index chart, with the blue line showing U.S. Optimism (with regard to the economy) at 50.7, as seen below:
—
It should be interesting to see how well the CFOs predict business and economic conditions going forward. I discussed past various aspects of this, and the importance of these predictions, in the July 9, 2010 post titled “The Business Environment”.
(past posts on CEO and CFO surveys can be found under the “CFO and CEO Confidence” label)
_____
I post various economic forecasts because I believe they should be carefully monitored. However, as those familiar with this site are aware, I do not necessarily agree with many of the consensus estimates and much of the commentary in these forecast surveys.
_____
The Special Note summarizes my overall thoughts about our economic situation
For reference purposes, below are two sets of charts depicting growth in the money supply.
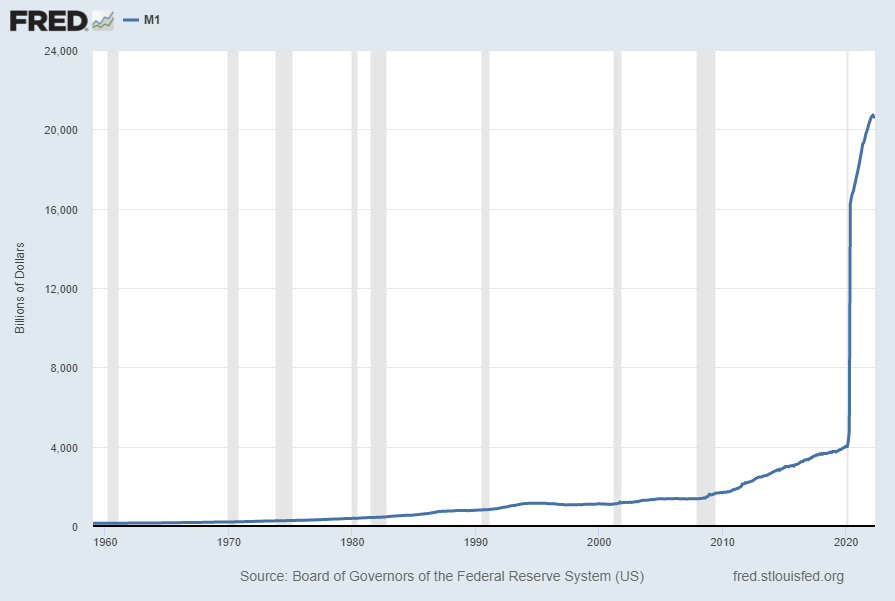
The first shows the M1, defined in FRED as the following:
Before May 2020, M1 consists of (1) currency outside the U.S. Treasury, Federal Reserve Banks, and the vaults of depository institutions; (2) demand deposits at commercial banks (excluding those amounts held by depository institutions, the U.S. government, and foreign banks and official institutions) less cash items in the process of collection and Federal Reserve float; and (3) other checkable deposits (OCDs), consisting of negotiable order of withdrawal, or NOW, and automatic transfer service, or ATS, accounts at depository institutions, share draft accounts at credit unions, and demand deposits at thrift institutions.
Beginning May 2020, M1 consists of (1) currency outside the U.S. Treasury, Federal Reserve Banks, and the vaults of depository institutions; (2) demand deposits at commercial banks (excluding those amounts held by depository institutions, the U.S. government, and foreign banks and official institutions) less cash items in the process of collection and Federal Reserve float; and (3) other liquid deposits, consisting of OCDs and savings deposits (including money market deposit accounts). Seasonally adjusted M1 is constructed by summing currency, demand deposits, and OCDs (before May 2020) or other liquid deposits (beginning May 2020), each seasonally adjusted separately.
Here is the “M1 Money Stock” (seasonally adjusted) chart, updated on June 28, 2022 depicting data through May 2022, with a value of $20,632.9 Billion:
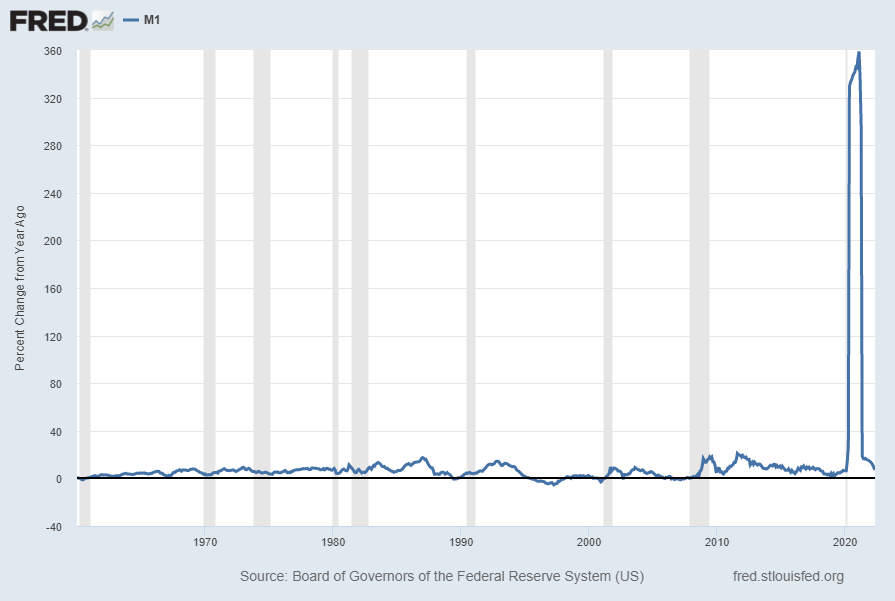
Here is the “M1 Money Stock” chart on a “Percent Change From Year Ago” basis, with a current value of 7.1%:
Data Source: Board of Governors of the Federal Reserve System (US), M1 Money Stock [M1SL], retrieved from FRED, Federal Reserve Bank of St. Louis; accessed June 28, 2022: https://fred.stlouisfed.org/series/M1SL
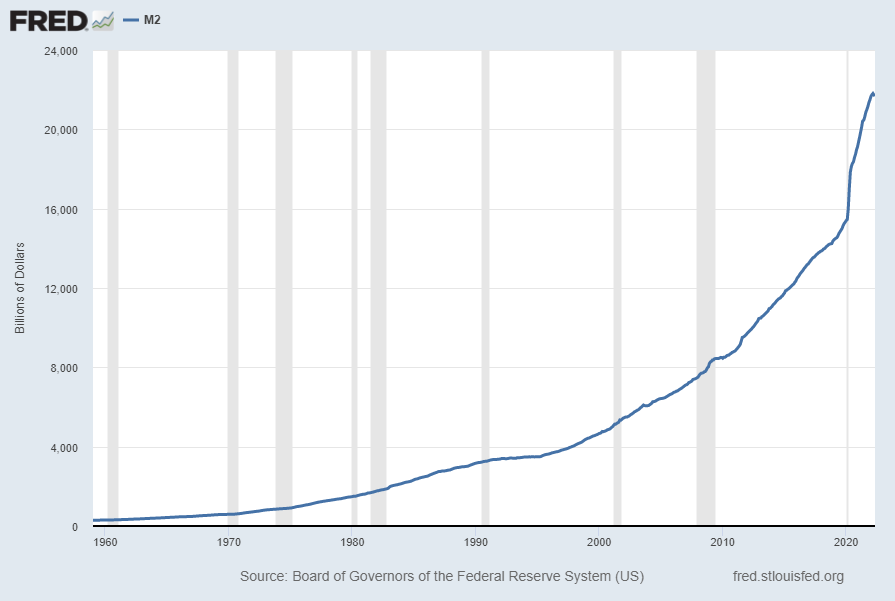
The second set shows M2, defined in FRED as the following:
Before May 2020, M2 consists of M1 plus (1) savings deposits (including money market deposit accounts); (2) small-denomination time deposits (time deposits in amounts of less than $100,000) less individual retirement account (IRA) and Keogh balances at depository institutions; and (3) balances in retail money market funds (MMFs) less IRA and Keogh balances at MMFs.
Beginning May 2020, M2 consists of M1 plus (1) small-denomination time deposits (time deposits in amounts of less than $100,000) less IRA and Keogh balances at depository institutions; and (2) balances in retail MMFs less IRA and Keogh balances at MMFs. Seasonally adjusted M2 is constructed by summing savings deposits (before May 2020), small-denomination time deposits, and retail MMFs, each seasonally adjusted separately, and adding this result to seasonally adjusted M1.
Here is the “M2 Money Stock” (seasonally adjusted) chart, updated on June 28, 2022, depicting data through May 2022, with a value of $21,754.2 Billion:
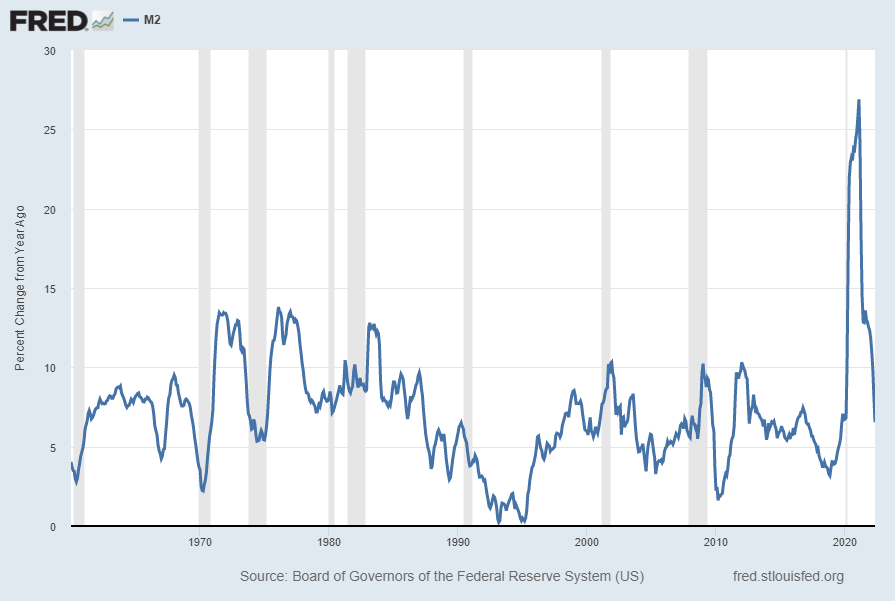
Here is the “M2 Money Stock” chart on a “Percent Change From Year Ago” basis, with a current value of 6.5%:
Data Source: Board of Governors of the Federal Reserve System (US), M2 Money Stock [M2SL], retrieved from FRED, Federal Reserve Bank of St. Louis; accessed June 28, 2022: https://fred.stlouisfed.org/series/M2SL
_____
The Special Note summarizes my overall thoughts about our economic situation
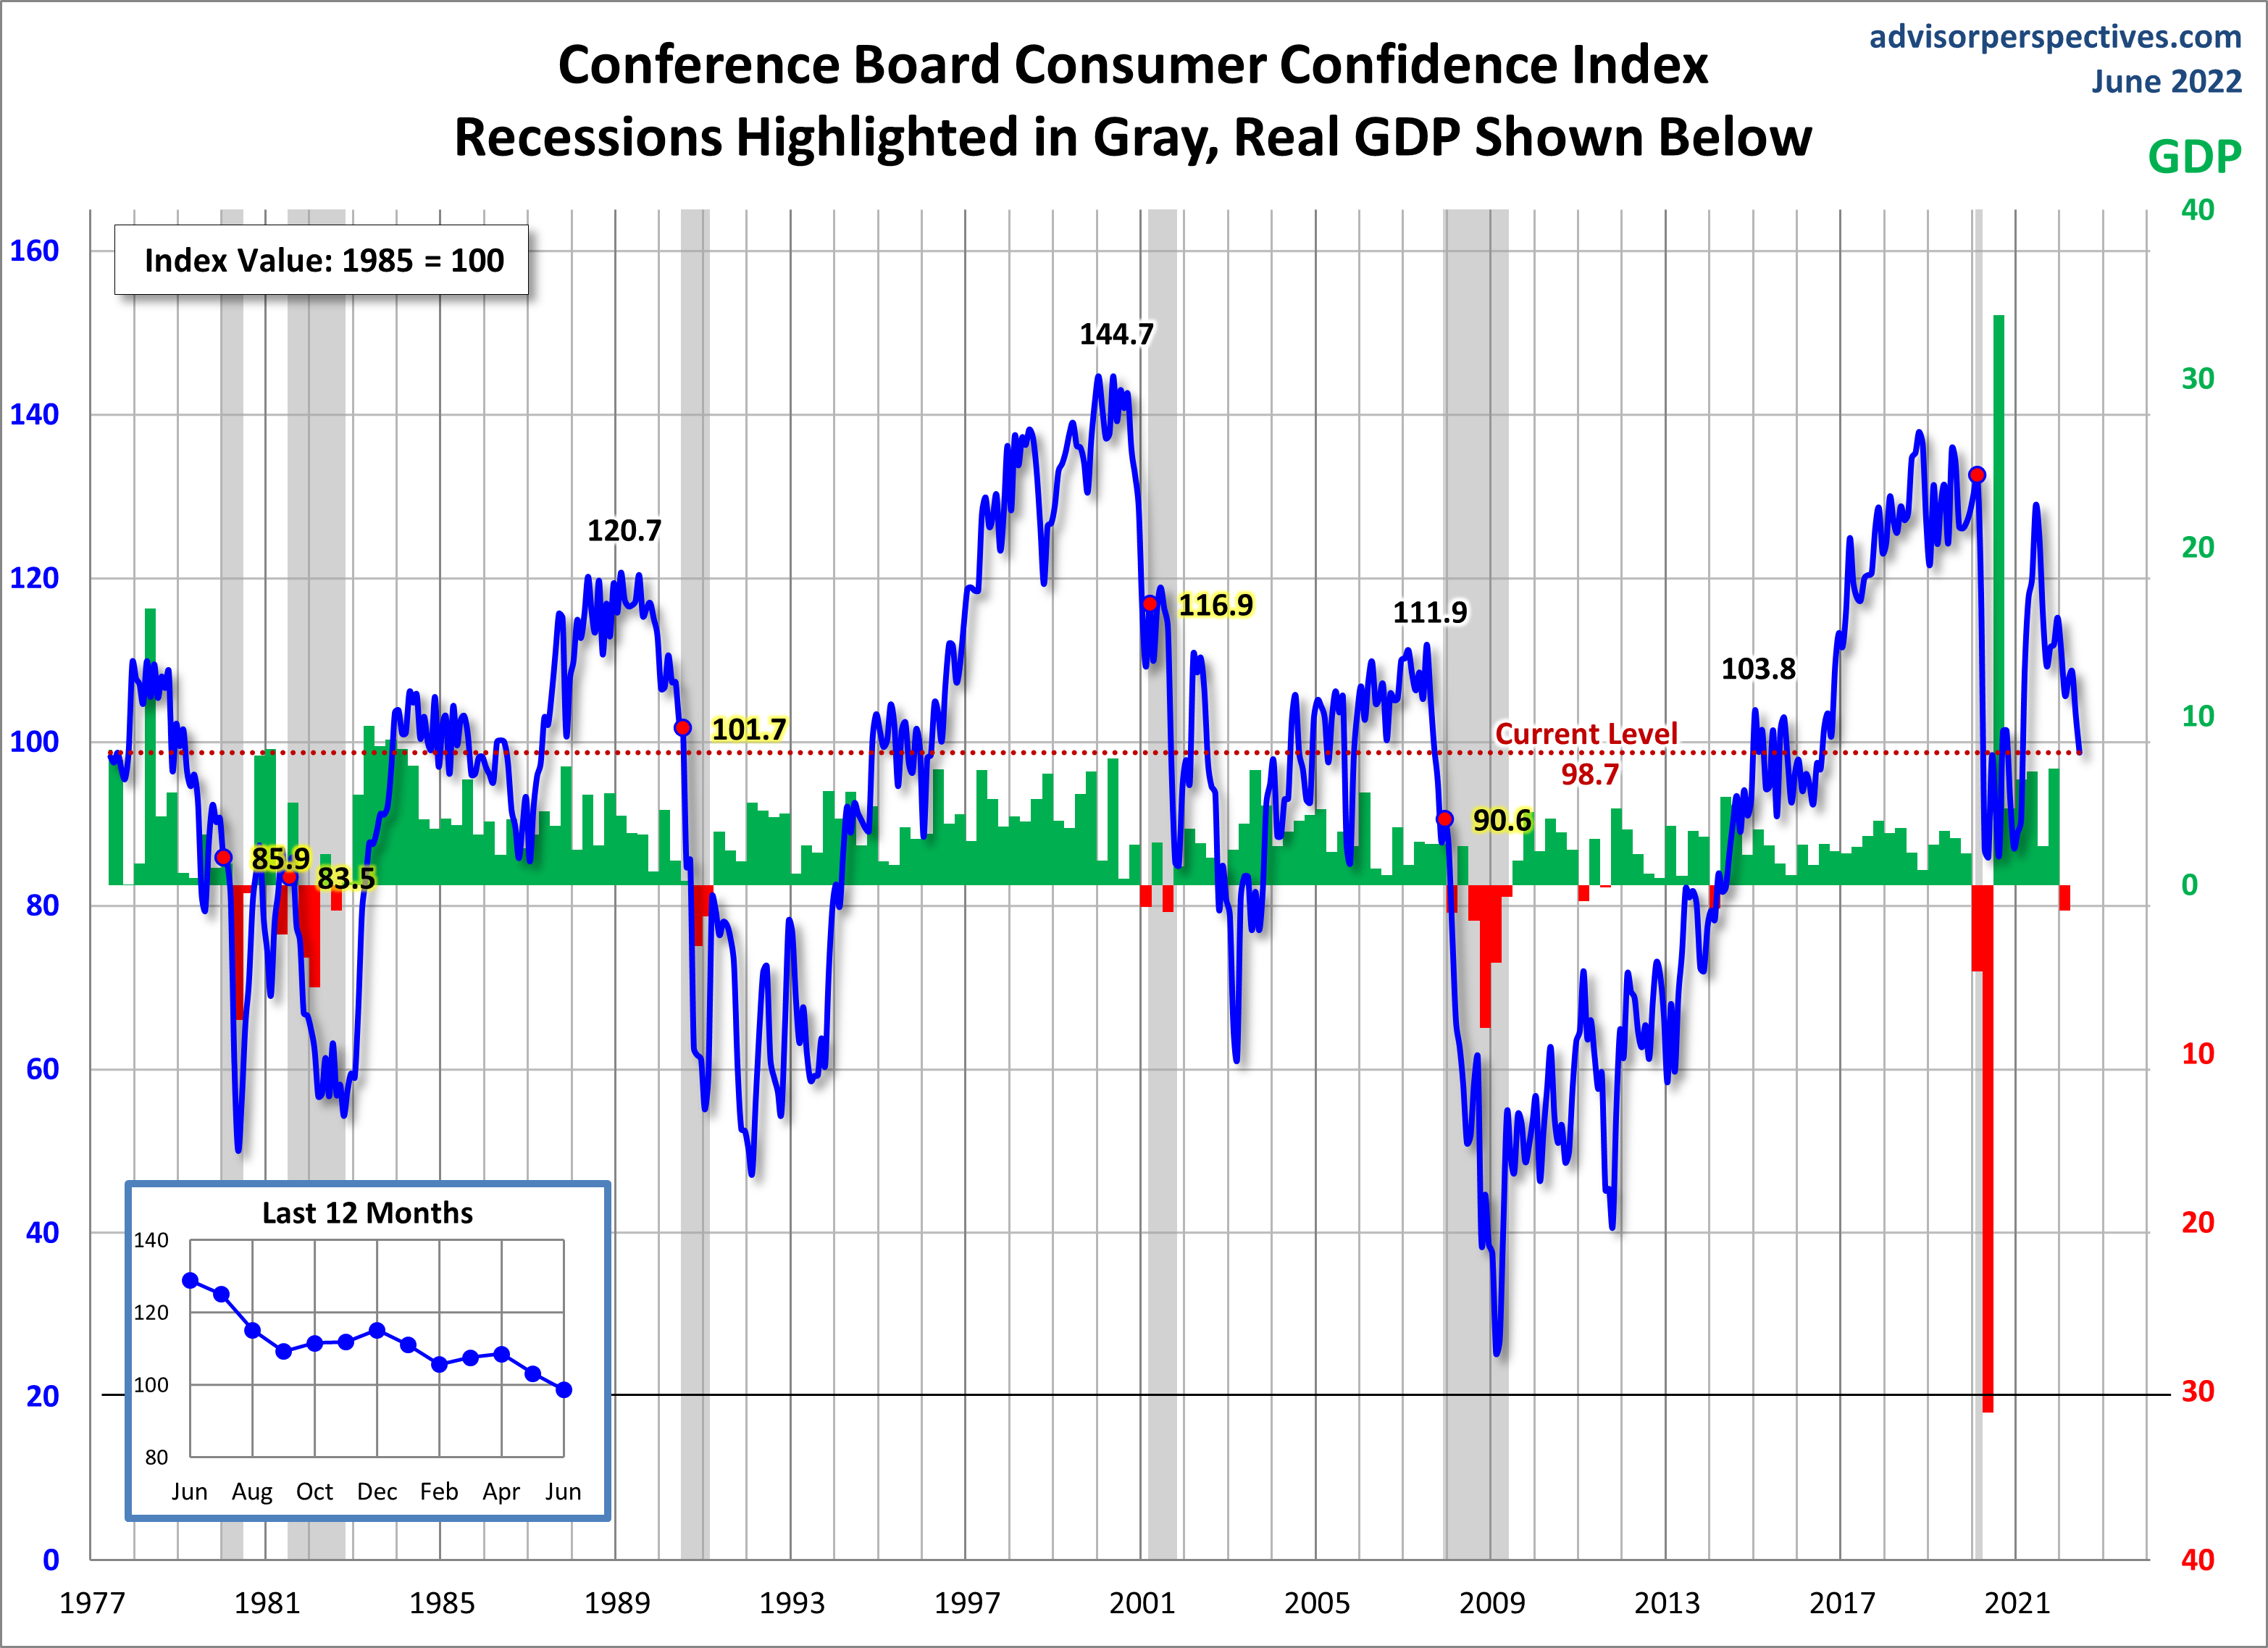
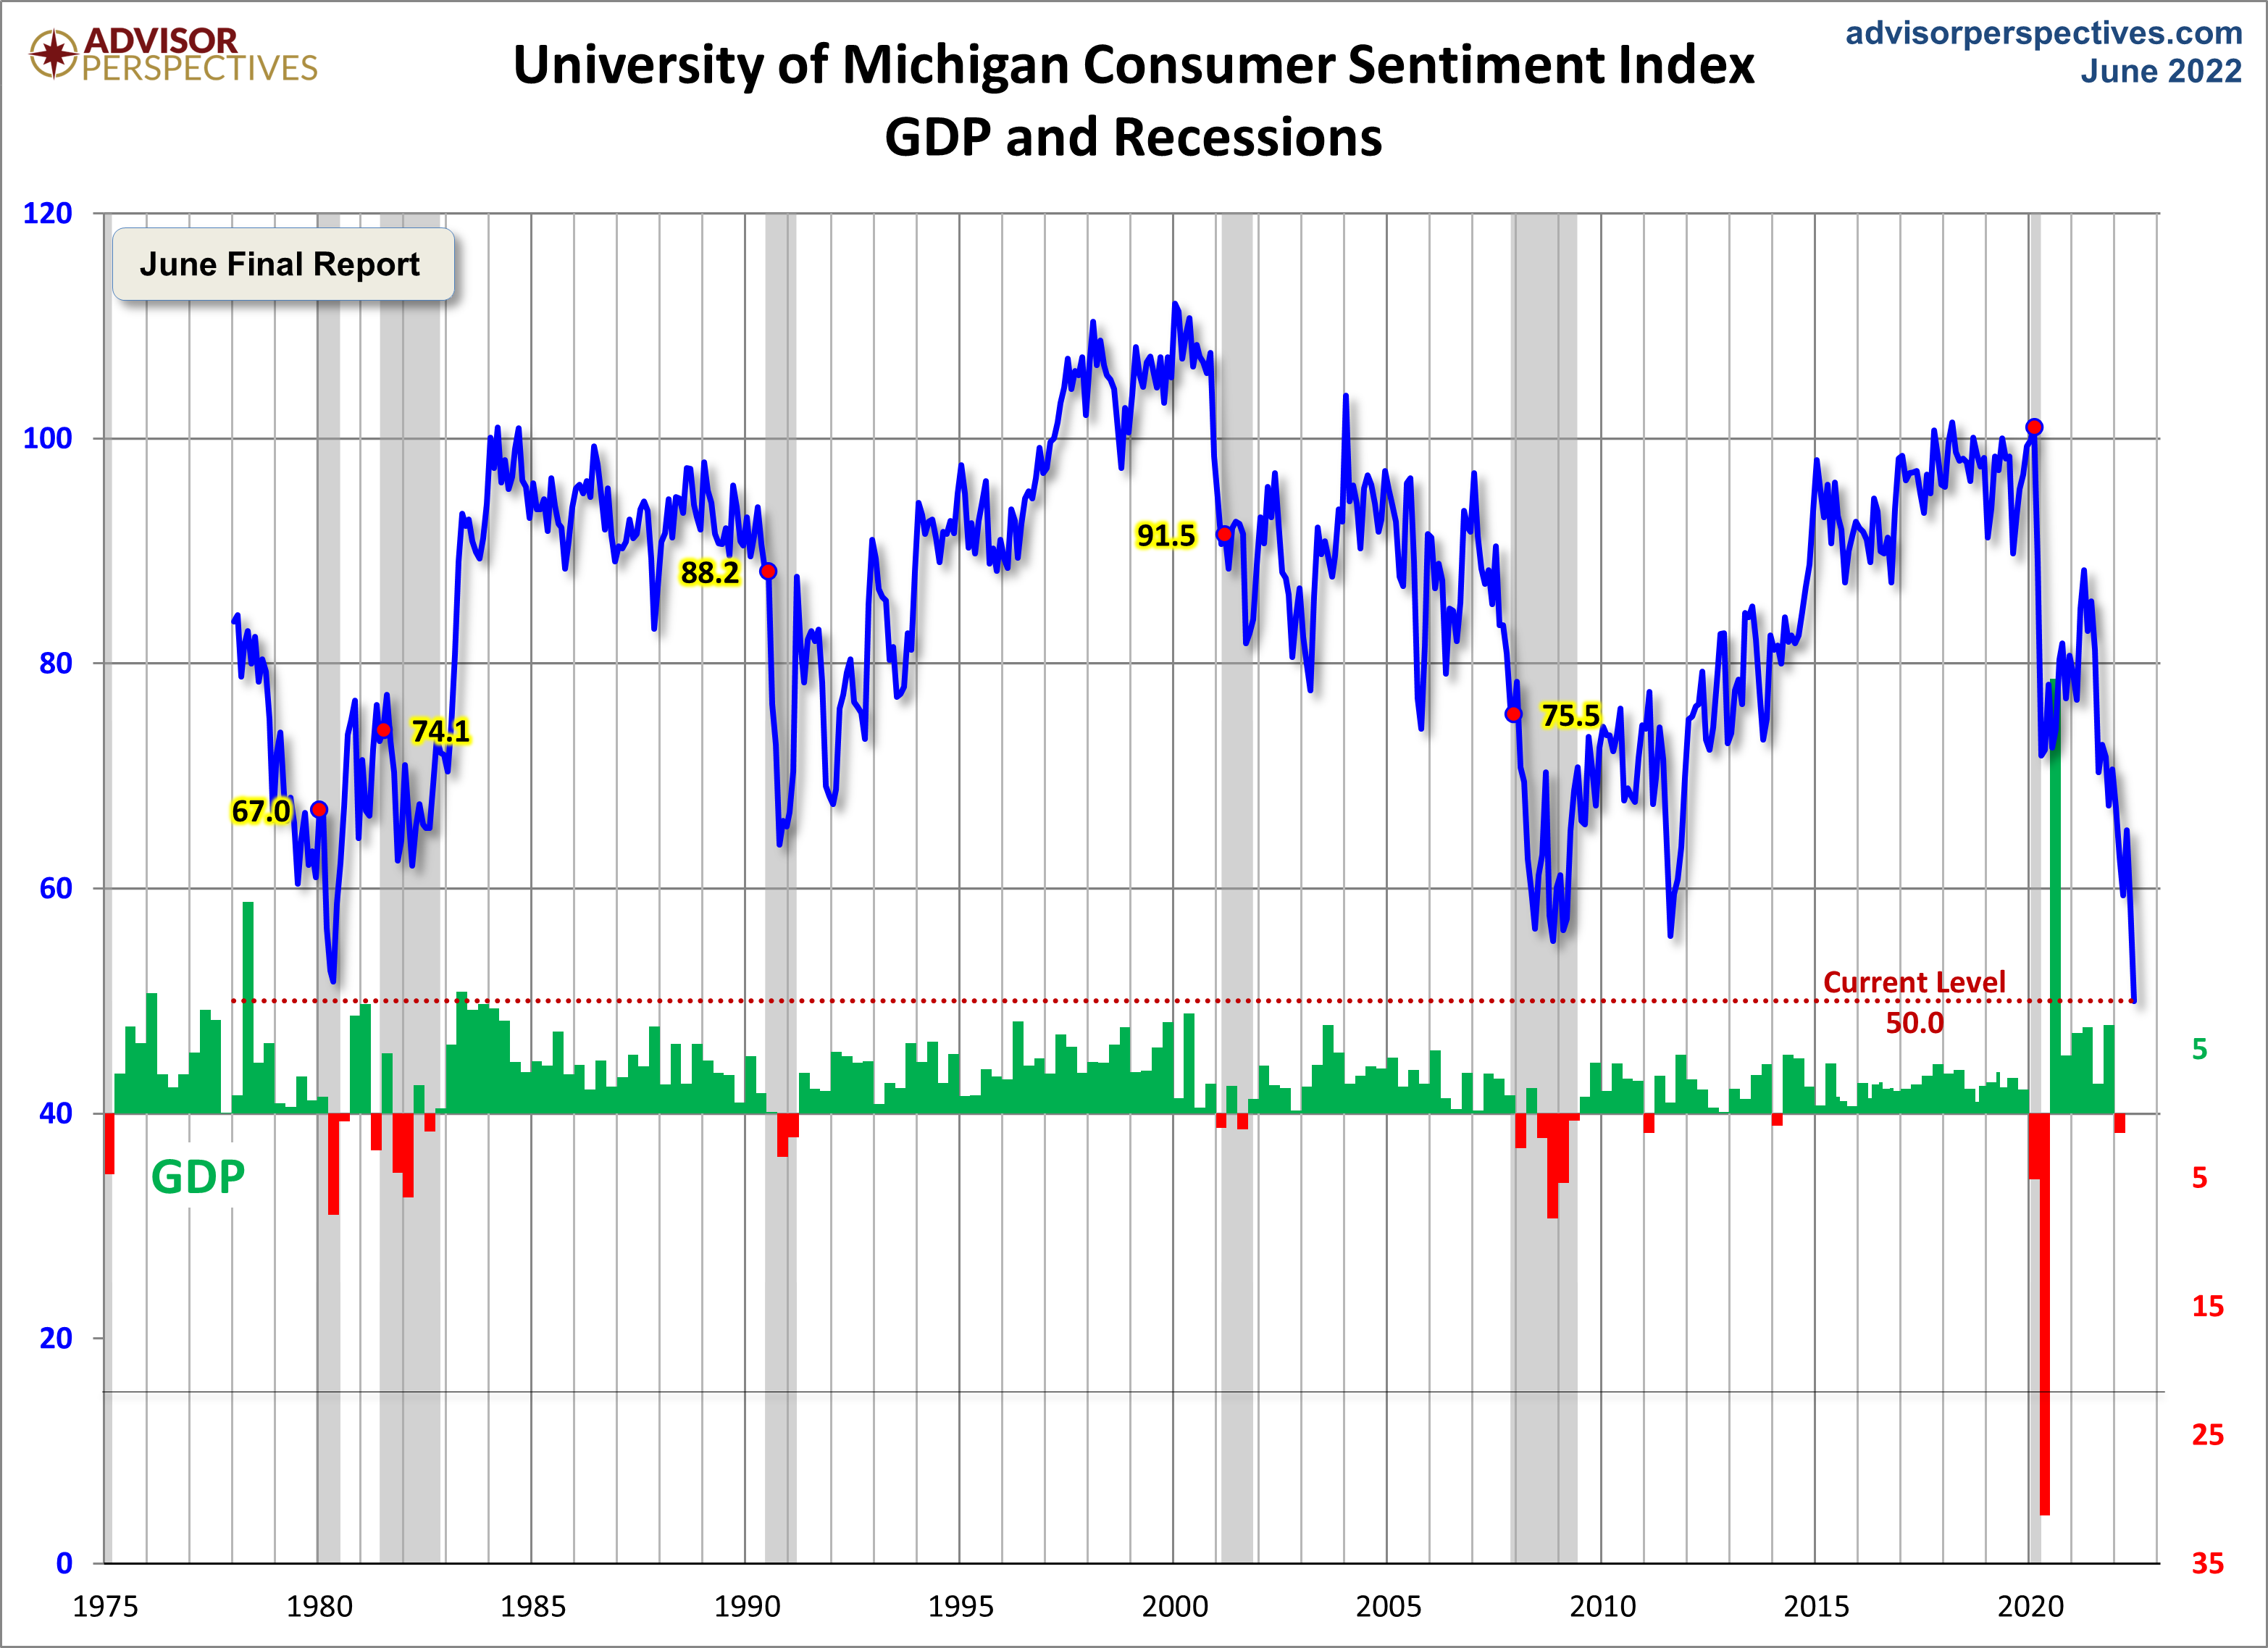
Advisor Perspectives had a post of June 28, 2022 (“CB LEI: Falls Again in May“) that displays the latest Conference Board Consumer Confidence and University of Michigan Consumer Sentiment Index charts. They are presented below:
(click on charts to enlarge images)
–
While I don’t believe that confidence surveys should be overemphasized, I find these readings and trends to be notable, especially in light of a variety of other highly disconcerting measures highlighted throughout this site.
_____
The Special Note summarizes my overall thoughts about our economic situation
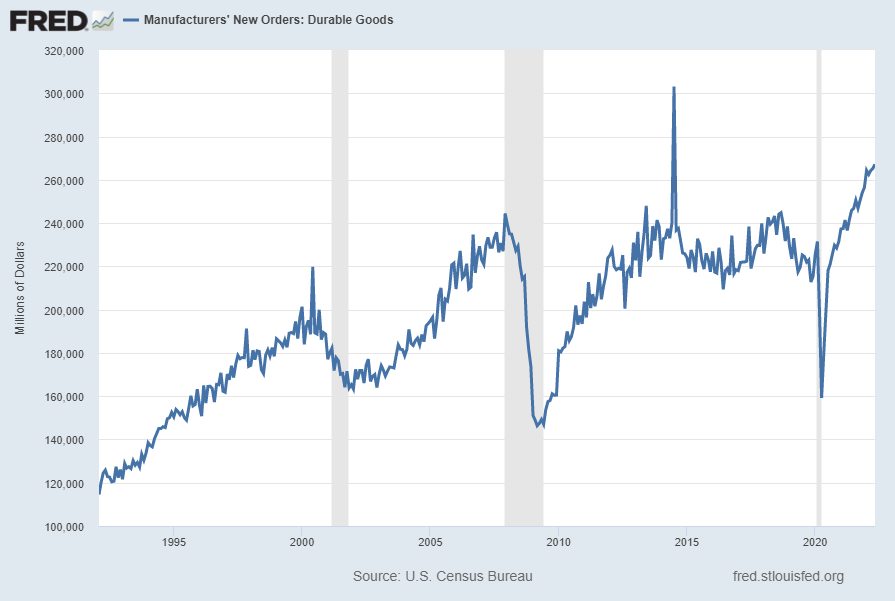
Many people place emphasis on Durable Goods New Orders as a prominent economic indicator and/or leading economic indicator.
For reference, below are two charts depicting this measure.
First, from the St. Louis Fed site (FRED), a chart through May 2022, updated on June 27, 2022. This value is $267,202 ($ Millions):
(click on charts to enlarge images)
–
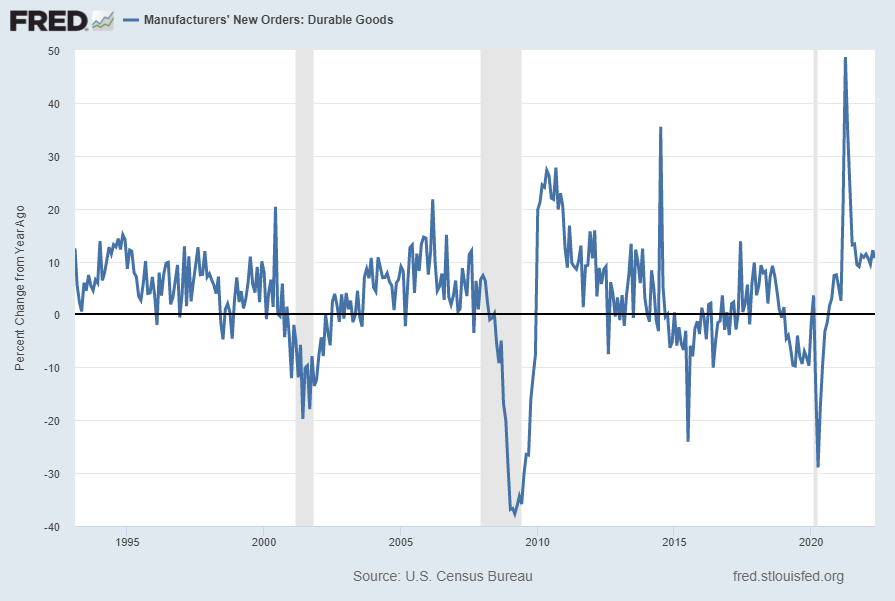
Second, here is the chart depicting this measure on a “Percent Change from a Year Ago” basis, with a last value of 10.6%:
Data Source: FRED, Federal Reserve Economic Data, Federal Reserve Bank of St. Louis: Manufacturers’ New Orders: Durable Goods [DGORDER]; U.S. Department of Commerce: Census Bureau; accessed June 27, 2022; http://research.stlouisfed.org/fred2/series/DGORDER
_________
I post various indicators and indices because I believe they should be carefully monitored. However, as those familiar with this site are aware, I do not necessarily agree with what they depict or imply.
_____
The Special Note summarizes my overall thoughts about our economic situation
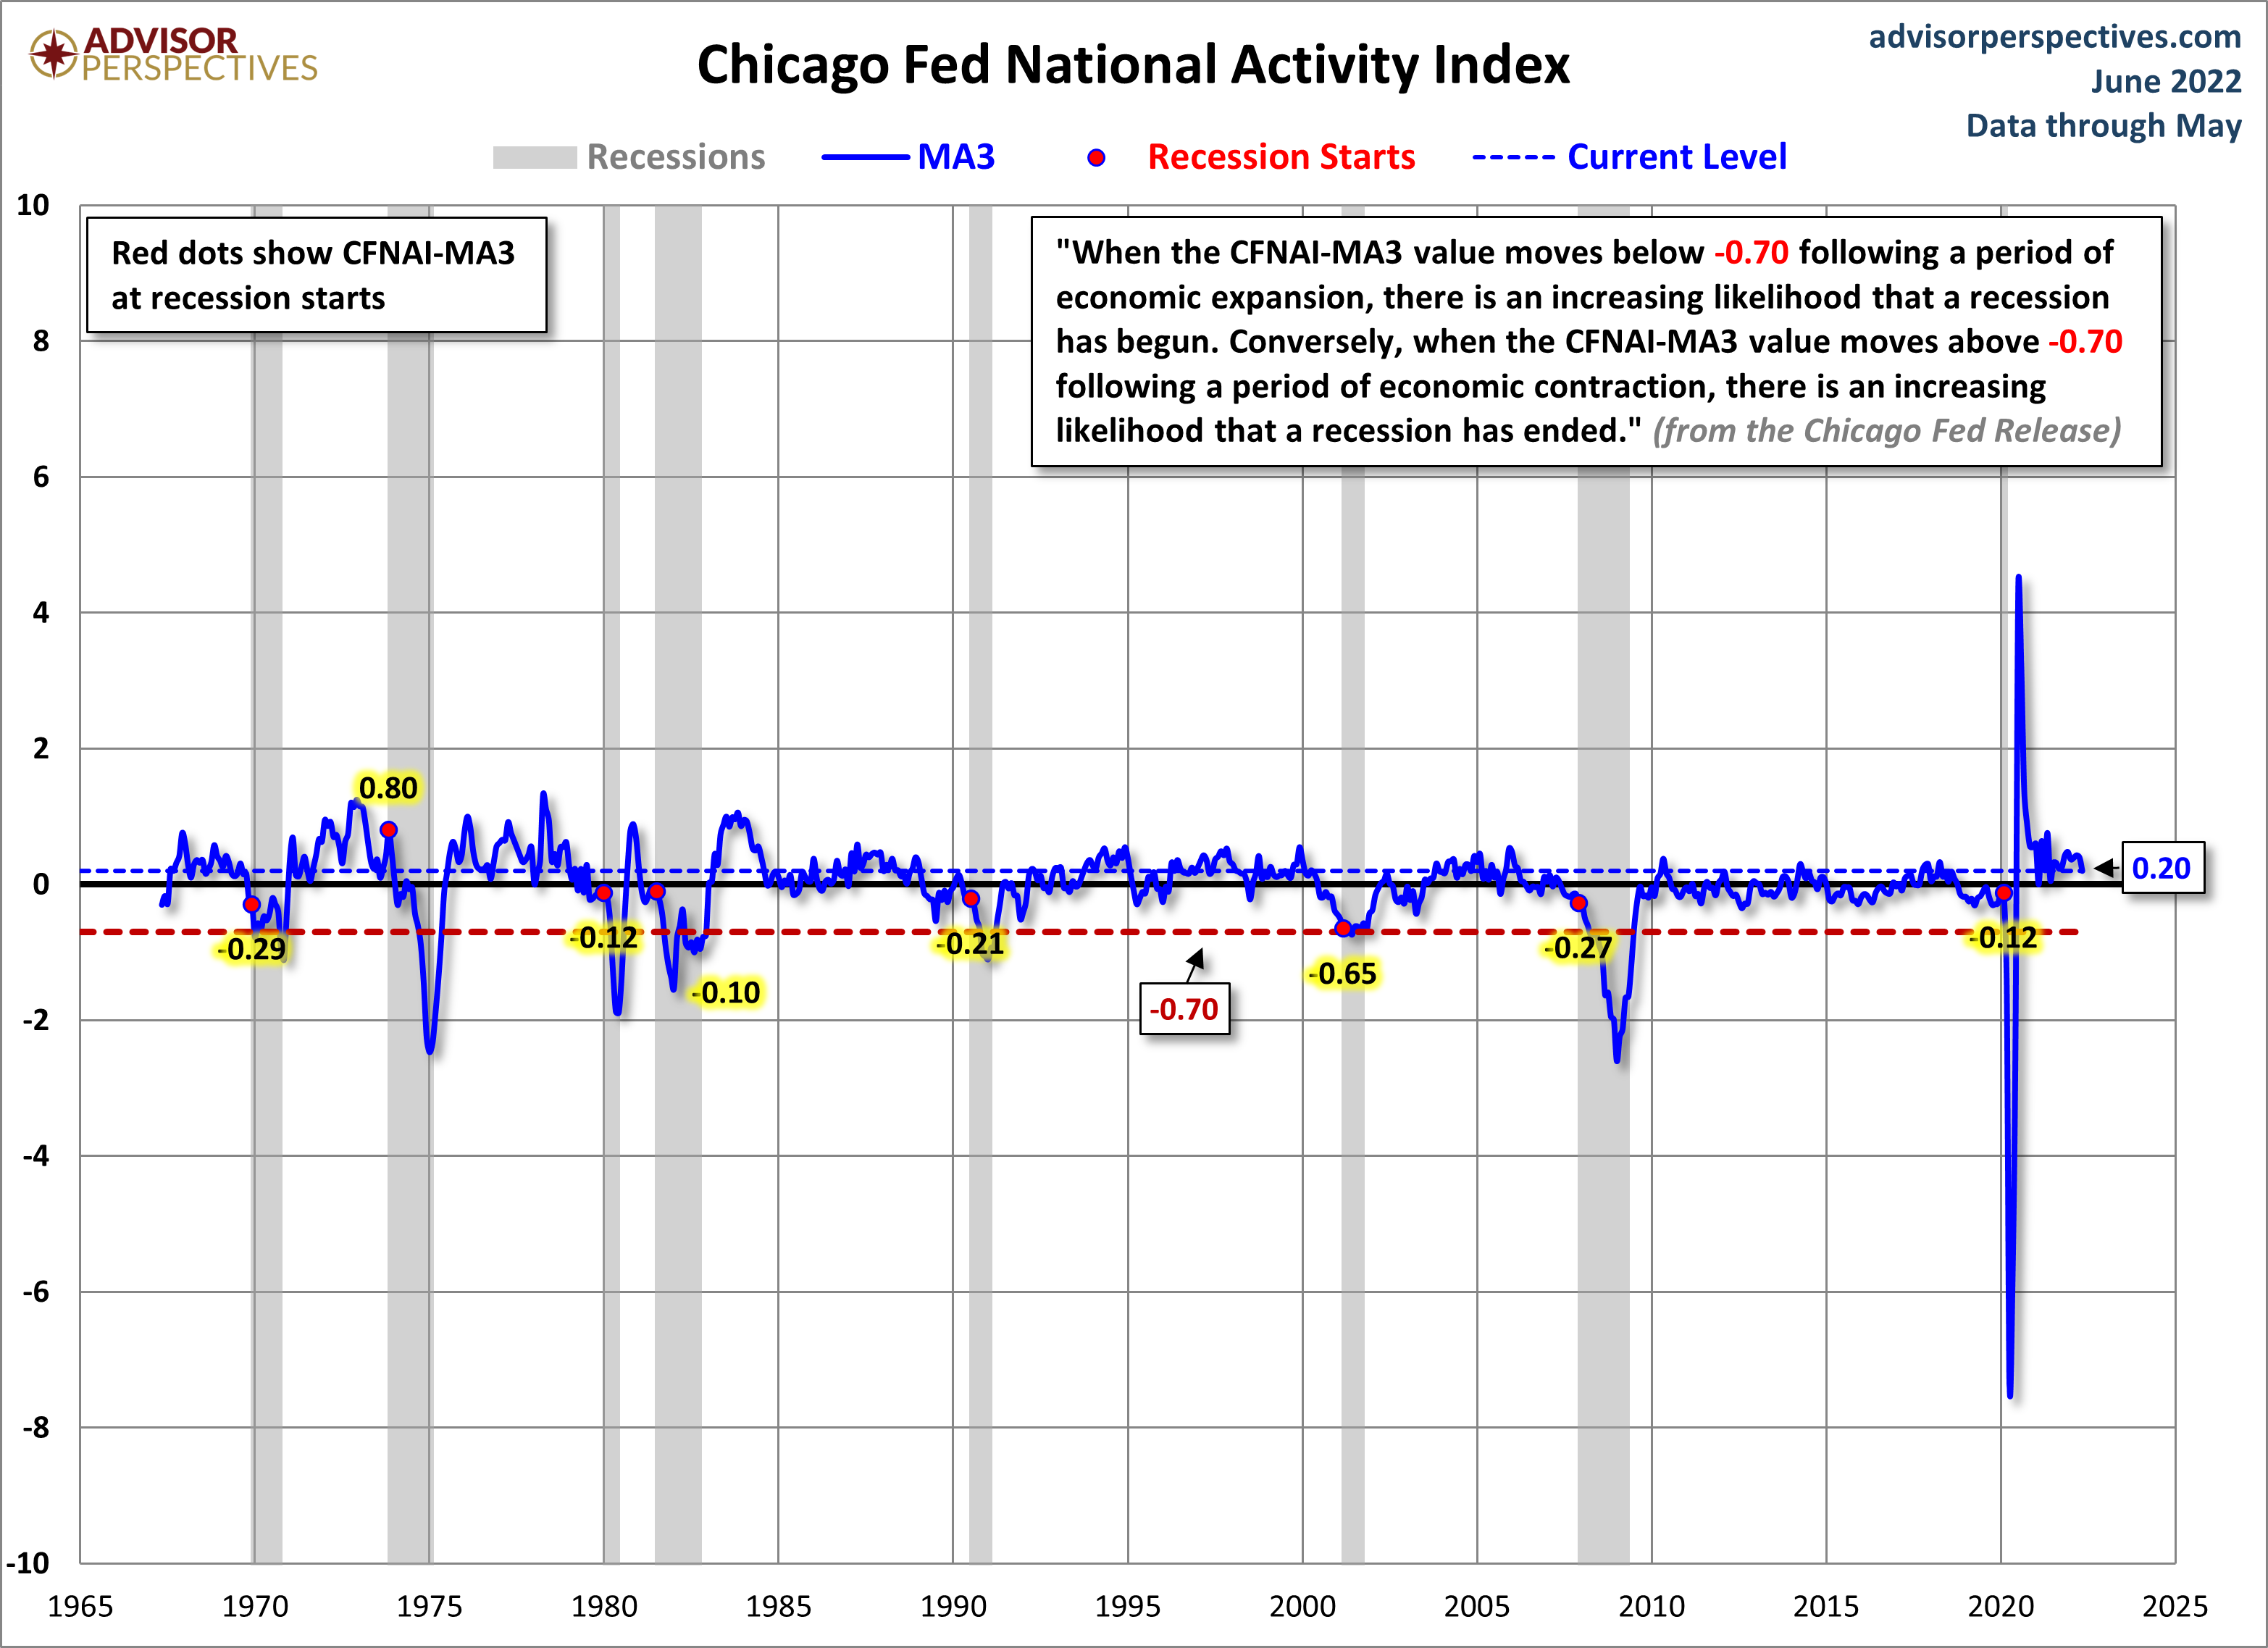
The Chicago Fed National Activity Index (CFNAI) and the Aruoba-Diebold-Scotti Business Conditions Index (ADS Index) are two broad-based economic indicators that I regularly feature in this site.
The short-term and long-term trends of each continue to be notable.
The Advisor Perspectives’ post of June 24, 2022, titled “The Philly Fed ADS Index Business Conditions Index Update” displays both the CFNAI MA-3 (CFNAI on a 3-month Moving Average) and ADS Index (91-Day Moving Average) from a variety of perspectives.
Of particular note, two of the charts, shown below, denote where the current levels of each reading is relative to the beginning of recessionary periods, as depicted by the red dots.
The CFNAI MA-3:
(click on charts to enlarge images)
–
The ADS Index, 91-Day MA:
–
Also shown in the aforementioned post is a chart of each with a long-term trendline (linear regression) as well as a chart depicting GDP for comparison purposes.
_________
I post various indicators and indices because I believe they should be carefully monitored. However, as those familiar with this site are aware, I do not necessarily agree with what they depict or imply.
_____
The Special Note summarizes my overall thoughts about our economic situation
Perhaps the main reason that I write of our economic situation is that I continue to believe, based upon various analyses, that our economic situation is in many ways misunderstood. While no one likes to contemplate a future rife with economic adversity, current and future economic problems must be properly recognized and rectified if high-quality, sustainable long-term economic vitality is to be realized.
There are an array of indications and other “warning signs” – many readily apparent – that current economic activity and financial market performance is accompanied by exceedingly perilous dynamics.
I have written extensively about this peril, including in the following:
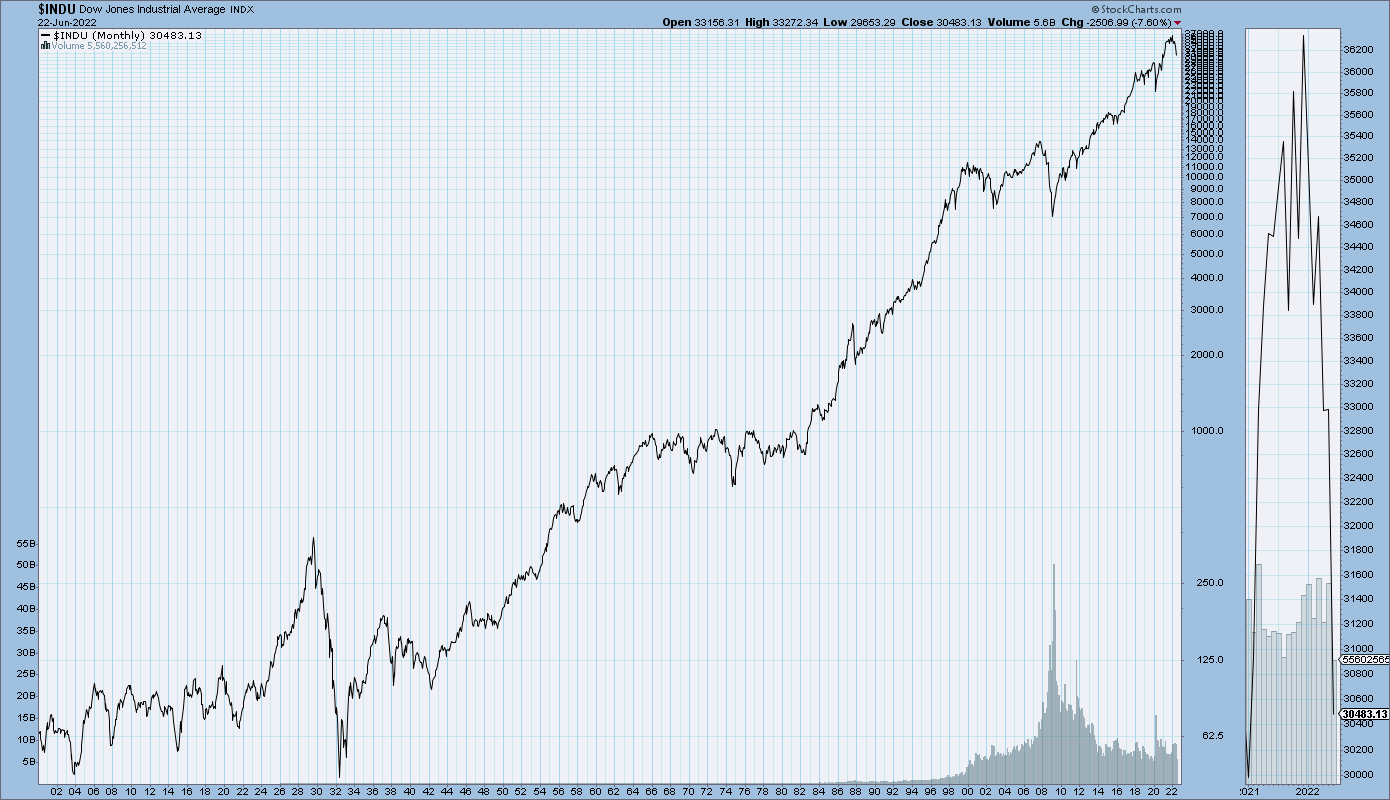
My analyses continues to indicate that the growing level of financial danger will lead to the next stock market crash that will also involve (as seen in 2008) various other markets as well. Key attributes of this next crash is its outsized magnitude (when viewed from an ultra-long term historical perspective) and the resulting economic impact. This next financial crash is of tremendous concern, as my analyses indicate it will lead to a Super Depression – i.e. an economy characterized by deeply embedded, highly complex, and difficult-to-solve problems.
For long-term reference purposes, here is a chart of the Dow Jones Industrial Average since 1900, depicted on a monthly basis using a LOG scale (updated through June 22, 2022, with a last value of 30,483.13):
(click on chart to enlarge image)(chart courtesy of StockCharts.com)
_____
The Special Note summarizes my overall thoughts about our economic situation
There are a variety of economic models that are supposed to predict the probabilities of recession.
While I don’t agree with the methodologies employed or probabilities of impending economic weakness as depicted by the following two models, I think the results of these models should be monitored.
Please note that each of these models is updated regularly, and the results of these – as well as other recession models – can fluctuate significantly.
Currently (last updated June 20, 2022 using data through May 2022) this “Yield Curve” model shows a 4.1063% probability of a recession in the United States twelve months ahead. For comparison purposes, it showed a 3.7102% probability through April 2022, and a chart going back to 1960 is seen at the “Probability Of U.S. Recession Predicted by Treasury Spread.” (pdf)
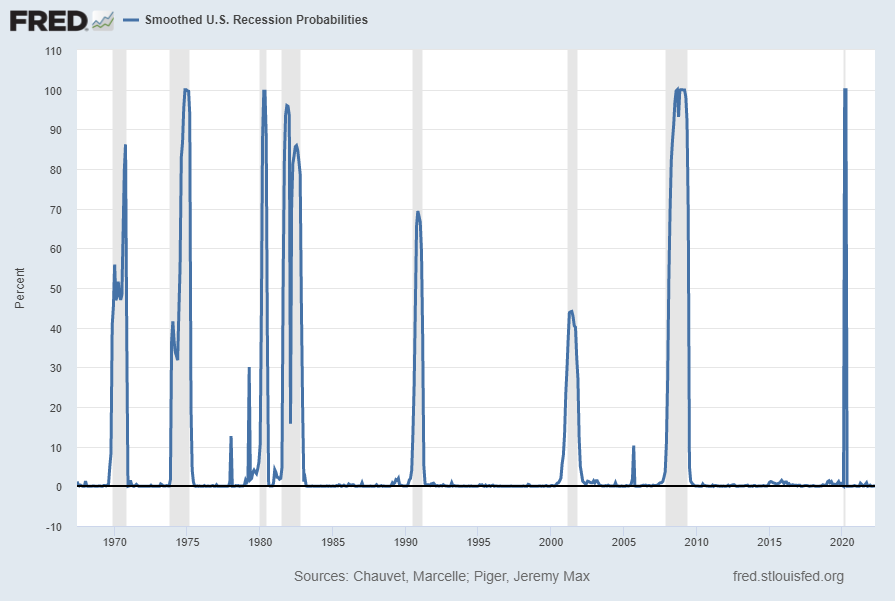
Smoothed recession probabilities for the United States are obtained from a dynamic-factor markov-switching model applied to four monthly coincident variables: non-farm payroll employment, the index of industrial production, real personal income excluding transfer payments, and real manufacturing and trade sales. This model was originally developed in Chauvet, M., “An Economic Characterization of Business Cycle Dynamics with Factor Structure and Regime Switching,” International Economic Review, 1998, 39, 969-996. (http://faculty.ucr.edu/~chauvet/ier.pdf)
This model, last updated on June 2, 2022 currently shows a .1% probability using data through April 2022.
Here is the FRED chart (last updated June 2, 2022):
Data Source: Piger, Jeremy Max and Chauvet, Marcelle, Smoothed U.S. Recession Probabilities [RECPROUSM156N], retrieved from FRED, Federal Reserve Bank of St. Louis, accessed June 22, 2022: http://research.stlouisfed.org/fred2/series/RECPROUSM156N
–
The two models featured above can be compared against measures seen in recent posts. For instance, as seen in the June 21, 2022 post titled “The June 2022 Wall Street Journal Economic Forecast Survey“ economists surveyed averaged a 44% probability of a U.S. recession within the next 12 months.
_____
The Special Note summarizes my overall thoughts about our economic situation
I found numerous items to be notable – although I don’t necessarily agree with them – both within the article and in the forecasts section.
An excerpt:
Economists surveyed by The Wall Street Journal have dramatically raised the probability of recession, now putting it at 44% in the next 12 months, a level usually seen only on the brink of or during actual recessions.
The likelihood of a recession has increased rapidly this year as inflationary pressures remained strong and the Federal Reserve took increasingly aggressive action to tame them. Economists on average put the probability of the economy being in recession sometime in the next 12 months at 28% in the Journal’s last survey in April and at 18% in January.
Since the Journal began asking the question in mid-2005, a 44% recession probability is seldom seen outside of an actual recession. In December 2007, the month that the 2007-to-2009 recession began, economists assigned a 38% probability. In February 2020, when the last recession began, they assigned a 26% probability.
As noted above, and also seen in the “Recession Probability” section, the average response as to whether the economy will be in a recession within the next 12 months was 44%. The individual estimates, of those who responded, ranged from 1% to 99%. For reference, the average response in April’s survey [the previously published survey] was 28%.
As stated in the article, the survey’s 53 respondents were academic, financial and business economists. The survey was conducted June 16 – June 17. Not every economist answered every question.
–
Economic Forecasts
The current average forecasts among economists polled include the following:
GDP:
full-year 2022: 1.28%
full-year 2023: 1.36%
full-year 2024: n/a
Unemployment Rate:
December 2022: 3.70%
December 2023: 4.19%
December 2024: n/a
10-Year Treasury Yield:
December 2022: n/a
December 2023: n/a
December 2024: n/a
CPI:
December 2022: 6.97%
December 2023: 3.23%
December 2024: n/a
Core PCE:
full-year 2022: n/a
full-year 2023: n/a
full-year 2024: n/a
(note: I have highlighted this WSJ Economic Forecast survey each time it is published; it was published monthly until April 2021, after which the survey is conducted (at least) every three months; commentary on past surveys can be found under the “Economic Forecasts” label)
_____
I post various economic forecasts because I believe they should be carefully monitored. However, as those familiar with this site are aware, I do not necessarily agree with many of the consensus estimates and much of the commentary in these forecast surveys.
_____
The Special Note summarizes my overall thoughts about our economic situation