Wednesday, August 31, 2011

4 Confidence Charts – August 2011


Here are four charts reflecting confidence survey readings.  These are from the SentimenTrader.com site.

I find these charts valuable as they provide a long-term history of each survey, which is rare.

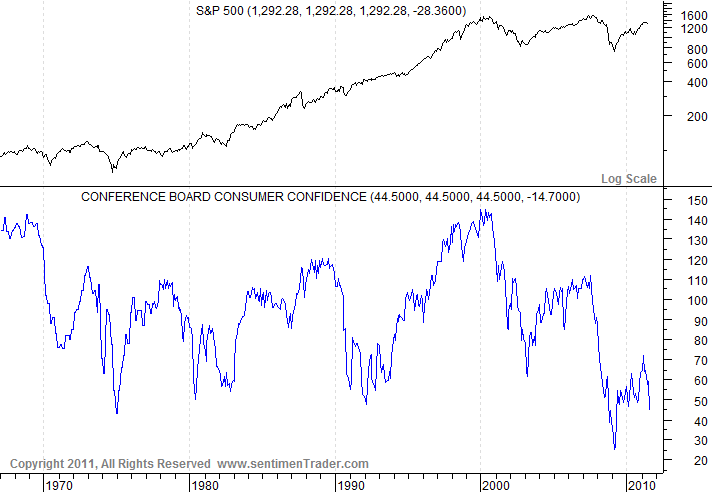
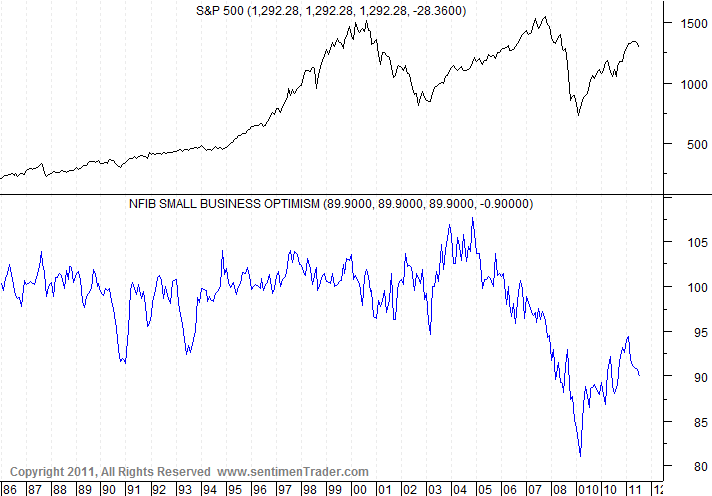
Each survey chart is plotted in blue, below the S&P500:

(click on each chart to enlarge image)

Conference Board Consumer Confidence, last updated 8-30-11:


-

University of Michigan Consumer Confidence, last updated 8-30-11:


-

Bloomberg Consumer Comfort Index (formerly the ABC News Consumer Comfort Index) last updated 8-11-11:


-

NFIB Small Business Optimism, last updated 8-11-11:


-
As one can see, these charts continue to show subdued readings, especially when viewed from a long-term perspective.

These charts should be interesting to monitor going forward.  Although I don’t believe that confidence surveys should be overemphasized, they do help to delineate how the economic environment is being perceived.
_____

The Special Note summarizes my overall thoughts about our economic situation


SPX at 1221.49 as this post is written
Monday, August 29, 2011

The Near Term Direction Of The Stock Market


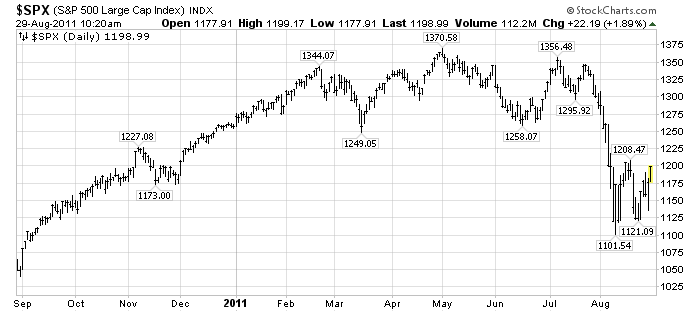
There seems to be consensus that the stock market, as represented by the S&P500, "bottomed" during its August 9th low at 1101.54.  Here is the daily 1-year chart of the S&P500 for reference:


(click on chart to enlarge image)(chart courtesy of StockCharts.com)


-

Was that August 9 low a "true bottom" - i.e. one that will not be breached, at least in the short-term?  I believe that the answer will be "no."

The decline from the May 2 top of 1370.58 has proven to be very "tricky" and difficult to predict.  I wrote of a variety of problematical fundamental and technical issues during the decline.  While the August 9 low did have the look of a "selling climax," based upon a variety of measures, a variety of technical and fundamental problems continue to exist, including market expectations concerning QE3 and the uncertainty regarding its implementation and timing.

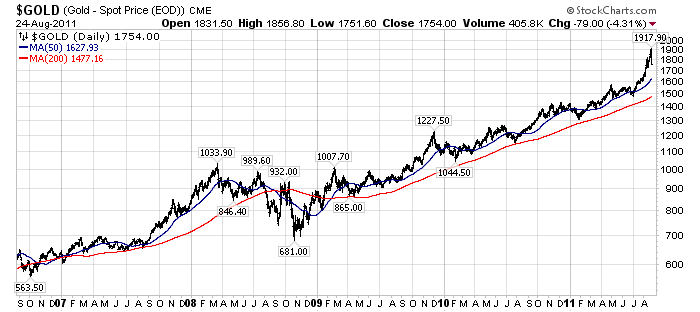
One issue that I am very closely monitoring is that of the price of Gold and the significance of its current correction off of its highs, which I discussed in an August 25 post titled "Gold and Deflationary Pressures."  As I stated in that post:
I am very closely monitoring Gold as I believe a steep, abnormal correction could serve to (further) indicate deflationary pressures – which of course would have outsized impacts on financial markets, the economy, and economic policy (particularly QE3 or some other large intervention.)
There are a variety of other major trends happening that lack recognition.  I will be writing of these in future posts...
_____


The Special Note summarizes my overall thoughts about our economic situation


SPX at 1196.88 as this post is written
Gold (December futures) at $1803.10/oz  as this post is written

Ben Bernanke's Jackson Hole Speech - Notable Excerpts


On Friday August 26 Ben Bernanke gave a speech at Jackson Hole titled "The Near- and Longer-Term  Prospects for the U.S. Economy."

I do not agree with various comments in the speech.  However, here are a few excerpts that I found most noteworthy:
As I will discuss, although important problems certainly exist, the growth fundamentals of the United States do not appear to have been permanently altered by the shocks of the past four years. It may take some time, but we can reasonably expect to see a return to growth rates and employment levels consistent with those underlying fundamentals.
also:
In the United States, a cyclical recovery, though a modest one by historical standards, is in its ninth quarter. In the financial sphere, the U.S. banking system is generally much healthier now, with banks holding substantially more capital.
also:
Notwithstanding these more positive developments, however, it is clear that the recovery from the crisis has been much less robust than we had hoped. From the latest comprehensive revisions to the national accounts as well as the most recent estimates of growth in the first half of this year, we have learned that the recession was even deeper and the recovery even weaker than we had thought; indeed, aggregate output in the United States still has not returned to the level that it attained before the crisis. Importantly, economic growth has for the most part been at rates insufficient to achieve sustained reductions in unemployment, which has recently been fluctuating a bit above 9 percent. Temporary factors, including the effects of the run-up in commodity prices on consumer and business budgets and the effect of the Japanese disaster on global supply chains and production, were part of the reason for the weak performance of the economy in the first half of 2011; accordingly, growth in the second half looks likely to improve as their influence recedes. However, the incoming data suggest that other, more persistent factors also have been at work.
also:
Nevertheless, financial stress has been and continues to be a significant drag on the recovery, both here and abroad. Bouts of sharp volatility and risk aversion in markets have recently re-emerged in reaction to concerns about both European sovereign debts and developments related to the U.S. fiscal situation, including the recent downgrade of the U.S. long-term credit rating by one of the major rating agencies and the controversy concerning the raising of the U.S. federal debt ceiling.
also:
In addition to refining our forward guidance, the Federal Reserve has a range of tools that could be used to provide additional monetary stimulus. We discussed the relative merits and costs of such tools at our August meeting. We will continue to consider those and other pertinent issues, including of course economic and financial developments, at our meeting in September, which has been scheduled for two days (the 20th and the 21st) instead of one to allow a fuller discussion. The Committee will continue to assess the economic outlook in light of incoming information and is prepared to employ its tools as appropriate to promote a stronger economic recovery in a context of price stability.
also:
Notwithstanding the trauma of the crisis and the recession, the U.S. economy remains the largest in the world, with a highly diverse mix of industries and a degree of international competitiveness that, if anything, has improved in recent years. Our economy retains its traditional advantages of a strong market orientation, a robust entrepreneurial culture, and flexible capital and labor markets. And our country remains a technological leader, with many of the world's leading research universities and the highest spending on research and development of any nation.
Of course, the United States faces many growth challenges. Our population is aging, like those of many other advanced economies, and our society will have to adapt over time to an older workforce. Our K-12 educational system, despite considerable strengths, poorly serves a substantial portion of our population. The costs of health care in the United States are the highest in the world, without fully commensurate results in terms of health outcomes. But all of these long-term issues were well known before the crisis; efforts to address these problems have been ongoing, and these efforts will continue and, I hope, intensify.
also:
Notwithstanding this observation, which adds urgency to the need to achieve a cyclical recovery in employment, most of the economic policies that support robust economic growth in the long run are outside the province of the central bank.
also:
To achieve economic and financial stability, U.S. fiscal policy must be placed on a sustainable path that ensures that debt relative to national income is at least stable or, preferably, declining over time. As I have emphasized on previous occasions, without significant policy changes, the finances of the federal government will inevitably spiral out of control, risking severe economic and financial damage.1
_____


The Special Note summarizes my overall thoughts about our economic situation


SPX at 1197.48 as this post is written

Thursday, August 25, 2011

Gold And Deflationary Pressures


In my April 27 post ("Reasons Behind Gold's Ascent") I outlined a variety of factors that I believed were driving Gold's advance.

Point #4 on the list was "...an expectation of high future inflation."

It should be also noted that the inverse of this condition - an expectation of deflation - can serve to depress Gold's price.

This is particularly noteworthy at present, as Gold has recently started a correction after a very steep rally.  I am very closely monitoring Gold as I believe a steep, abnormal correction could serve to (further) indicate deflationary pressures - which of course would have outsized impacts on financial markets, the economy, and economic policy (particularly QE3 or some other large intervention.)

For reference, here is the daily Gold price chart for the last 5 years, updated through yesterday, shown on a LOG scale with both the 50dma  and 200dma lines as indicated:

(click on chart to enlarge image)(chart courtesy of StockCharts.com; annotations by the author)


Gold at $1726/oz (December futures) at the time of this post
_____

The Special Note summarizes my overall thoughts about our economic situation


SPX at 1176.07 as this post is written

Tuesday, August 23, 2011

Updates On Economic Indicators August 2011


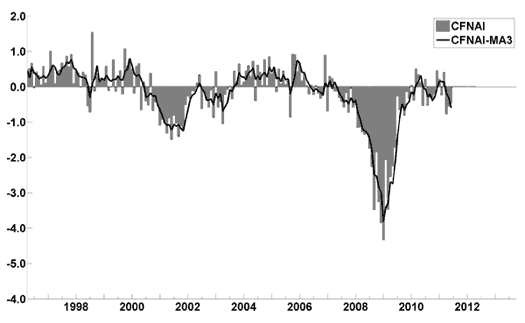
Here is an update on various indicators that are supposed to predict and/or depict economic activity.  These indicators have been discussed in previous blog posts:

The August Chicago Fed National Activity Index (CFNAI)(pdf) updated as of August 22, 2011:


-

The Consumer Metrics Institute Contraction Watch:


-

The USA TODAY/IHS Global Insight Economic Outlook Index:

An excerpt from the August 1 Press Release, titled “Index sees stronger growth in second half of 2011” :
The July update of the USA TODAY/IHS Global Insight Economic Outlook Index shows real GDP growth, at a six-month annualized growth rate, slowly gaining strength in the second half of the year. Lower oil prices, improved auto production and sales, increased business equipment spending, strong exports and recovery in the multi-family residential sector are expected to push growth above 3% in November and December. High unemployment and continued weakness in the single-family housing sector remain drags on growth.
-

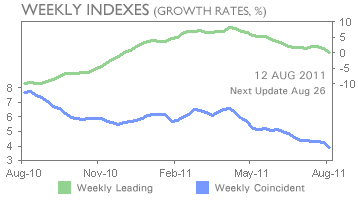
The ECRI WLI (Weekly Leading Index):

As of 8/12/11 the WLI was at 123.9 and the WLI, Gr. was at -.1%.  A chart of the growth rates of the Weekly Leading and Weekly Coincident Indexes:


-

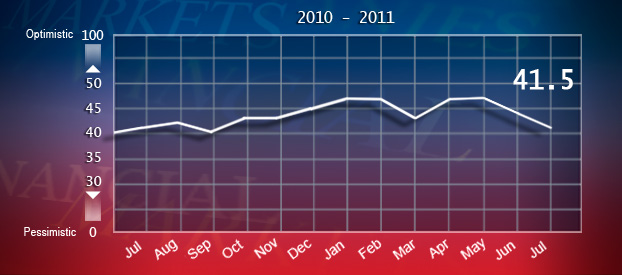
The Dow Jones ESI (Economic Sentiment Indicator):

The Indicator as of August 1 was at 41.5, as seen below:


An excerpt from the August 1 Press Release, titled "Return to Recession is a Real Risk According to Dow Jones Economic Sentiment Indicator" :
As Washington focuses on the debt ceiling, there are signs that the rest of the U.S. economy is running into trouble, according the Dow Jones Economic Sentiment Indicator. In July, the ESI dropped to 41.5 from a reading of 44 in June. The indicator has now fallen for two consecutive months for a cumulative decline of 5.1, the worst two-month drop since the fall of 2008.
“It would be easy to blame the dip in the ESI on the U.S. debt crisis, but much of the gloom stems from Main Street rather than Washington,” says Dow Jones Newswires “Money Talks” columnist Alen Mattich. “The readings this summer have fallen enough that it seems to suggest a slide back into recession is a real risk.”
-

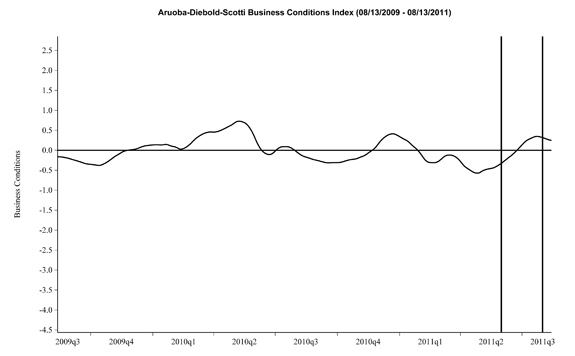
The Aruoba-Diebold-Scotti Business Conditions (ADS) Index:

Here is the latest chart, depicting 8-13-09 to 8-13-11:


-

The Conference Board Leading (LEI) and Coincident (CEI) Economic Indexes:

As per the August 18 release, the LEI was at 115.8 and the CEI was at 103.3 in July.
An excerpt from the August 18 Press Release:
Says Ataman Ozyildirim, economist at The Conference Board:  "The U.S. LEI continued to increase in July. However, with the exception of the money supply and interest rate components, other leading indicators show greater weakness – consistent with increasing concerns about the health of the economic expansion. Despite rising volatility, the leading indicators still suggest economic activity should be slowly expanding through the end of the year.”
_________

I post various indicators and indices because I believe they should be carefully monitored.  However, as those familiar with this blog are aware, I do not necessarily agree with what they depict or imply.
_____


The Special Note summarizes my overall thoughts about our economic situation


SPX at 1123.82 as this post is written

Monday, August 22, 2011

Philadelphia Fed – 3rd Quarter 2011 Survey Of Professional Forecasters


The Philadelphia Fed Third Quarter 2011 Survey of Professional Forecasters was released on August 12.  This survey is somewhat unique in various regards, such as it incorporates a longer time frame for various measures.

The survey shows, among many measures, the following expectations:

GDP:
full-year 2011 : 1.7%
full-year 2012 : 2.6%
full-year 2013 : 2.9%
full-year 2014 : 3.1%

Unemployment Rate: (annual average level)
for 2011: 9.0%
for 2012: 8.6%
for 2013: 8.1%
for 2014: 7.6%
-

As for “the chance of a contraction in real GDP in any of the next four quarters,” estimates range from 17.2-20.9% for each of the quarters through Q3 2012.

As well, there are also a variety of time frames shown (present through the year 2020) with the expected inflation of each.  Inflation is measured in Headline and Core CPI and Headline and Core PCE.  Over all time frames expectations are shown to be in the 1.4-3.2% range.
_____

I post various economic forecasts because I believe they should be carefully monitored.  However, as those familiar with this blog are aware, I do not agree with many of the consensus estimates and much of the commentary in these forecast surveys.
_____


The Special Note summarizes my overall thoughts about our economic situation


SPX at 1123.53 as this post is written

Friday, August 19, 2011

PPI, CPI & Profit Margin Trends


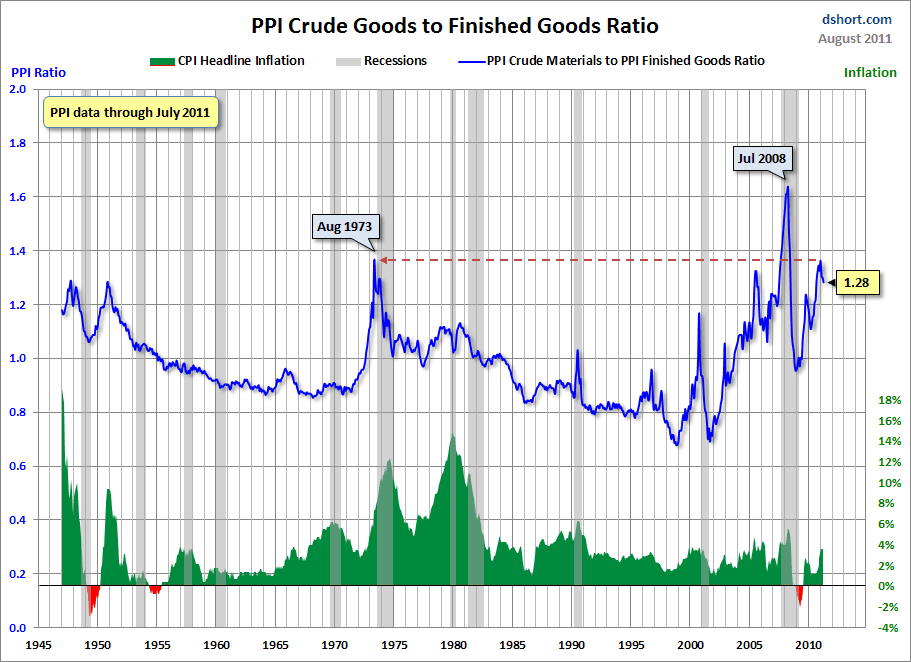
In various past posts I have written of the challenges businesses face in pricing, given today’s economic environment.  One aspect that I mentioned in the April 25 2011 and December 16 2010 posts was how the PPI (Producer Price Index) growth was significantly outpacing that of the CPI.

Since those posts, this PPI-CPI growth rate issue has remained notable.  Doug Short, on his blog, has posted a few interesting charts illustrating this concept from a long-term historical viewpoint.  Both of the charts shown below are from his August 18, 2011 post titled "Profit Margin Squeeze Continues to Challenge the Economy."

First, here is a chart that shows the ratio, in the PPI, of Crude Goods to Finished Goods. The CPI is plotted below, in green.  This situation, as depicted, is problematical for firms, and the overall economy, on a number of fronts:


(click on chart images to enlarge)


-

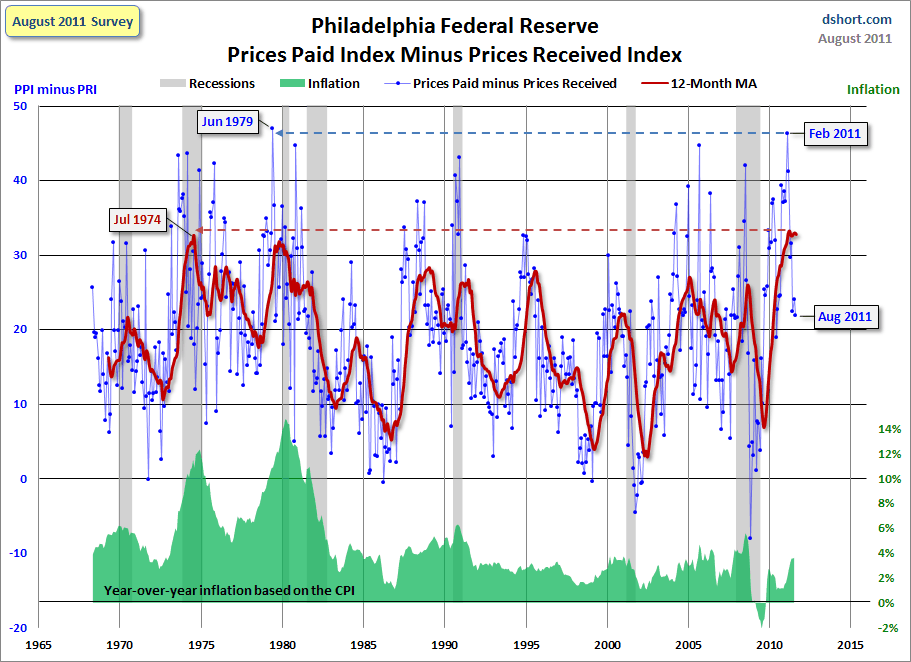
Second, a chart that shows data from the Philadelphia Federal Reserve regarding Prices Paid vs. Prices Received, with Inflation (CPI) and Recession periods also shown:


-

I believe that what this chart depicts is notable in a variety of ways.  As shown, we are experiencing a unique situation, and while the index level has recently subsided, we are near historical peaks for the 12-month MA as shown.

I believe this data and its implications for businesses and the economy at large is of great concern.  Seeing how this situation resolves will be very interesting.  This is especially so given the vulnerability of the U.S. Dollar to a substantial decline, a topic that I have written extensively about.
_____


The Special Note summarizes my overall thoughts about our economic situation


SPX at 1137.95 as this post is written

Thursday, August 18, 2011

Walmart's Q2 2012 Results - Comments


I found various notable items in Walmart’s Q2 conference call transcript (pdf) dated August 16, 2011.  I view Walmart’s results and comments as particularly noteworthy given their retail prominence and focus on low prices.  I have previously commented on their quarterly results; these previous posts are found under the "paycheck to paycheck" label.

Here are various excerpts that I find most notable:


comments from Mike Duke, from page 7:
I’ve recently observed several consumer focus groups, and it’s clear that many consumers are still struggling. They’re trading down to stretch their budgets, buying a lower priced brand of detergent, moving from branded canned goods to private label and purchasing half gallons of milk instead of gallons. That’s why we are laser-focused on investing in price to help our customers. There certainly are many reports on Walmart pricing, and the fact is that the gap has narrowed in some cases. We’re committed to widening the gap on price, and we have a specific plan and timetable to deliver EDLP to every customer.
comments from Bill Simon, p. 15:
The economy remains challenging for our core customers.  Customers are still consolidating trips due to higher year-over-year gas prices. The swings in sales due to paycheck cycles remain pronounced, and our stores must staff and stock for the volatility, both up and down. We also have seen an increase in the number of customers relying on government assistance for food and necessities for their family.
comments from Bill Simon, p. 15:
While we saw an increase in grocery inflation of approximately 3.5 percent during the quarter, customers remain under continued pressure and are trading down to lower price points and smaller pack sizes, as well as opting out of discretionary purchases. As a result, we’re seeing minimal pass-through of inflation to sales.
Food inflation has replaced gasoline price as the most important household expense concern. In addition, more than 15 percent of Walmart moms in our monthly survey have experienced the loss of a household wage earner’s job in the last year. Almost 40 percent of these Walmart moms indicated they’re holding off or eliminating items they would normally buy, reinforcing the need for us to drive every day low price. Moms of all income levels showed a drop in confidence over last the year, with middle income moms showing the greatest drop.
comments from Bill Simon, p. 19:
We still remain concerned about the increased economic pressure on our customers and the uncertain impact it will have on their shopping behavior. With the ongoing economic volatility, it’s as important as ever to deliver on our one-stop shopping promise – a broad assortment of merchandise backed with every day low price.
_____


The Special Note summarizes my overall thoughts about our economic situation


SPX at 1193.88 as this post is written

Tuesday, August 16, 2011

Financial Stocks - Update Concerning Poor "Price Action"


On June 29 I wrote a blog post titled "Financial Stocks - Notable Price Action."

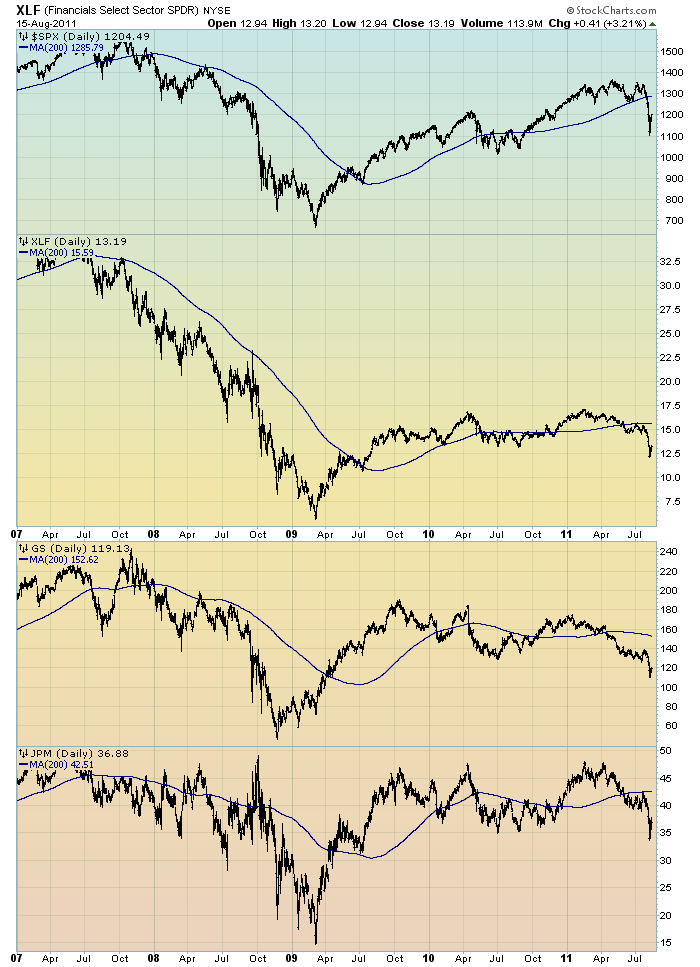
I continue to believe that the "price action" of various financial stocks is disconcerting.  I view the poor performance of these financial and brokerage stocks to be one indicator among (very) many that serves as a "red flag" as to the financial markets and economy as a whole.

Among these financial stocks, the continual decline and price movements of Goldman Sachs (GS) is particularly noteworthy and worrisome.

Here is an updated chart from that June 29 post.  It shows the XLF (the financial ETF) on a daily basis since 2007.  As well, the S&P500 is plotted above it, with GS and JPM shown below it.  The blue line on each indicates the 200dma:


(click on chart image to enlarge)(chart courtesy of StockCharts.com)


_____


The Special Note summarizes my overall thoughts about our economic situation


SPX at 1204.49 as this post is written
Monday, August 15, 2011

The Bond Bubble - Update


In previous posts I have discussed the Bond Bubble and its many facets.  In particular, I would like to highlight my post of October 4 2010, "Thoughts On The Bond Bubble."

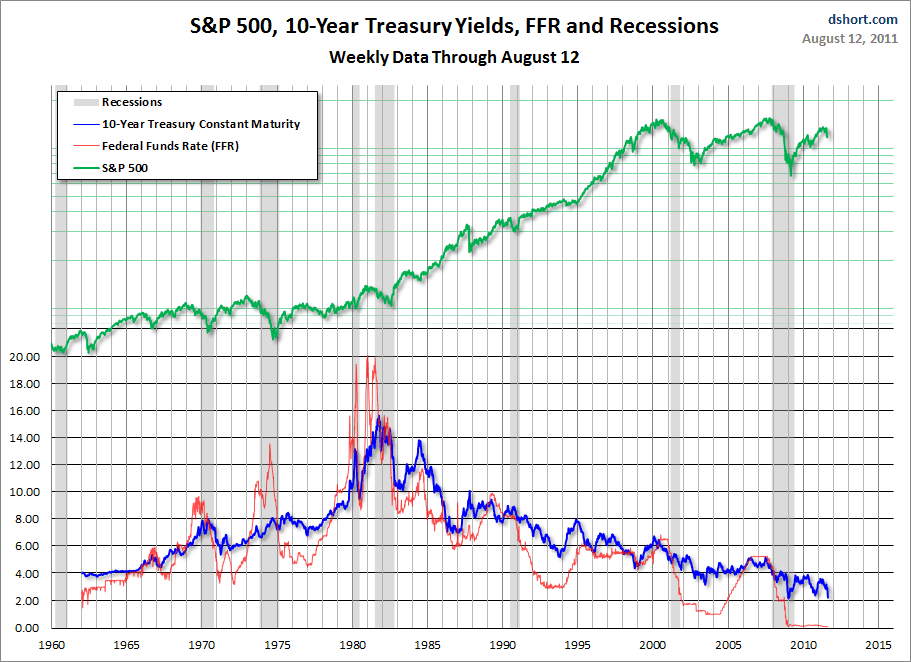
During the recent market tumult, bond yields have once again dropped sharply to very low levels, as seen by the yield on the 10-Year Treasury.  A couple of charts illustrate this.  First, a weekly long-term chart from 1962 as seen in Doug Short's August 12 blog post titled "Treasury Yields in Perspective", with 10-Year Treasury Yields shown in blue :

(click on chart to enlarge image)


-

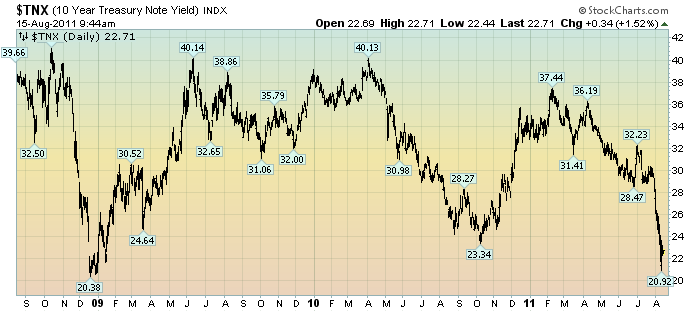
Next, a 3-year daily chart of the 10-Year Treasury Yield:

(click on chart to enlarge image)(chart courtesy of StockCharts.com)


-

While this Bond Bubble may have a little more "upside" left to it, I am of the belief that attempting to derive gains from bonds at this point is akin to "picking up pennies in front of a steamroller" - i.e. there is little to be gained, and much to be lost.

While the Bond Bubble continues, its risks to investors, financial markets and the economy in general has in no way diminished.
_____


The Special Note summarizes my overall thoughts about our economic situation


SPX at 1194.20 as this post is written
Friday, August 12, 2011

The August 2011 Wall Street Journal Economic Forecast Survey


The August Wall Street Journal Economic Forecast Survey was published August 12, 2011.  The headline is “Feeble Numbers Stir Recession Fears."

I found various aspects of the survey to be interesting, including the following excerpts:
The 46 economists in the survey—not all of whom answer every question—put the odds that the U.S. is already in another recession at 13%, while they peg the chances of going that way in the next year at 29%—up from 17% only a month ago.
Also, a question in the detail (spreadsheet) asked "Please grade the economic leadership in the following regions" - which generated universally poor marks from respondents.

Another question in the detail asked "If you were to go short on a currency over the next three years what would it be?"  The responses were the following:

Euro:  40%
U.S. Dollar:  17%
Yen:  11%
Swiss Franc:  11%
Yuan:  9%
Other:  11%

The current average forecasts among economists polled include the following:


GDP:
full-year 2011 : 1.6%
full-year 2012:  2.5%


Unemployment Rate:
December 2011: 9.0%
December 2012: 8.4%


10-Year Treasury Yield:
December 2011: 2.83%
December 2012: 3.54%


CPI:
December 2011:  2.9%
December 2012:  2.3%


Crude Oil  ($ per bbl):
for 12/31/2011: $86.18
for 12/31/2012: $88.89

(note: I comment upon this survey each month; commentary on past surveys can be found under the “Economic Forecasts” label)
_____

I post various economic forecasts because I believe they should be carefully monitored.  However, as those familiar with this blog are aware, I do not necessarily agree with many of the consensus estimates and much of the commentary in these forecast surveys.
_____


The Special Note summarizes my overall thoughts about our economic situation


SPX at 1172.64 as this post is written
Thursday, August 11, 2011

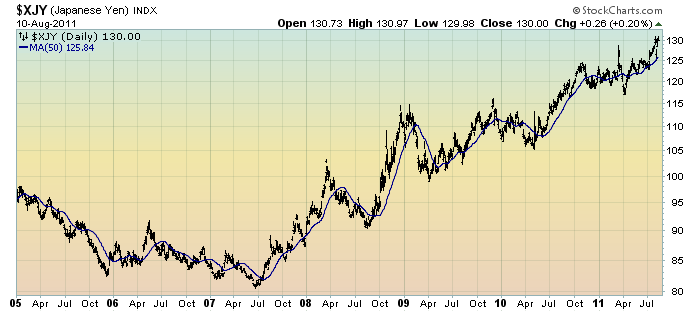
Thoughts On The Continually Climbing Japanese Yen


From time to time, most recently in the October 25 2010 post titled "Market Overview - Part II:  U.S. Dollar, Japanese Yen & Gold" I have commented upon the Japanese Yen.

Here is what I said then about the Yen, which I still believe to be the case today.  I have also included a chart below updated through yesterday:
Next, onto the Japanese Yen.  Up until 2-3 years ago, it was widely believed and (commented upon) that a rising Yen was a sign of danger.   This belief seems to have diminished; however, the strength of the Yen has not.  Is the rising Yen still a signal of danger in the markets?  I believe that it is.
Here is the daily chart since 2005 as depicted on a LOG scale.  The 50-day M.A. is shown in blue.  As one can see, there has been a continued string of strong uptrends, and the Yen pricing action is increasingly “parabolic” in nature:


_____


The Special Note summarizes my overall thoughts about our economic situation


SPX at 1120.76 as this post is written
Wednesday, August 10, 2011

A Look Back - The U.S. Credit Rating Debate In February 2010


With all of the recent attention given to the U.S. credit downgrade by S&P, I think it is interesting to look back at the debate on the topic in February 2010.

On February 11 2010, I wrote a blog post titled "Treasury Secretary Geithner's Comments" regarding an interview he gave that week, in which he talked about the U.S. credit rating as well as U.S. Treasuries and the Dollar functioning as "safe havens."

That post February 11 2010 post  is also very relevant in light of President Obama's August 8 comments on the same issues, which I highlighted in yesterday's post ("President Obama's August 8 Remarks - Notable Excerpts")
_____


The Special Note summarizes my overall thoughts about our economic situation


SPX at 1172.53 as this post is written

Tuesday, August 9, 2011

President Obama's August 8 Remarks - Notable Excerpts


Yesterday, President Obama delivered an address in large part concerning the credit downgrade and the economy. (The transcript is seen at WhiteHouse.gov titled "Remarks by the President")

Although I don't agree with many aspects of the speech, I found various parts of this speech to be notable.  Here are various facets that I found particularly noteworthy:
The markets, on the other hand, continue to believe our credit status is AAA.  In fact, Warren Buffett, who knows a thing or two about good investments, said, “If there were a quadruple-A rating, I’d give the United States that.”  I, and most of the world’s investors, agree.
also:
So all of this is a legitimate source of concern.  But here’s the good news:  Our problems are eminently solvable.*  And we know what we have to do to solve them.  With respect to debt, our problem is not confidence in our credit -- the markets continue to reaffirm our credit as among the world’s safest.  Our challenge is the need to tackle our deficits over the long term.
also:
What we need to do now is combine those spending cuts with two additional steps:  tax reform that will ask those who can afford it to pay their fair share and modest adjustments to health care programs like Medicare.
also:
Of course, as worrisome as the issues of debt and deficits may be, the most immediate concern of most Americans, and of concern to the marketplace as well, is the issue of jobs and the slow pace of recovery coming out of the worst recession in our lifetimes.
And the good news here is that by coming together to deal with the long-term debt challenge, we would have more room to implement key proposals that can get the economy to grow faster.  Specifically, we should extend the payroll tax cut as soon as possible, so that workers have more money in their paychecks next year and businesses have more customers next year.
We should continue to make sure that if you’re one of the millions of Americans who’s out there looking for a job, you can get the unemployment insurance that your tax dollars contributed to.  That will also put money in people’s pockets and more customers in stores.
also:
I know we’re going through a tough time right now.  We’ve been going through a tough time for the last two and a half years.  And I know a lot of people are worried about the future.  But here’s what I also know:  There will always be economic factors that we can’t control –- earthquakes, spikes in oil prices, slowdowns in other parts of the world.  But how we respond to those tests -- that’s entirely up to us. 
Markets will rise and fall, but this is the United States of America.  No matter what some agency may say, we’ve always been and always will be a AAA country.  For all of the challenges we face, we continue to have the best universities, some of the most productive workers, the most innovative companies, the most adventurous entrepreneurs on Earth.  What sets us apart is that we’ve always not just had the capacity, but also the will to act -- the determination to shape our future; the willingness in our democracy to work out our differences in a sensible way and to move forward, not just for this generation but for the next generation. 
And we’re going to need to summon that spirit today.  The American people have been through so much over the last few years, dealing with the worst recession, the biggest financial crisis since the 1930s, and they’ve done it with grace.  And they’re working so hard to raise their families, and all they ask is that we work just as hard, here in this town, to make their lives a little easier.  That’s not too much to ask.  And ultimately, the reason I am so hopeful about our future -- the reason I have faith in these United States of America -- is because of the American people.  It’s because of their perseverance, and their courage, and their willingness to shoulder the burdens we face -– together, as one nation.
_____


The Special Note summarizes my overall thoughts about our economic situation


SPX at 1132.34 as this post is written

QE3 - Various Thoughts


In the July 7 post ("Evaluating QE2") I mentioned that "...I believe that QE3 or something very similar will be done in the future."

There are many reasons for this belief.  Among the reasons for additional QE include the recent market tumult, visibly weakening economy, and various confidence measures that have nosedived.

My belief in further QE is an expectation, as opposed to an endorsement of the idea.  While my thoughts on the QE concept are complex, in my extensive writings on the subject I have indicated that I believe that Quantitative Easing carries substantial risks,  unintended consequences, and many complex impacts on the economy and markets.

However, QE3 would provide various markets - especially the stock market - with a significant boost.

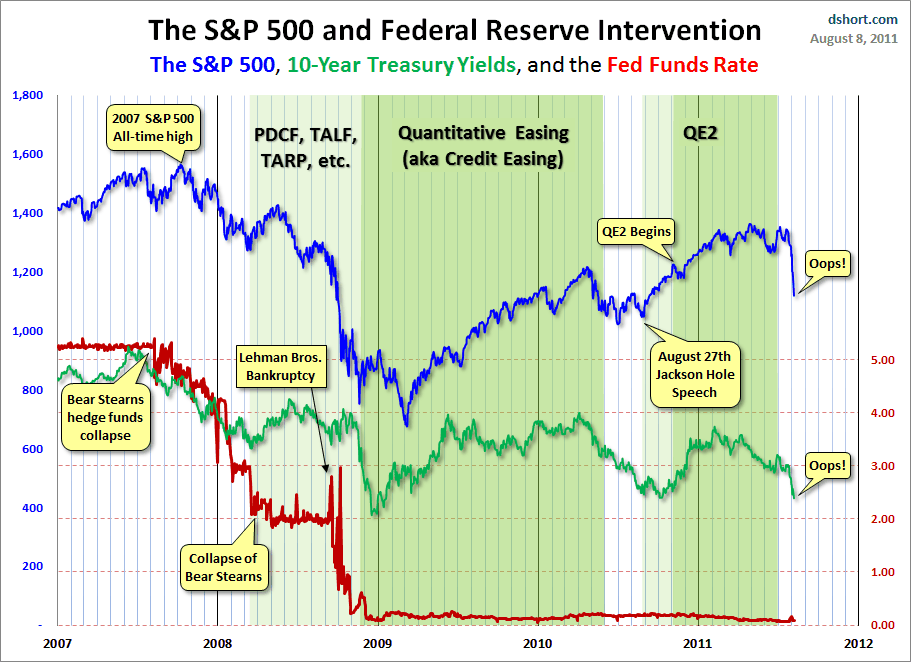
For reference purposes, here is a recent chart from Doug Short's blog post of August 5 ("Chart of the Day: Anticipating QE3") depicting the movements of the S&P500, 10-Year Treasury Yields and the Fed Funds rate over the periods of QE1 and QE2:


_____
The Special Note summarizes my overall thoughts about our economic situation


SPX at 1132.34 as this post is written
Monday, August 8, 2011

U.S. Dollar Decline – August 2011 Update


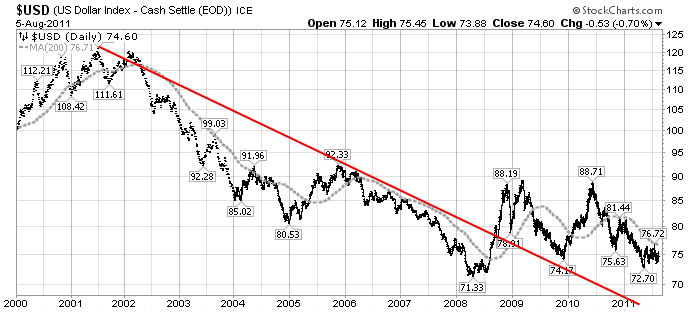
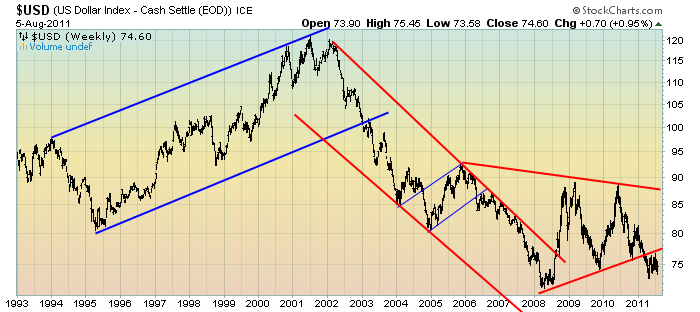
U.S. Dollar weakness is a foremost concern of mine.  As such, I have extensively written about it.  I am very concerned that the actions being taken to “improve” our economic situation will dramatically weaken the Dollar.  Should the Dollar substantially decline from here, as I expect, the negative consequences will far outweigh any benefits.  The negative impact of a substantial Dollar decline can’t be overstated, in my opinion.

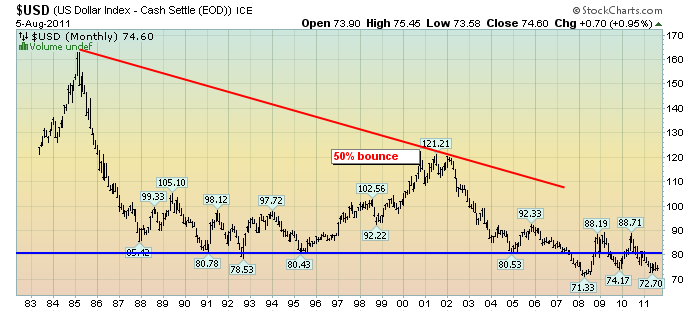
The following three charts illustrate various technical analysis aspects of the U.S. Dollar, as depicted by the U.S. Dollar Index.

First, a look at the monthly U.S. Dollar from 1983.  This clearly shows a long-term weakness, with the blue line showing technical support (until 2007):

(charts courtesy of StockCharts.com; annotations by the author)

(click on chart image to enlarge)


-

Next, another chart, this one focused on the daily U.S. Dollar since 2000 on a LOG scale.  The red line represents both a trendline as well as a relatively good visual “best-fit” line.  The gray dotted line is the 200-day M.A. (moving average).  As seen on this chart, the U.S. Dollar looks vulnerable to continuing its downward trend that has been interrupted since early 2008:


-

Lastly, a chart of the Dollar on a weekly LOG scale.  There are some clearly marked  channels here, with a large, prominent triangle featured.  Triangles are thought of as “continuation” patterns.  In this case, it would be a continuation of the Dollar downtrend since 2002:


-

I will be providing updates on this U.S. Dollar situation regularly as it deserves very close monitoring…
_____

The Special Note summarizes my overall thoughts about our economic situation


SPX at 1199.38 as this post is written
Saturday, August 6, 2011

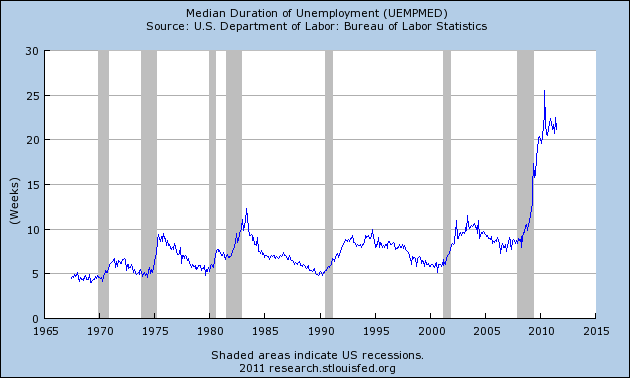
3 Critical Unemployment Charts – August 2011


As I have commented previously, as in the October 6, 2009 post, in my opinion the official methodologies used to measure the various job loss and unemployment statistics do not provide an accurate depiction; they serve to understate the severity of unemployment.

However, even if one chooses to look at the official statistics, the following charts provide an interesting (and disconcerting) long-term perspective of certain aspects of the officially-stated unemployment situation.

The first two charts are from the St. Louis Fed site.  Here is the Median Duration of Unemployment:

(click on charts to enlarge images)(charts updated as of 8-5-11)


-

Here is the chart for Unemployed 27 Weeks and Over:


-

Lastly, a chart from the CalculatedRisk.com site, from the August 5 post titled "July Unemployment Report."  This shows the employment situation vs. that of previous recessions, as shown:


-

As depicted by these charts, our unemployment problem is severe.  Unfortunately, there do not appear to be any “easy” solutions.

In July 2009 I wrote a series of five blog posts titled “Why Aren’t Companies Hiring?”, which discusses various aspects of the topic, many of which lack recognition.
_____

The Special Note summarizes my overall thoughts about our economic situation

SPX at 1199.38 as this post is written
Friday, August 5, 2011

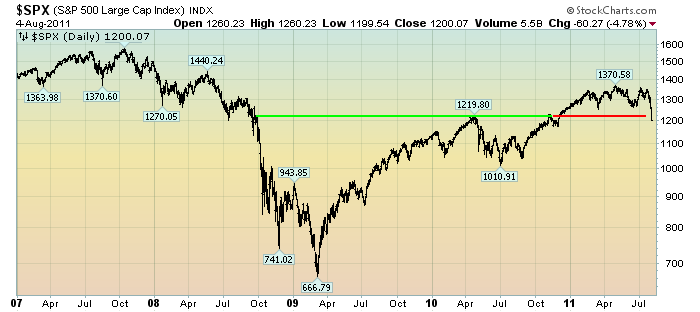
The Significance Of The 1220 Level On The S&P500


In the June 16 post ("The S&P500 Since 2007") I displayed an annotated chart of the S&P500.

In that post I stated the following:
As one can see from the chart, one interpretation that can be made is that of a (completed) “Cup & Handle” chart formation as denoted by the green line.  I have added a red line to now denote the 1220 area.  I think it would be significant if the S&P500 falls below this 1220 level now, as the 1220 level is technically significant in many different ways.
Here is that same chart updated through yesterday:

(chart courtesy of StockCharts.com; annotations by the author)

click on chart to enlarge


-

During yesterday's decline, the S&P500 failed to find support at this 1220 level, as seen on the chart.  This is very significant, and I don't believe that it bodes well for the stock market in the short-term.

My beliefs about the stock market's future direction are complex; I will elaborate in future posts...
_____

The Special Note summarizes my overall thoughts about our economic situation

SPX at 1200.07 as this post is written
Thursday, August 4, 2011

Recession Measures - Updated


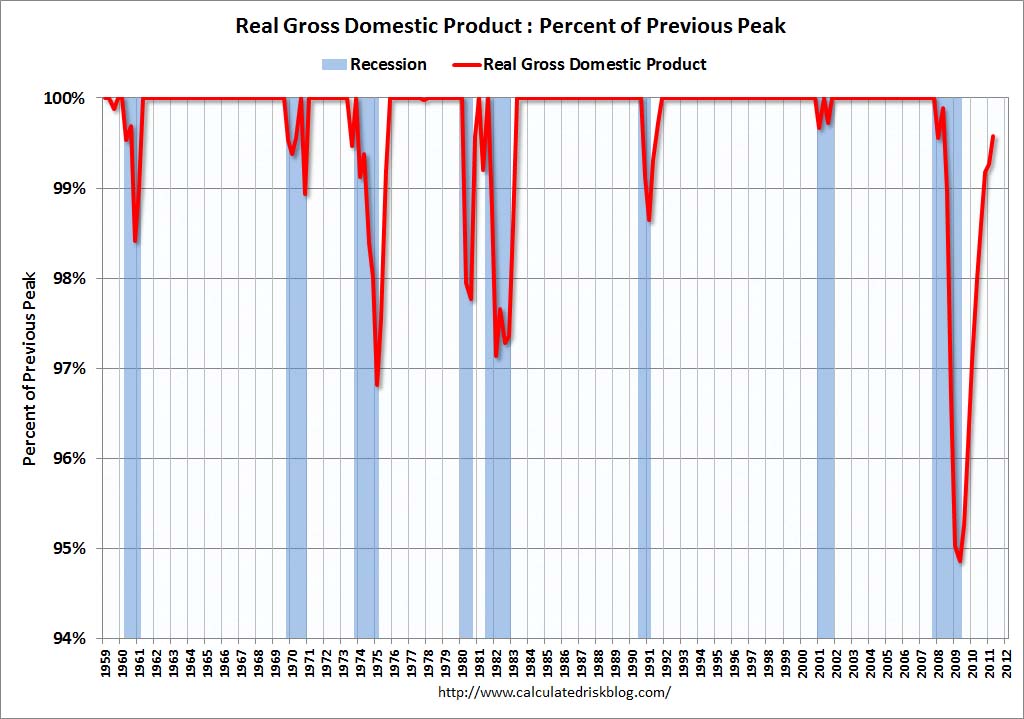
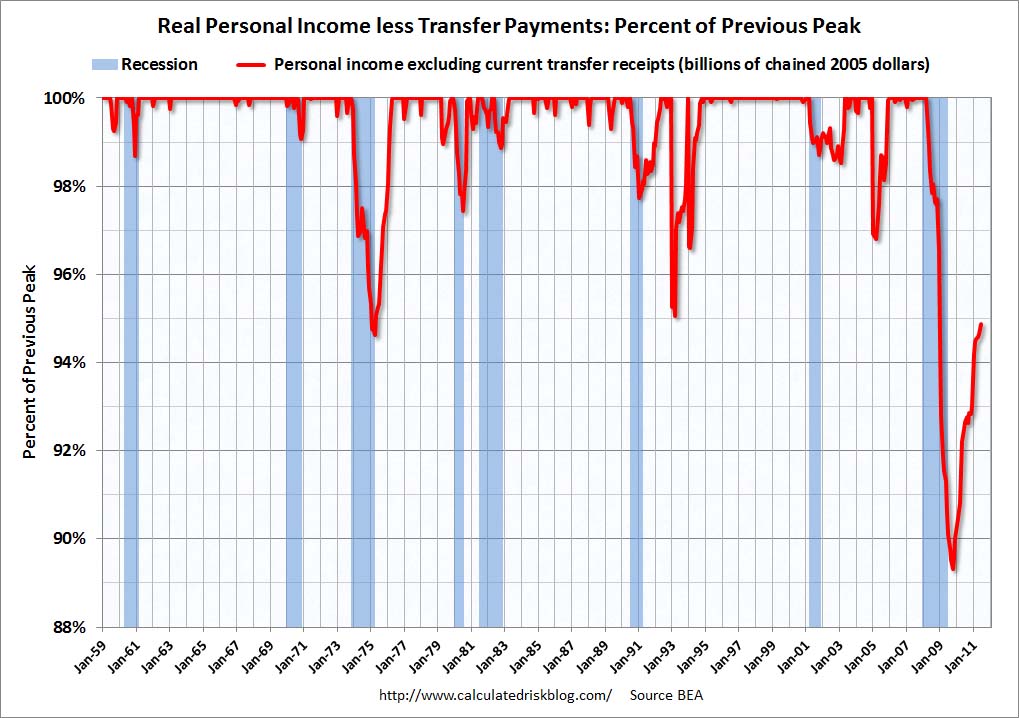
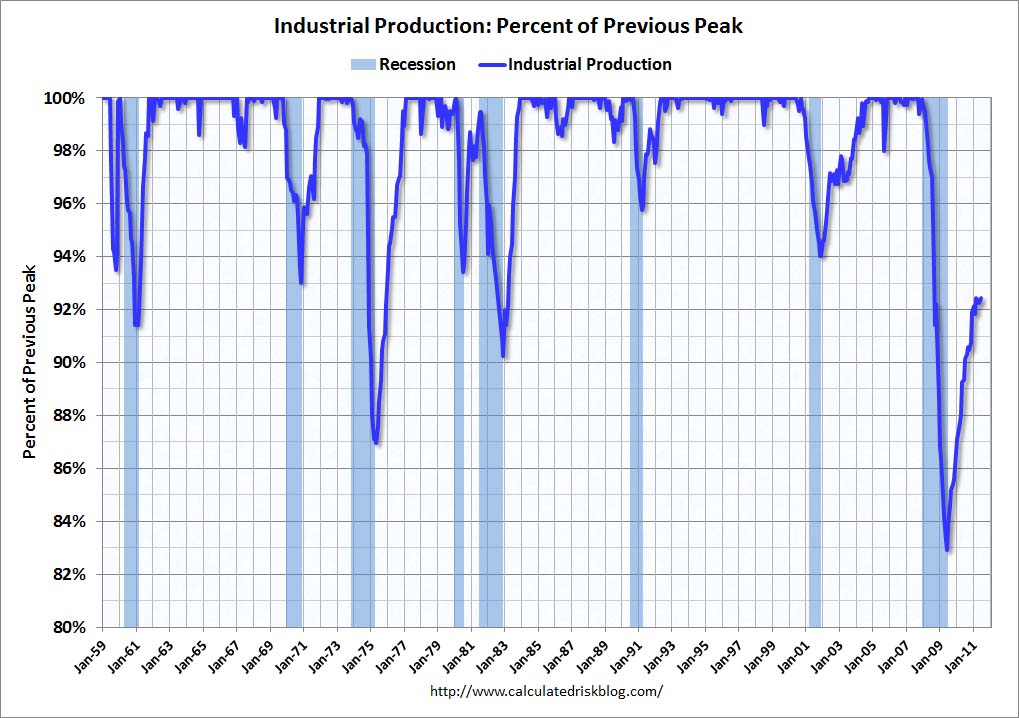
This post is the latest update to a series of blog posts seen on the CalculatedRisk.com blog.  The original blog post of April 12, 2010, is titled “Recession Measures.” In it, Bill discussed key measures that the NBER uses to determine recoveries, and posted four charts.

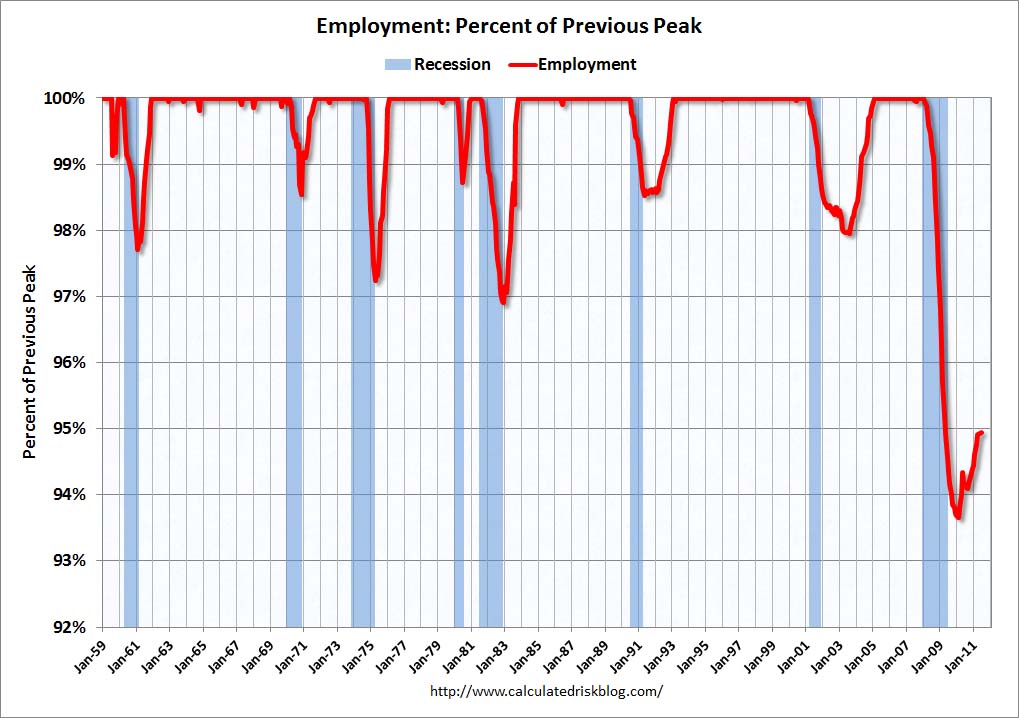
Here are those charts, updated in his August 2, 2011 post.  The charts are constructed in a fashion different than most – in a “percent of peak” fashion.  As defined, “The following graphs are all constructed as a percent of the peak in each indicator.  This shows when the indicator has bottomed – and when the indicator has returned to the level of the previous peak.  If the indicator is at a new peak, the value is 100%.”  Periods of recession, as defined by the NBER, are shown as blue bars.

Here are the four charts, updated through the dates shown: (click on images to enlarge)

Real Gross Domestic Product, now 0.4% below the pre-recession peak:


-

Real Personal Income Less Transfer Payments, still 5.1% below the pre-recession peak:


-

Industrial Production, still 7.6% below the pre-recession peak:


-

Payroll Employment, still below the pre-recession peak:


_____

The Special Note summarizes my overall thoughts about our economic situation

SPX at 1260.34 as this post is written
Tuesday, August 2, 2011

The Stock Market - Various Technical Analysis Aspects


The following chart is annotated by Ron Walker, ofthechartpatterntrader.com :


(click on chart to enlarge image)(chart courtesy of StockCharts.com)

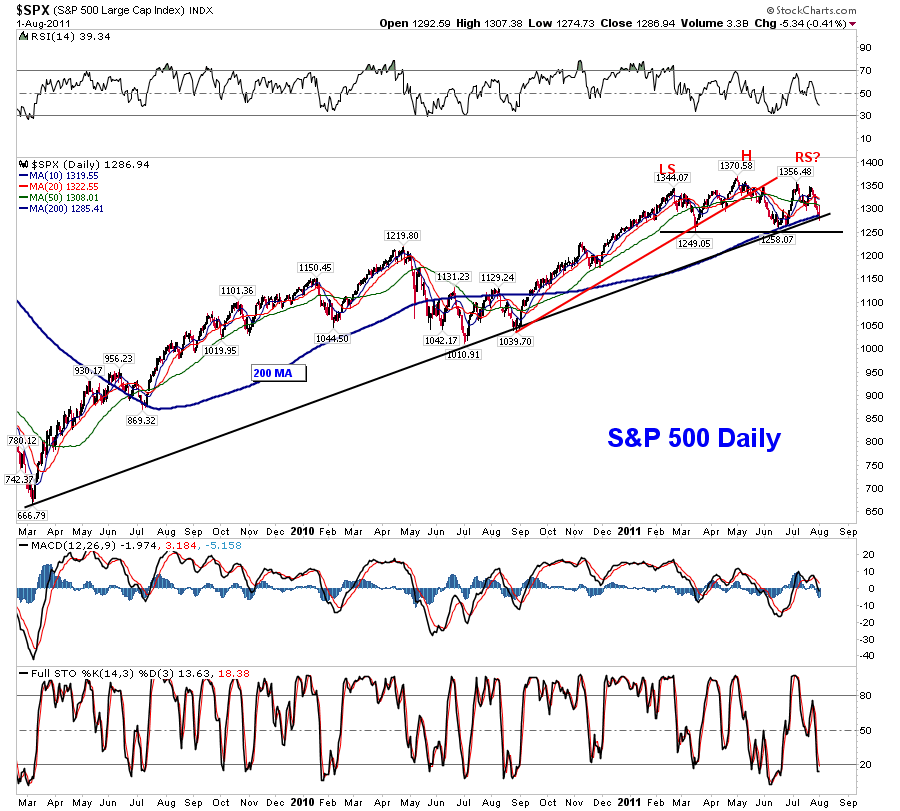
As one can see, it is a chart of the S&P500 on a daily basis since March of 2009.  Yesterday's closing price of the S&P500 (1286.94) is very near the black rising trendline from the March 2009 low.

Other aspects of the chart that I find notable is the slowing price momentum since the 1344.07 high, as annotated.  There is a possibility of a "Head & Shoulders" formation, as shown.
Furthermore, one can see that the 200dma (in blue) has served as technical support a number of times recently.

In my opinion, all of the above serve to illustrate that the stock market is at an important crossroads here from a Technical Analysis perspective.
_____

The Special Note summarizes my overall thoughts about our economic situation

SPX at 1286.94 as this post is written