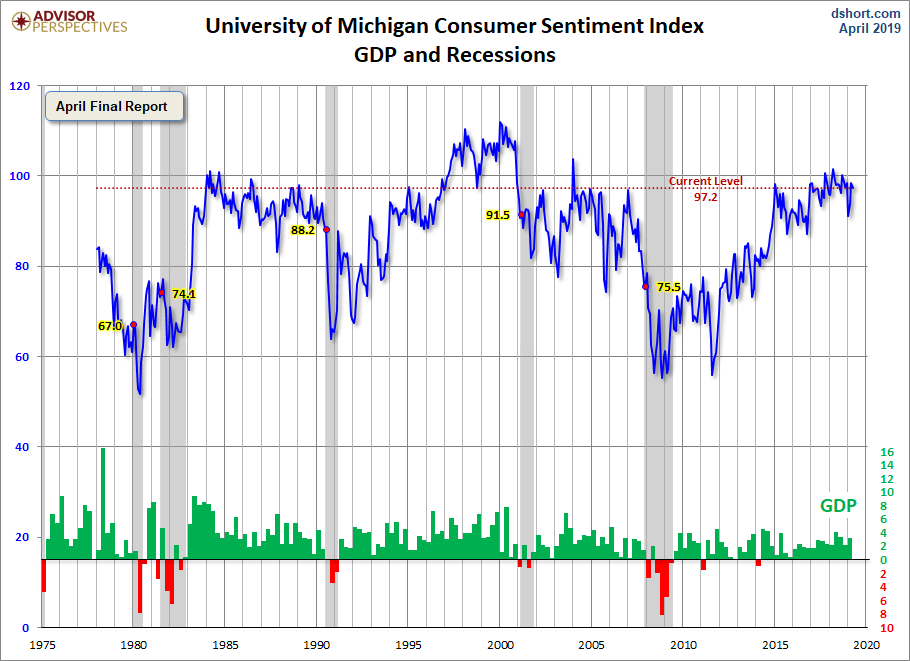
The Doug Short site had a post of April 30, 2019 (“Consumer Confidence Improved in April“) that displays the latest Conference Board Consumer Confidence and Thomson/Reuters University of Michigan Consumer Sentiment Index charts. They are presented below:
(click on charts to enlarge images)
–
There are a few aspects of the above charts that I find highly noteworthy. Of course, until the sudden upswing in 2014, the continued subdued absolute levels of these two surveys was disconcerting.
Also, I find the “behavior” of these readings to be quite disparate as compared to the other post-recession periods, as shown in the charts between the gray shaded areas (the gray areas denote recessions as defined by the NBER.)
While I don’t believe that confidence surveys should be overemphasized, I find these readings to be notable, especially in light of a variety of other highly disconcerting measures highlighted throughout this site.
_____
The Special Note summarizes my overall thoughts about our economic situation
The Employment Cost Index (ECI) is a quarterly measure of the change in the price of labor, defined as compensation per employee hour worked. Closely watched by many economists, the ECI is an indicator of cost pressures within companies that could lead to price inflation for finished goods and services. The index measures changes in the cost of compensation not only for wages and salaries, but also for an extensive list of benefits. As a fixed-weight, or Laspeyres, index, the ECI controls for changes occurring over time in the industrial-occupational composition of employment.
On April 30, 2019, the ECI for the first quarter was released. Here are two excerpts from the BLS release titled “Employment Cost Index – March 2019“:
Compensation costs for civilian workers increased 0.7 percent, seasonally adjusted, for the 3-month period ending in March 2019, the U.S. Bureau of Labor Statistics reported today. Wages and salaries (which make up about 70 percent of compensation costs) increased 0.7 percent and benefit costs (which make up the remaining 30 percent of compensation) also increased 0.7 percent from March 2018. (See tables A, 1, 2, and 3.)
also:
Compensation costs for civilian workers increased 2.8 percent for the 12-month period ending in March 2019 compared with a compensation costs increase of 2.7 percent in March 2018. Wages and salaries increased 2.9 percent for the 12-month period ending in March 2019 and increased 2.7 percent for the 12-month period ending in March 2018. Benefit costs increased 2.6 percent for the 12-month period ending in March 2019. In March 2018, the increase was also 2.6 percent. (See tables A, 4, 8, and 12.)
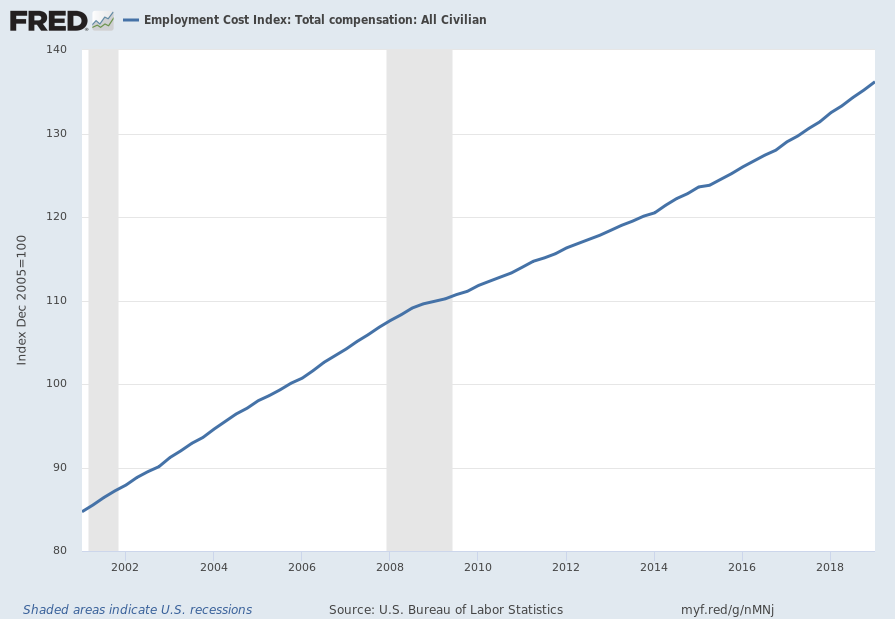
Below are three charts, updated on April 30, 2019 that depict various aspects of the ECI, which is seasonally adjusted (SA):
The first depicts the ECI, with a value of 136.2:
source: US. Bureau of Labor Statistics, Employment Cost Index: Total compensation: All Civilian[ECIALLCIV], retrieved from FRED, Federal Reserve Bank of St. Louis, accessed April 30, 2019: https://research.stlouisfed.org/fred2/series/ECIALLCIV/
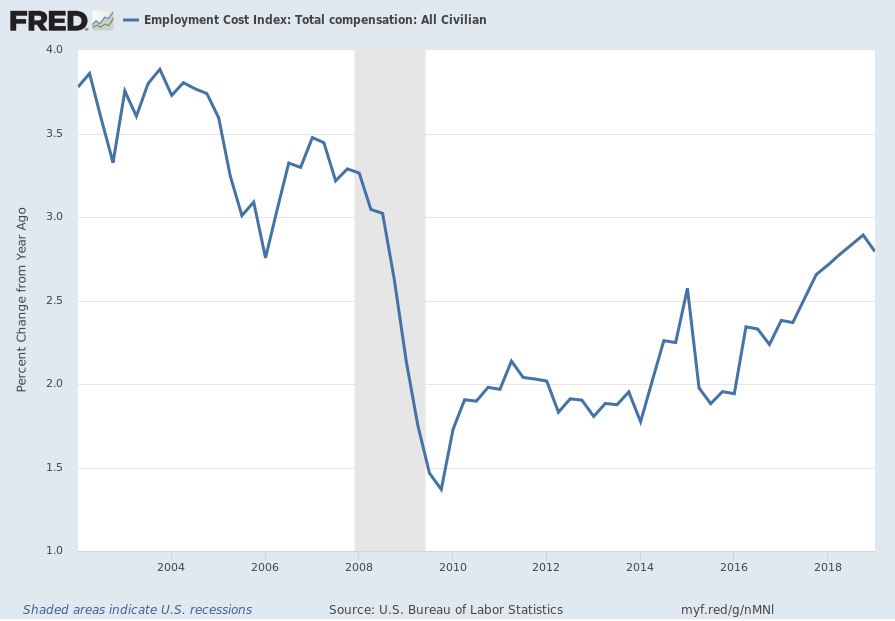
The second chart depicts the ECI on a “Percent Change from Year Ago” basis, with a value of 2.8%:
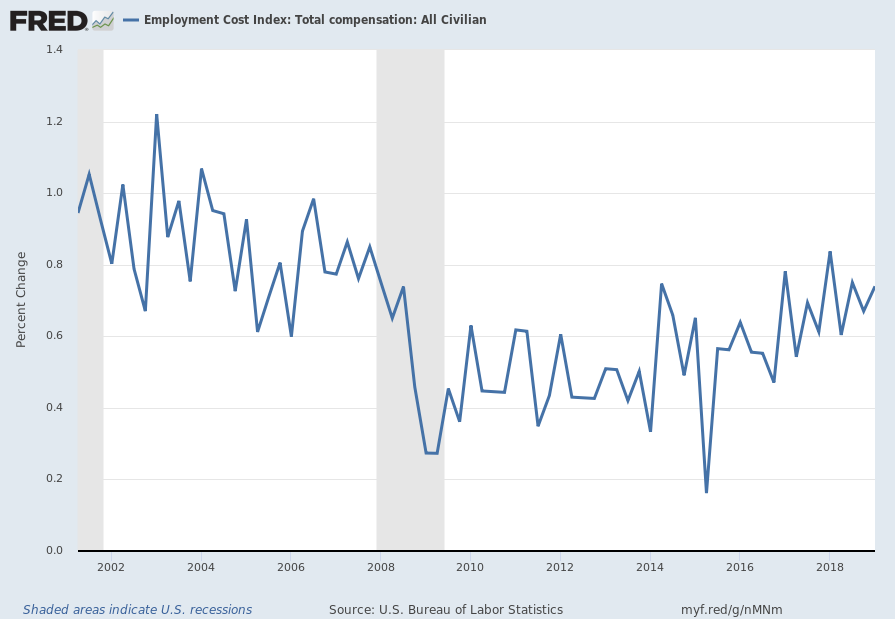
The third chart depicts the ECI on a “Percent Change” (from last quarter) basis, with a value of .7%:
_________
I post various indicators and indices because I believe they should be carefully monitored. However, as those familiar with this site are aware, I do not necessarily agree with what they depict or imply.
_____
The Special Note summarizes my overall thoughts about our economic situation
I post various indicators and indices because I believe they should be carefully monitored. However, as those familiar with this site are aware, I do not necessarily agree with what they depict or imply.
_____
The Special Note summarizes my overall thoughts about our economic situation
I post various indicators and indices because I believe they should be carefully monitored. However, as those familiar with this site are aware, I do not necessarily agree with what they depict or imply.
_____
The Special Note summarizes my overall thoughts about our economic situation
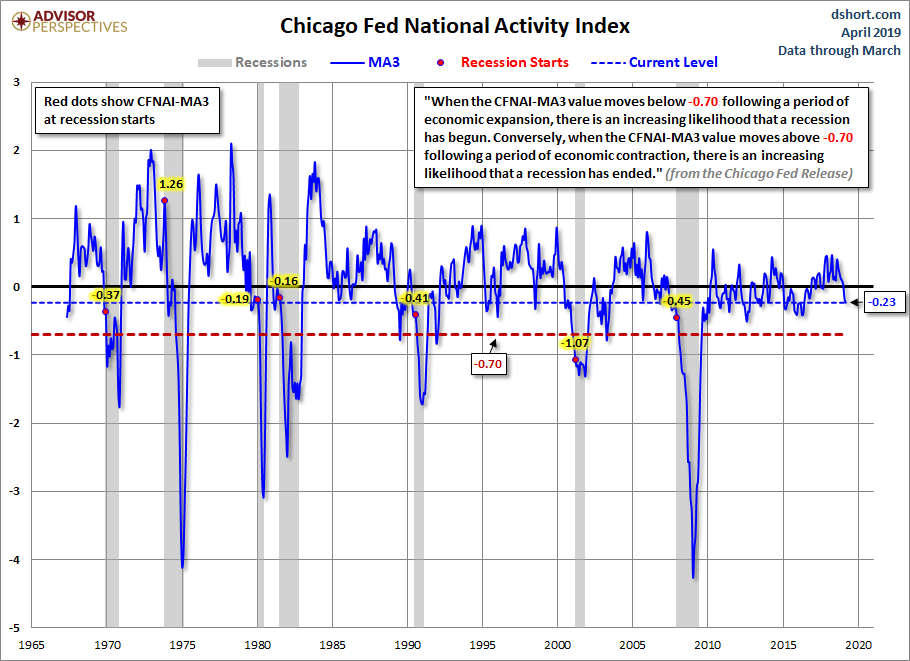
The Chicago Fed National Activity Index (CFNAI) and the Aruoba-Diebold-Scotti Business Conditions Index (ADS Index) are two broad-based economic indicators that I regularly feature in this site.
The short-term and long-term trends of each continue to be notable.
The post on the Doug Short site of April 25, 2019, titled “The Philly Fed ADS Index Business Conditions Index Update” displays both the CFNAI MA-3 (3-month Moving Average) and ADS Index (91-Day Moving Average) from a variety of perspectives.
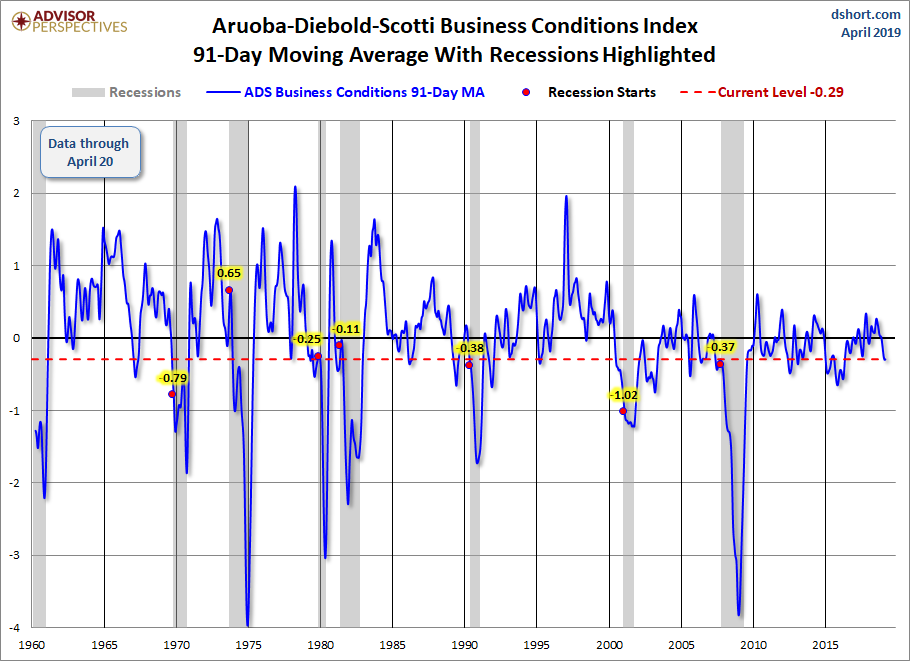
Of particular note, two of the charts, shown below, denote where the current levels of each reading is relative to the beginning of past recessionary periods, as depicted by the red dots.
The CFNAI MA-3:
(click on charts to enlarge images)
–
The ADS Index, 91-Day MA:
–
Also shown in the aforementioned post is a chart of each with a long-term trendline (linear regression) as well as a chart depicting GDP for comparison purposes.
_________
I post various indicators and indices because I believe they should be carefully monitored. However, as those familiar with this site are aware, I do not necessarily agree with what they depict or imply.
_____
The Special Note summarizes my overall thoughts about our economic situation
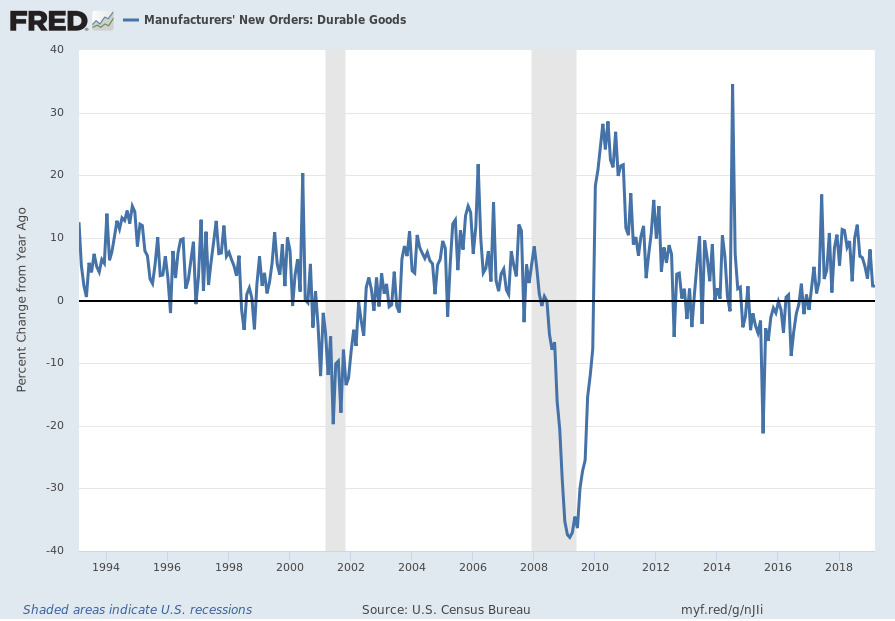
Many people place emphasis on Durable Goods New Orders as a prominent economic indicator and/or leading economic indicator.
For reference, below are two charts depicting this measure.
First, from the St. Louis Fed site (FRED), a chart through March 2019, updated on April 25, 2019. This value is $258,524 ($ Millions):
(click on charts to enlarge images)
–
Second, here is the chart depicting this measure on a “Percentage Change from a Year Ago” basis, with a last value of 2.3%:
Data Source: FRED, Federal Reserve Economic Data, Federal Reserve Bank of St. Louis: Manufacturers’ New Orders: Durable Goods [DGORDER]; U.S. Department of Commerce: Census Bureau; accessed April 25, 2019; http://research.stlouisfed.org/fred2/series/DGORDER
_________
I post various indicators and indices because I believe they should be carefully monitored. However, as those familiar with this site are aware, I do not necessarily agree with what they depict or imply.
_____
The Special Note summarizes my overall thoughts about our economic situation
The St. Louis Fed’s Financial Stress Index (STLFSI) is one index that is supposed to measure stress in the financial system. Its reading as of the April 18, 2019 update (reflecting data through April 12, 2019) is -1.311.
Of course, there are a variety of other measures and indices that are supposed to measure financial stress and other related issues, both from the Federal Reserve as well as from private sources.
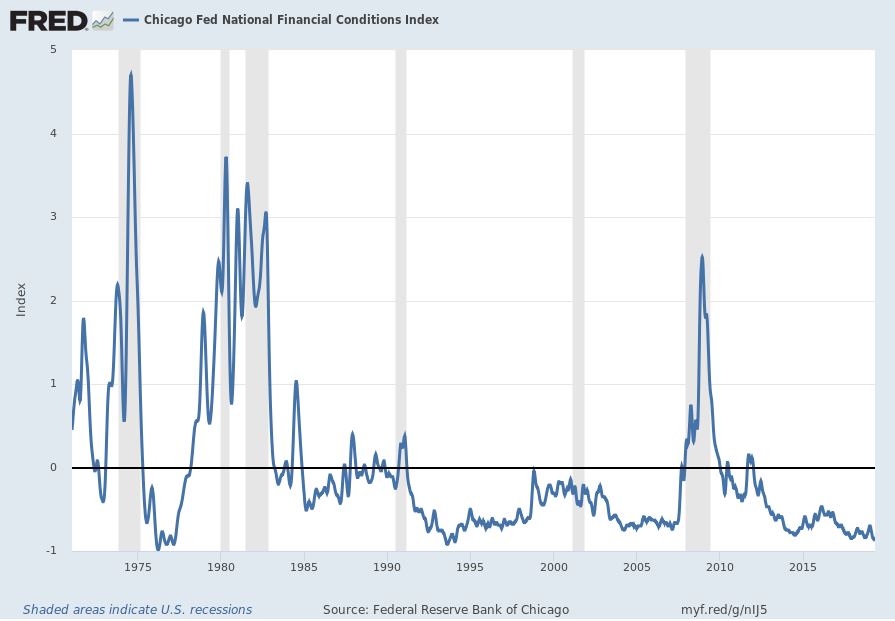
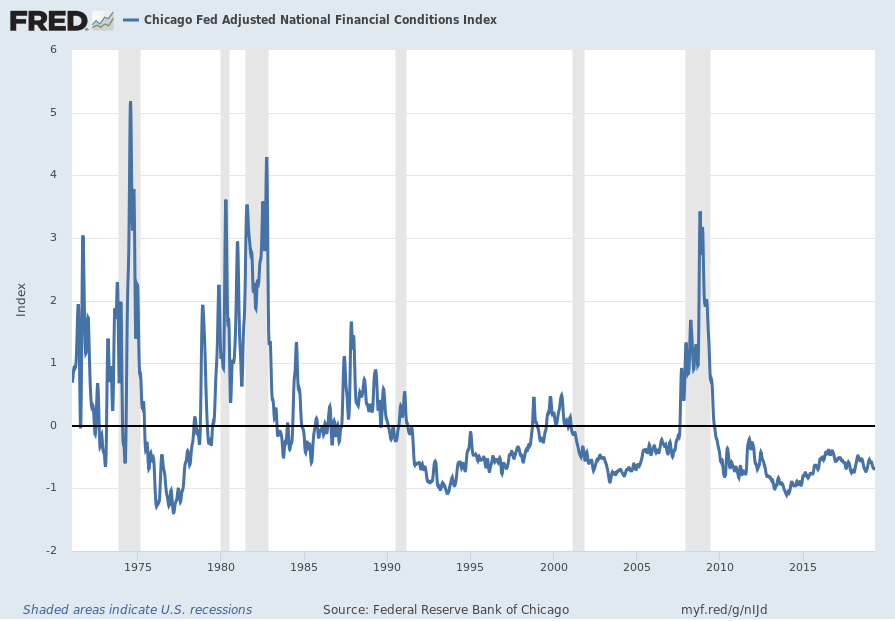
Two other indices that I regularly monitor include the Chicago Fed National Financial Conditions Index (NFCI) as well as the Chicago Fed Adjusted National Financial Conditions Index (ANFCI).
Here are summary descriptions of each, as seen in FRED:
The National Financial Conditions Index (NFCI) measures risk, liquidity and leverage in money markets and debt and equity markets as well as in the traditional and “shadow” banking systems. Positive values of the NFCI indicate financial conditions that are tighter than average, while negative values indicate financial conditions that are looser than average.
The adjusted NFCI (ANFCI). This index isolates a component of financial conditions uncorrelated with economic conditions to provide an update on how financial conditions compare with current economic conditions.
For further information, please visit the Federal Reserve Bank of Chicago’s web site:
Below are the most recently updated charts of the NFCI and ANFCI, respectively.
The NFCI chart below was last updated on April 24, 2019 incorporating data from January 8, 1971 through April 19, 2019, on a weekly basis. The April 19 value is -.88:
The ANFCI chart below was last updated on April 24, 2019 incorporating data from January 8, 1971 through April 19, 2019, on a weekly basis. The April 19 value is -.69:
I post various indicators and indices because I believe they should be carefully monitored. However, as those familiar with this site are aware, I do not necessarily agree with what they depict or imply.
_____
The Special Note summarizes my overall thoughts about our economic situation
For reference purposes, below are two sets of charts depicting growth in the money supply.
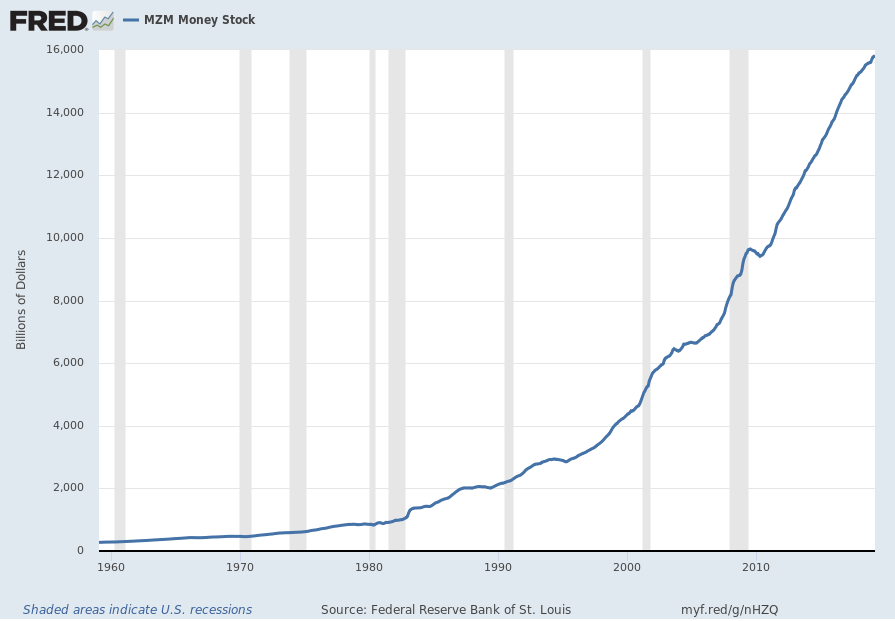
The first shows the MZM (Money Zero Maturity), defined in FRED as the following:
M2 less small-denomination time deposits plus institutional money funds. Money Zero Maturity is calculated by the Federal Reserve Bank of St. Louis.
Here is the “MZM Money Stock” (seasonally adjusted) chart, updated on April 19, 2019 depicting data through March 2019, with a value of $15,827.8 Billion:
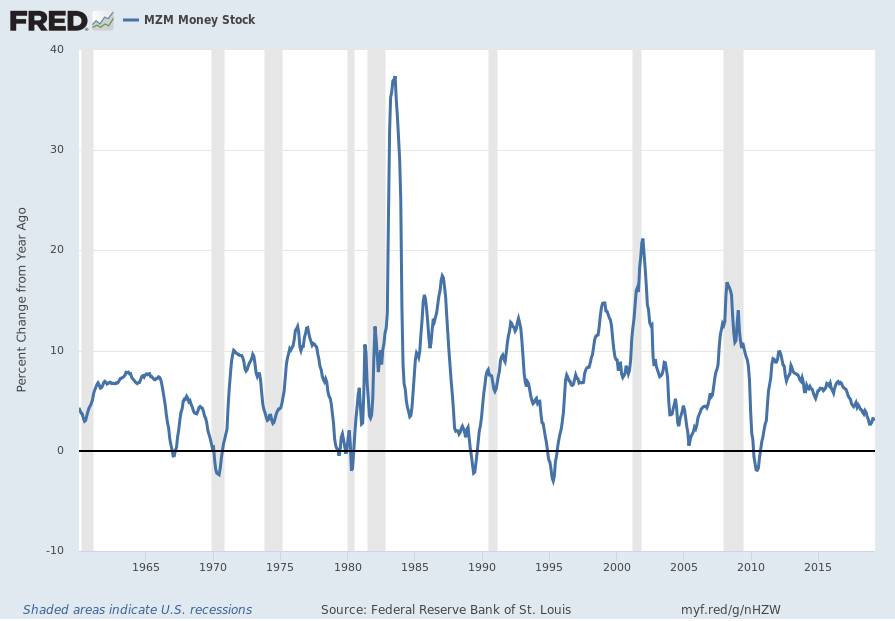
Here is the “MZM Money Stock” chart on a “Percent Change From Year Ago” basis, with a current value of 3.1%:
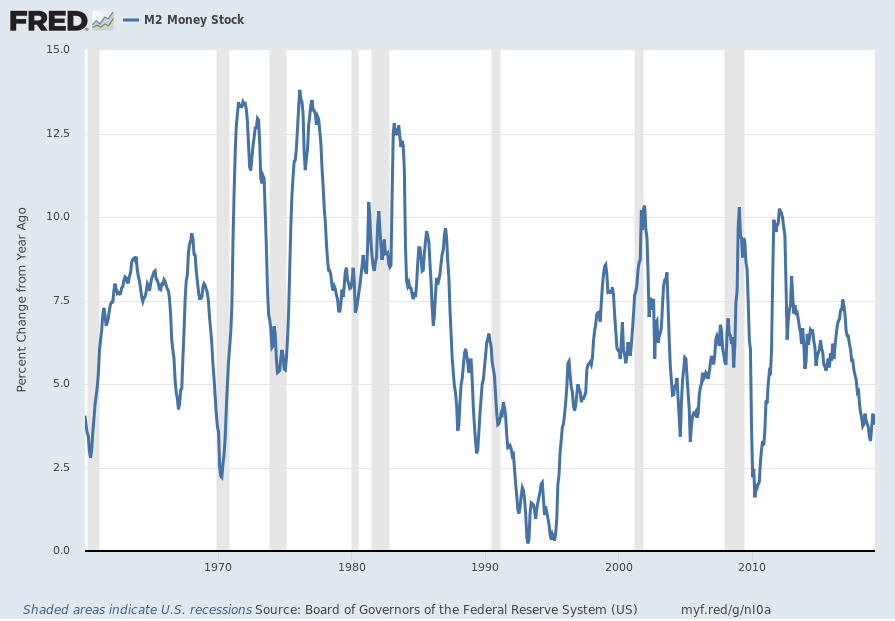
The second set shows M2, defined in FRED as the following:
M2 includes a broader set of financial assets held principally by households. M2 consists of M1 plus: (1) savings deposits (which include money market deposit accounts, or MMDAs); (2) small-denomination time deposits (time deposits in amounts of less than $100,000); and (3) balances in retail money market mutual funds (MMMFs). Seasonally adjusted M2 is computed by summing savings deposits, small-denomination time deposits, and retail MMMFs, each seasonally adjusted separately, and adding this result to seasonally adjusted M1.
Here is the “M2 Money Stock” (seasonally adjusted) chart, updated on April 18, 2019, depicting data through March 2019, with a value of $14,468.2 Billion:
Here is the “M2 Money Stock” chart on a “Percent Change From Year Ago” basis, with a current value of 3.8%:
Perhaps the main reason that I write of our economic situation is that I continue to believe, based upon various analyses, that our economic situation is in many ways misunderstood. While no one likes to contemplate a future rife with economic adversity, current and future economic problems must be properly recognized and rectified if high-quality, sustainable long-term economic vitality is to be realized.
There are an array of indications and other “warning signs” – many readily apparent – that current economic activity and financial market performance is accompanied by exceedingly perilous dynamics.
I have written extensively about this peril, including in the following:
My analyses continues to indicate that the growing level of financial danger will lead to the next stock market crash that will also involve (as seen in 2008) various other markets as well. Key attributes of this next crash is its outsized magnitude (when viewed from an ultra-long term historical perspective) and the resulting economic impact. This next financial crash is of tremendous concern, as my analyses indicate it will lead to a Super Depression – i.e. an economy characterized by deeply embedded, highly complex, and difficult-to-solve problems.
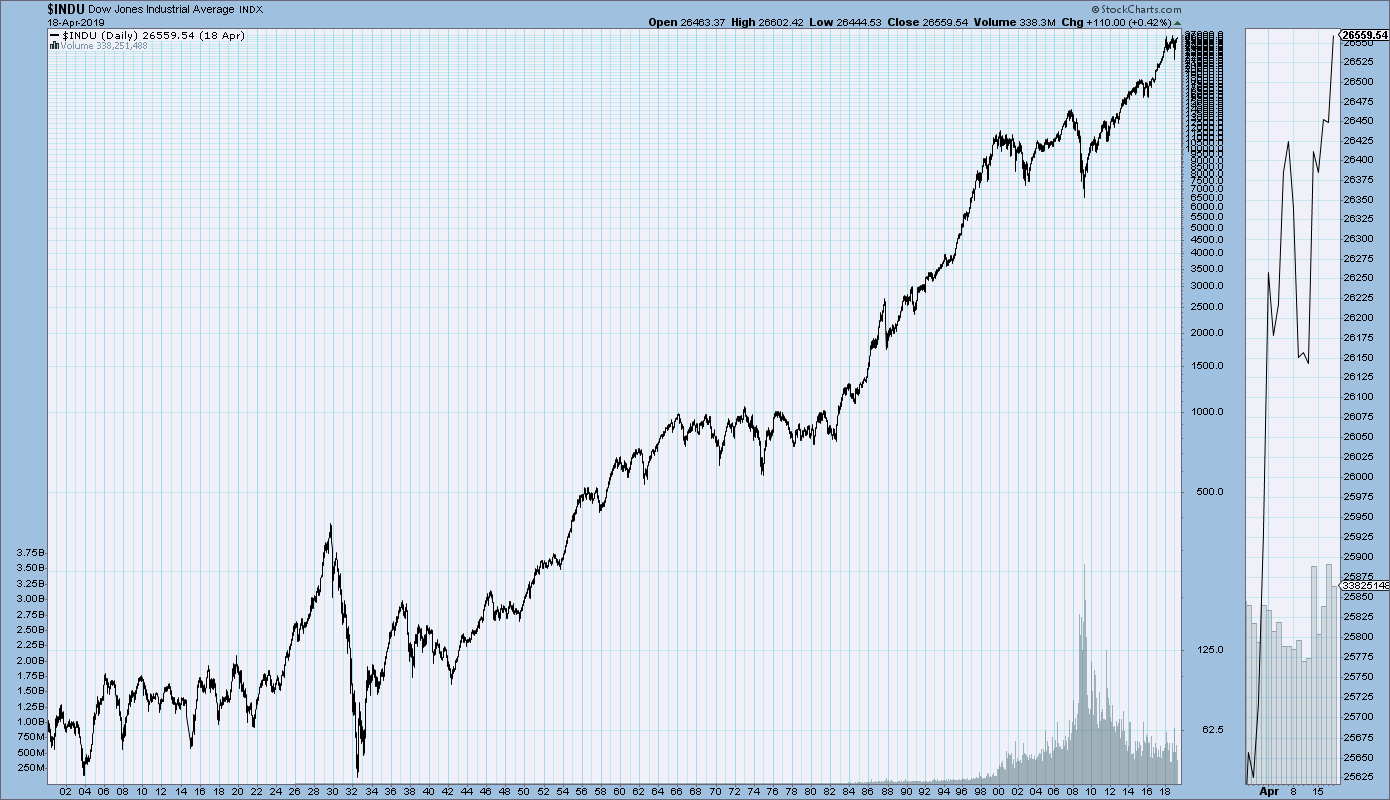
For long-term reference purposes, here is a chart of the Dow Jones Industrial Average since 1900, depicted on a monthly basis using a LOG scale (updated through April 18, 2019, with a last value of 26559.54):
For long-term reference purposes, here is a chart of the Dow Jones Industrial Average since 1900, depicted on a monthly basis using a LOG scale (updated through April 18, 2019, with a last value of 26559.54):
(click on chart to enlarge image)(chart courtesy of StockCharts.com)
_____
The Special Note summarizes my overall thoughts about our economic situation
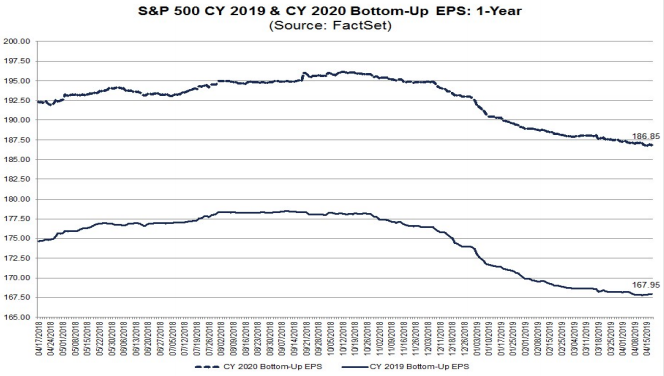
FactSet publishes a report titled “Earnings Insight” that contains a variety of information including the trends and expectations of S&P500 earnings.
For reference purposes, here are two charts as seen in the “Earnings Insight” (pdf) report of April 18, 2019:
from page 20:
(click on charts to enlarge images)
–
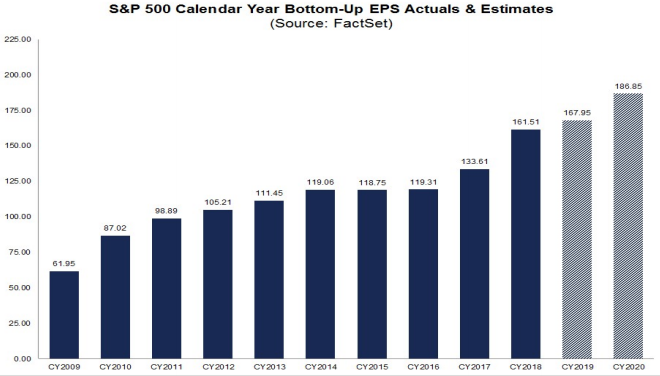
from page 21:
_____
I post various economic forecasts because I believe they should be carefully monitored. However, as those familiar with this site are aware, I do not agree with many of the consensus estimates and much of the commentary in these forecast surveys.
_____
The Special Note summarizes my overall thoughts about our economic situation
As many are aware, Refinitiv publishes earnings estimates for the S&P500. (My other posts concerning S&P earnings estimates can be found under the S&P500 Earnings label)
The following estimates are from Exhibit 24 of the “S&P500 Earnings Scorecard” (pdf) of April 22, 2019, and represent an aggregation of individual S&P500 component “bottom up” analyst forecasts. For reference, the Year 2014 value is $118.78/share; the Year 2015 value is $117.46; the Year 2016 value is $118.10/share; the Year 2017 value is $132.00/share; and the Year 2018 value is $161.93:
Year 2019 estimate:
$167.05/share
Year 2020 estimate:
$186.88/share
Year 2021 estimate:
$205.25/share
_____
I post various economic forecasts because I believe they should be carefully monitored. However, as those familiar with this site are aware, I do not agree with many of the consensus estimates and much of the commentary in these forecast surveys.
_____
The Special Note summarizes my overall thoughts about our economic situation
As many are aware, Standard & Poor’s publishes earnings estimates for the S&P500. (My posts concerning their estimates can be found under the S&P500 Earnings label)
For reference purposes, the most current estimates are reflected below, and are as of April 18, 2019:
Year 2019 estimates add to the following:
-From a “bottom up” perspective, operating earnings of $165.02/share
-From a “top down” perspective, operating earnings of N/A
-From a “bottom up” perspective, “as reported” earnings of $149.61/share
Year 2020 estimates add to the following:
-From a “bottom up” perspective, operating earnings of $185.65/share
-From a “top down” perspective, operating earnings of N/A
-From a “bottom up” perspective, “as reported” earnings of $168.40/share
_____
I post various economic forecasts because I believe they should be carefully monitored. However, as those familiar with this site are aware, I do not agree with many of the consensus estimates and much of the commentary in these forecast surveys.
_____
The Special Note summarizes my overall thoughts about our economic situation