Friday, June 30, 2017

June 2017 Duke/CFO Global Business Outlook Survey – Notable Excerpts

On June 13, 2017 the June Duke/CFO Global Business Outlook was released.  It contains a variety of statistics regarding how CFOs view business and economic conditions.

In this CFO survey, I found the following to be the most notable excerpts – although I don’t necessarily agree with them:
Uncertainty about regulatory policy and health care costs is causing chief financial officers in the United States to hold back investment plans, a new survey finds.
also:
The survey has been conducted for 85 consecutive quarters and spans the globe, making it the world's longest-running and most comprehensive research on senior finance executives. This quarter, nearly 750 CFOs responded to the survey, which ended June 9. Results are for the U.S. unless stated otherwise.
Almost 40 percent of CFOs indicated uncertainty is currently higher than normal. Among those companies, about 60 percent said that uncertainty has caused them to delay new projects and investments.
also:
The Optimism Index fell slightly this quarter to 67 on a 100-point scale. That's two points lower than last quarter but still far above the long-run average of 60.
"CFOs remain optimistic not only about the overall economy but about their own firms too," Graham said. "Our analysis of past results shows the CFO Optimism Index is an excellent predictor of the future, especially hiring plans and overall GDP growth."
Hiring plans are stronger than one year ago and U.S. companies expect to pay higher wages, with median wage growth of about 3 percent over the next 12 months, even greater in the construction and tech industries.
The CFO survey contains two Optimism Index charts, with the bottom chart showing U.S. Optimism (with regard to the economy) at 67, as seen below:

Duke CFO Survey Optimism chart


It should be interesting to see how well the CFOs predict business and economic conditions going forward.   I discussed past various aspects of this, and the importance of these predictions, in the July 9, 2010 post titled “The Business Environment”.

(past posts on CEO and CFO surveys can be found under the “CFO and CEO Confidence” tag)
_____

I post various economic forecasts because I believe they should be carefully monitored.  However, as those familiar with this site are aware, I do not necessarily agree with many of the consensus estimates and much of the commentary in these forecast surveys.
_____

The Special Note summarizes my overall thoughts about our economic situation

SPX at 2428.11 as this post is written

Consumer Confidence Surveys – As Of June 30, 2017

Doug Short had a blog post of June 30, 2017 (“Michigan Consumer Sentiment:  June Final Slips, But Still Optimistic“) in which he presents the latest Conference Board Consumer Confidence and Thomson/Reuters University of Michigan Consumer Sentiment Index charts.  They are presented below:

(click on charts to enlarge images)

Conference Board Consumer Confidence


Michigan Consumer Sentiment

There are a few aspects of the above charts that I find highly noteworthy.  Of course, until the sudden upswing in 2014, the continued subdued absolute levels of these two surveys was disconcerting.

Also, I find the “behavior” of these readings to be quite disparate as compared to the other post-recession periods, as shown in the charts between the gray shaded areas (the gray areas denote recessions as defined by the NBER.)

While I don’t believe that confidence surveys should be overemphasized, I find these readings to be very problematical, especially in light of a variety of other highly disconcerting measures highlighted throughout this site.
_____

The Special Note summarizes my overall thoughts about our economic situation

SPX at 2427.45 as this post is written

Wednesday, June 28, 2017

Chicago Fed National Financial Conditions Index (NFCI)

The St. Louis Fed’s Financial Stress Index (STLFSI) is one index that is supposed to measure stress in the financial system.  Its reading as of the June 22, 2017 update (reflecting data through June 16, 2017) is -1.565.

Of course, there are a variety of other measures and indices that are supposed to measure financial stress and other related issues, both from the Federal Reserve as well as from private sources.

Two other indices that I regularly monitor include the Chicago Fed National Financial Conditions Index (NFCI) as well as the Chicago Fed Adjusted National Financial Conditions Index (ANFCI).

Here are summary descriptions of each, as seen in FRED:
The National Financial Conditions Index (NFCI) measures risk, liquidity and leverage in money markets and debt and equity markets as well as in the traditional and “shadow” banking systems. Positive values of the NFCI indicate financial conditions that are tighter than average, while negative values indicate financial conditions that are looser than average. 
The adjusted NFCI (ANFCI). This index isolates a component of financial conditions uncorrelated with economic conditions to provide an update on how financial conditions compare with current economic conditions.
For further information, please visit the Federal Reserve Bank of Chicago’s web site:
http://www.chicagofed.org/webpages/publications/nfci/index.cfm
Below are the most recently updated charts of the NFCI and ANFCI, respectively.

The NFCI chart below was last updated on June 28, 2017 incorporating data from January 5,1973 through June 23, 2017, on a weekly basis.  The June 23, 2017 value is -.89:

NFCI_6-28-17_-.89

Data Source: FRED, Federal Reserve Economic Data, Federal Reserve Bank of St. Louis; accessed June 28, 2017:

http://research.stlouisfed.org/fred2/series/NFCI


The ANFCI chart below was last updated on June 28, 2017 incorporating data from January 5,1973 through June 23, 2017, on a weekly basis.  The June 23 value is -.36:

ANFCI_6-28-17 -.36

Data Source: FRED, Federal Reserve Economic Data, Federal Reserve Bank of St. Louis; accessed June 28, 2017:

http://research.stlouisfed.org/fred2/series/ANFCI

_________

I post various indicators and indices because I believe they should be carefully monitored.  However, as those familiar with this site are aware, I do not necessarily agree with what they depict or imply.
_____

The Special Note summarizes my overall thoughts about our economic situation

SPX at 2440.69 as this post is written

The Yield Curve – June 28, 2017

Many people believe that the Yield Curve is an important economic indicator.

On March 1, 2010, I wrote a post on the issue, titled “The Yield Curve As A Leading Economic Indicator.”

An excerpt from that post:
On the NY Fed link above, they have posted numerous studies that support the theory that the yield curve is a leading indicator.   My objections with using it as a leading indicator, especially now, are various.  These objections include: I don’t think such a narrow measure is one that can be relied upon;  both the yields at the short and long-end of the curve have been overtly and officially manipulated, thus distorting the curve; and, although the yield curve may have been an accurate leading indicator in the past, this period of economic weakness is inherently dissimilar in nature from past recessions and depressions in a multitude of ways – thus, historical yardsticks and metrics probably won’t (and have not) proven appropriate.
While I continue to have the above-stated reservations regarding the “yield curve” as an indicator, I do believe that it should be monitored.

As an indication of the yield curve, below is a weekly chart from January 1, 1990 through June 27, 2017.  The top two plots show the 10-Year Treasury and 2-Year Treasury yields.  The third plot shows the (yield) spread between the 10-Year Treasury and 2-Year Treasury, with the June 27, 2017 closing value of .83%.  The bottom plot shows the S&P500:

(click on chart to enlarge image)(chart courtesy of StockCharts.com; chart creation and annotation by the author)

U.S. Yield Curve with components

Additionally, below is a chart showing the same spread between the 10-Year Treasury and 2-Year Treasury, albeit with a slightly different measurement, using constant maturity securities.  This daily chart is from June 1, 1976 through June 26, 2017, with recessionary periods shown in gray. This chart shows a value of .78%:

U.S. Yield Curve proxy

source:  Federal Reserve Bank of St. Louis, 10-Year Treasury Constant Maturity Minus 2-Year Treasury Constant Maturity [T10Y2Y], retrieved from FRED, Federal Reserve Bank of St. Louis; accessed June 28, 2017:

https://research.stlouisfed.org/fred2/series/T10Y2Y
_____

The Special Note summarizes my overall thoughts about our economic situation

SPX at 2419.38 as this post is written

Monday, June 26, 2017

Durable Goods New Orders – Long-Term Charts Through May 2017

Many people place emphasis on Durable Goods New Orders as a prominent economic indicator and/or leading economic indicator.

For reference, below are two charts depicting this measure.

First, from the St. Louis Fed site (FRED), a chart through May 2017, updated on June 26, 2017. This value is $228,180 ($ Millions):

(click on charts to enlarge images)

DGORDER_6-26-17


Second, here is the chart depicting this measure on a “Percentage Change from a Year Ago” basis:

DGORDER percent change from year ago

Data Source: FRED, Federal Reserve Economic Data, Federal Reserve Bank of St. Louis: Manufacturers’ New Orders:  Durable Goods [DGORDER]; U.S. Department of Commerce: Census Bureau; accessed June 26, 2017;

http://research.stlouisfed.org/fred2/series/DGORDER
_________

I post various indicators and indices because I believe they should be carefully monitored.  However, as those familiar with this site are aware, I do not necessarily agree with what they depict or imply.
_____

The Special Note summarizes my overall thoughts about our economic situation

SPX at 2439.66 as this post is written

Updates Of Economic Indicators June 2017

Here is an update of various indicators that are supposed to predict and/or depict economic activity. These indicators have been discussed in previous blog posts:

The June 2017 Chicago Fed National Activity Index (CFNAI) updated as of June 26, 2017:
The CFNAI, with current reading of -.26:

CFNAI_6-26-17

Federal Reserve Bank of Chicago, Chicago Fed National Activity Index [CFNAI], retrieved from FRED, Federal Reserve Bank of St. Louis, June 26, 2017;

https://fred.stlouisfed.org/series/CFNAI

The CFNAI-MA3, with current reading of .04:

CFNAI-MA3_6-26-17

Federal Reserve Bank of Chicago, Chicago Fed National Activity Index: Three Month Moving Average [CFNAIMA3], retrieved from FRED, Federal Reserve Bank of St. Louis, June 26, 2017;

https://fred.stlouisfed.org/series/CFNAIMA3


The ECRI WLI (Weekly Leading Index):

As of June 23, 2017 (incorporating data through June 16, 2017) the WLI was at 143.7 and the WLI, Gr. was at 3.4%.

A chart of the WLI,Gr., from Doug Short’s ECRI update post of June 23, 2017:

ECRI WLI,Gr.


The Aruoba-Diebold-Scotti Business Conditions (ADS) Index:

Here is the latest chart, depicting the ADS Index from December 31, 2007 through June 17, 2017:

ADS Index


The Conference Board Leading (LEI), Coincident (CEI) Economic Indexes, and Lagging Economic Indicator (LAG):

As per the June 22, 2017 press release, titled “The Conference Board Leading Economic Index (LEI) for the U.S. Increased in May” (pdf) the LEI was at 127.0, the CEI was at 115.3, and the LAG was 124.2 in May.

An excerpt from the release:
“The U.S. LEI continued on its upward trend in May, suggesting the economy is likely to remain on, or perhaps even moderately above, its long-term trend of about 2 percent growth for the remainder of the year,” said Ataman Ozyildirim, Director of Business Cycles and Growth Research at The Conference Board. “The improvement was widespread among the majority of the leading indicators except for housing permits, which declined again. And, the average workweek in manufacturing has recently shown no sign of improvement.”
Here is a chart of the LEI from Doug Short’s Conference Board Leading Economic Index update of June 22, 2017:

Conference Board LEI

_________

I post various indicators and indices because I believe they should be carefully monitored.  However, as those familiar with this site are aware, I do not necessarily agree with what they depict or imply.
_____

The Special Note summarizes my overall thoughts about our economic situation

SPX at 2439.97 as this post is written

The U.S. Economic Situation – June 26, 2017 Update

Perhaps the main reason that I write of our economic situation is that I continue to believe, based upon various analyses, that our economic situation is in many ways misunderstood.  While no one likes to contemplate a future rife with economic adversity, current and future economic problems must be properly recognized and rectified if high-quality, sustainable long-term economic vitality is to be realized.
There are an array of indications and other “warning signs” – many readily apparent – that current economic activity and financial market performance is accompanied by exceedingly perilous dynamics.
I have written extensively about this peril, including in the following:
Building Financial Danger” (ongoing updates)
My analyses continues to indicate that the growing level of financial danger will lead to the next stock market crash that will also involve (as seen in 2008) various other markets as well.  Key attributes of this next crash is its outsized magnitude (when viewed from an ultra-long term historical perspective) and the resulting economic impact.  This next financial crash is of tremendous concern, as my analyses indicate it will lead to a Super Depression – i.e. an economy characterized by deeply embedded, highly complex, and difficult-to-solve problems.
For long-term reference purposes, here is a chart of the Dow Jones Industrial Average since 1900, depicted on a monthly basis using a LOG scale (updated through June 23, 2017, with a last value of 21394.76):

(click on chart to enlarge image)(chart courtesy of StockCharts.com)

DJIA since 1900

_____

The Special Note summarizes my overall thoughts about our economic situation

SPX at 2438.30 as this post is written


Thursday, June 22, 2017

Deloitte “CFO Signals” Report Q2 2017 – Notable Aspects

Recently Deloitte released their “CFO Signals” “High-Level Summary” report for the 2nd Quarter of 2017.

As seen in page 2 of the report, there were 132 survey respondents.  As stated:  “Each quarter (since 2Q10), CFO Signals has tracked the thinking and actions of CFOs representing many of North America’s largest and most influential companies.

All respondents are CFOs from the US, Canada, and Mexico, and the vast majority are from companies with more than $1 billion in annual revenue. For a summary of this quarter’s response demographics, please see the sidebars and charts on this page. For other information about participation and methodology, please contact nacfosurvey@deloitte.com."

Here are some of the excerpts that I found notable:

from page 3:

Perceptions

How do you regard the current/future status of the North American, Chinese, and European economies? Perceptions of North America declined slightly, with 65% of CFOs rating current conditions as good (near the four-year high) and 58% expecting better conditions in a year. Perceptions of Europe improved to 17% and 30%, while China rose strongly to 28% and 32%. Page 6.

What is your perception of the capital markets? Eighty-five percent of CFOs say debt financing is attractive (up from 81% last quarter), while attractiveness of equity financing held steady for public company CFOs (at 42%) and rose for private company CFOs (from 38% to 46%). Seventy-eight percent of CFOs now say US equities are overvalued—just below last quarter’s survey high. Page 7.

Expectations

What is your company’s business focus for the next year? CFOs indicate a strong bias toward revenue growth over cost reduction (63% vs. 18%), and investing cash over returning it (62% vs. 16%). They shifted back to a bias toward existing offerings over new ones (46% vs. 32%), and again increased their bias toward current geographies over new ones (72% vs. 14%). Page 10.

Compared to the past 12 months, how do you expect your key operating metrics to change over the next 12 months? Revenue growth expectations rose from 4.3% to 5.6% and are above their two-year average. Earnings growth rose to 8.7%, up from 7.3% and well above the two-year average. Capital spending growth, which skyrocketed last quarter, slipped from 10.5% to a still high 9.0%. Domestic hiring growth held steady at 2.1%. Page 11.

from page 9:

Sentiment

Coming off a survey high last quarter, own-company optimism remains strong on very high optimism in the US and Mexico; Manufacturing and Services are high, and Energy/Resources rebounded.

This quarter’s net optimism declined from last quarter’s survey-high +50 to a still-high +44. Nearly 55% of CFOs expressed rising optimism (down from 60%), and 11% cited declining optimism (up from 10%).

Net optimism for the US declined from last quarter’s +58 to +47 this quarter. Canada fell from +40 to +20, while optimism in Mexico bounced back very strongly from -71 to +50.

Manufacturing and Services are again above +50, while Energy/Resources rose significantly to +47. Technology and Financial Services declined significantly, but both are still strong by historical standards. T/M/E is negative, but the sample size is very low this quarter.

Please see the full-detail report for charts specific to individual industries and countries.

from page 11:

Expectations

Key growth metrics remain relatively strong, bolstered by Canada and Mexico; the outlook for Energy/Resources and Healthcare/Pharma improved significantly.

Revenue growth expectations rose from 4.3% to 5.6% and are above their two-year average. US expectations continued to rise. Canada rose to a five-year high and Mexico bounced back from a two-year low. Energy/Resources rose to its survey high, and Healthcare/Pharma bounced back from last quarter’s survey low.

Earnings growth expectations are up to 8.7% from last quarter’s 7.3% and hit a twoyear high. All geographies improved significantly. Manufacturing is at its highest level in two years; Healthcare/Pharma bounced back strongly from last quarter’s three-year low.

Capital investment growth expectations fell to 9.0% from 10.5%, but still sit at their secondhighest level in five years. Canada and Mexico nearly doubled, but US expectations fell. Energy/Resources is again near its survey high. Healthcare/Pharma and Services are both up sharply; Technology declined significantly.

Domestic hiring growth held steady at 2.1%.  Canada bounced back from last quarter, and the US declined slightly. Healthcare/Pharma is highest of the industries, with Manufacturing the lowest (despite sitting near its two-year high).


Among the various charts and graphics in the report are graphics depicting trends in “Own Company Optimism” on page 9 and “Economic Optimism” found on page 6.
_____

I post various business and economic surveys because I believe they should be carefully monitored.  However, as those familiar with this site are aware, I do not necessarily agree with many of the consensus estimates and much of the commentary in these surveys.

_____

The Special Note summarizes my overall thoughts about our economic situation

SPX at 2435.61 as this post is written

Wednesday, June 21, 2017

Chicago Fed National Financial Conditions Index (NFCI)

The St. Louis Fed’s Financial Stress Index (STLFSI) is one index that is supposed to measure stress in the financial system.  Its reading as of the June 15, 2017 update (reflecting data through June 9, 2017) is -1.589.

Of course, there are a variety of other measures and indices that are supposed to measure financial stress and other related issues, both from the Federal Reserve as well as from private sources.

Two other indices that I regularly monitor include the Chicago Fed National Financial Conditions Index (NFCI) as well as the Chicago Fed Adjusted National Financial Conditions Index (ANFCI).

Here are summary descriptions of each, as seen in FRED:
The National Financial Conditions Index (NFCI) measures risk, liquidity and leverage in money markets and debt and equity markets as well as in the traditional and “shadow” banking systems. Positive values of the NFCI indicate financial conditions that are tighter than average, while negative values indicate financial conditions that are looser than average.
The adjusted NFCI (ANFCI). This index isolates a component of financial conditions uncorrelated with economic conditions to provide an update on how financial conditions compare with current economic conditions.
For further information, please visit the Federal Reserve Bank of Chicago’s web site:
http://www.chicagofed.org/webpages/publications/nfci/index.cfm
Below are the most recently updated charts of the NFCI and ANFCI, respectively.

The NFCI chart below was last updated on June 21, 2017 incorporating data from January 5,1973 through June 16, 2017, on a weekly basis.  The June 16, 2017 value is -.89:

NFCI

Data Source: FRED, Federal Reserve Economic Data, Federal Reserve Bank of St. Louis; accessed June 21, 2017:

http://research.stlouisfed.org/fred2/series/NFCI


The ANFCI chart below was last updated on June 21, 2017 incorporating data from January 5,1973 through June 16, 2017, on a weekly basis.  The June 16 value is -.38:

ANFCI

Data Source: FRED, Federal Reserve Economic Data, Federal Reserve Bank of St. Louis; accessed June 21, 2017:

http://research.stlouisfed.org/fred2/series/ANFCI
_________

I post various indicators and indices because I believe they should be carefully monitored.  However, as those familiar with this site are aware, I do not necessarily agree with what they depict or imply.
_____

The Special Note summarizes my overall thoughts about our economic situation

SPX at 2437.39 as this post is written

Money Supply Charts Through May 2017

For reference purposes, below are two sets of charts depicting growth in the money supply.

The first shows the MZM (Money Zero Maturity), defined in FRED as the following:
M2 less small-denomination time deposits plus institutional money funds.
Money Zero Maturity is calculated by the Federal Reserve Bank of St. Louis.
Here is the “MZM Money Stock” (seasonally adjusted) chart, updated on June 16, 2017 depicting data through May 2017, with a value of $14,892.7 Billion:

MZMSL_6-16-17

Here is the “MZM Money Stock” chart on a “Percent Change From Year Ago” basis, with a current value of 5.1%:

MZMSL percent change from a year ago

Data Source: FRED, Federal Reserve Economic Data, Federal Reserve Bank of St. Louis; accessed June 21, 2017:

https://research.stlouisfed.org/fred2/series/MZMSL

The second set shows M2, defined in FRED as the following:
M2 includes a broader set of financial assets held principally by households. M2 consists of M1 plus: (1) savings deposits (which include money market deposit accounts, or MMDAs); (2) small-denomination time deposits (time deposits in amounts of less than $100,000); and (3) balances in retail money market mutual funds (MMMFs). Seasonally adjusted M2 is computed by summing savings deposits, small-denomination time deposits, and retail MMMFs, each seasonally adjusted separately, and adding this result to seasonally adjusted M1.
Here is the “M2 Money Stock” (seasonally adjusted) chart, updated on June 15, 2017, depicting data through May 2017, with a value of $13,495.5 Billion:

M2SL

Here is the “M2 Money Stock” chart on a “Percent Change From Year Ago” basis, with a current value of 5.9%:

M2SL percent change from year ago

Data Source: FRED, Federal Reserve Economic Data, Federal Reserve Bank of St. Louis; accessed June 21, 2017:

https://research.stlouisfed.org/fred2/series/M2SL
_____

The Special Note summarizes my overall thoughts about our economic situation

SPX at 2437.43 as this post is written

Tuesday, June 20, 2017

Trends Of S&P500 Earnings Forecasts

S&P500 earnings trends and estimates are a notably important topic, for a variety of reasons, at this point in time.

FactSet publishes a report titled “Earnings Insight” that contains a variety of information including the trends and expectations of S&P500 earnings.

For reference purposes, here are two charts as seen in the “Earnings Insight” (pdf) report of June 16, 2017:

from page 23:

(click on charts to enlarge images)

S&P500 EPS forecast trends


from page 24:

S&P500 annual EPS

_____

I post various economic forecasts because I believe they should be carefully monitored.  However, as those familiar with this site are aware, I do not agree with many of the consensus estimates and much of the commentary in these forecast surveys.
_____

The Special Note summarizes my overall thoughts about our economic situation

SPX at 2453.44 as this post is written

Monday, June 19, 2017

S&P500 EPS Forecasts For 2017 - 2019

As many are aware, Thomson Reuters publishes earnings estimates for the S&P500.  (My other posts concerning S&P earnings estimates can be found under the S&P500 Earnings label)

The following estimates are from Exhibit 20 of the “S&P500 Earnings Scorecard” (pdf) of June 9, 2017, and represent an aggregation of individual S&P500 component “bottom up” analyst forecasts.  For reference, the Year 2014 value is $118.78/share, the Year 2015 value is $117.46, and the Year 2016 value is $118.10/share:

Year 2017 estimate:

$131.55/share

Year 2018 estimate:

$147.09/share

Year 2019 estimate:

$161.16/share
_____

I post various economic forecasts because I believe they should be carefully monitored.  However, as those familiar with this site are aware, I do not agree with many of the consensus estimates and much of the commentary in these forecast surveys.
_____

The Special Note summarizes my overall thoughts about our economic situation

SPX at 2453.46 as this post is written

Standard & Poor’s S&P500 Earnings Estimates For 2017 And 2018 – As Of June 15, 2017

As many are aware, Standard & Poor’s publishes earnings estimates for the S&P500.  (My posts concerning their estimates can be found under the S&P500 Earnings label)

For reference purposes, the most current estimates are reflected below, and are as of June 15, 2017:

Year 2017 estimates add to the following:

-From a “bottom up” perspective, operating earnings of $128.17/share
-From a “top down” perspective, operating earnings of N/A
-From a “bottom up” perspective, “as reported” earnings of $118.46/share

Year 2018 estimates add to the following:

-From a “bottom up” perspective, operating earnings of $145.67/share
-From a “top down” perspective, operating earnings of N/A
-From a “bottom up” perspective, “as reported” earnings of $133.85/share

_____

I post various economic forecasts because I believe they should be carefully monitored.  However, as those familiar with this site are aware, I do not agree with many of the consensus estimates and much of the commentary in these forecast surveys.
_____

The Special Note summarizes my overall thoughts about our economic situation

SPX at 2443.72 as this post is written

Friday, June 16, 2017

S&P500 Price Projections – Livingston Survey June 2017

The June 2017 Livingston Survey published on June 16, 2017 contains, among its various forecasts, a S&P500 forecast.  It shows the following price forecast for the dates shown:

June 30, 2017   2410.0
Dec. 29, 2017   2470.0
June 29, 2018   2550.0
Dec. 31, 2018   2630.0

These figures represent the median value across the forecasters on the survey’s panel.

_____

I post various economic forecasts because I believe they should be carefully monitored.  However, as those familiar with this site are aware, I do not agree with many of the consensus estimates and much of the commentary in these forecast surveys.
_____

The Special Note summarizes my overall thoughts about our economic situation

SPX at 2430.32 as this post is written

Thursday, June 15, 2017

Janet Yellen’s June 14, 2017 Press Conference – Notable Aspects

On Wednesday, June 14, 2017 Janet Yellen gave her scheduled June 2017 FOMC Press Conference. (link of video and related materials)

Below are Janet Yellen’s comments I found most notable – although I don’t necessarily agree with them – in the order they appear in the transcript.  These comments are excerpted from the “Transcript of Chairman Yellen’s Press Conference“ (preliminary)(pdf) of June 14, 2017, with the accompanying “FOMC Statement” and “Economic Projections of Federal Reserve Board Members and Federal Reserve Bank Presidents, June 2017“ (pdf).

From Janet Yellen’s opening comments:

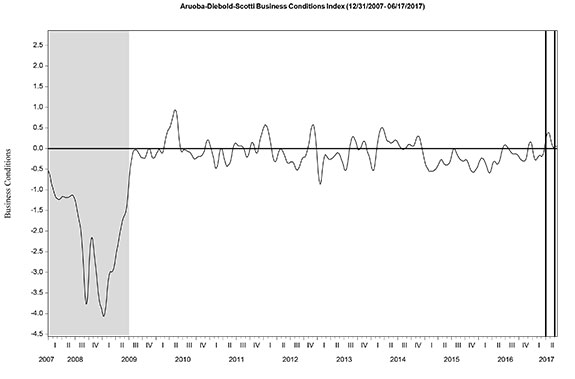
Following a slowdown in the first quarter, economic growth appears to have rebounded,
resulting in a moderate pace of growth so far this year. Household spending, which was
particularly soft earlier this year, has been supported by solid fundamentals, including ongoing improvement in the job market and relatively high levels of consumer sentiment and wealth.
Business investment, which was weak for much of last year, has continued to expand. And
exports have shown greater strength this year, in part reflecting a pickup in global growth.
Overall, we continue to expect that the economy will expand at a moderate pace over the next
few years.

In the labor market, job gains have averaged about 160,000 per month since the start of
the year--a solid rate of growth that, although a little slower than last year, remains well above estimates of the pace necessary to absorb new entrants to the labor force. The unemployment rate has fallen about 1/2 percentage point since the beginning of the year and was 4.3 percent in May, a low level by historical standards and modestly below the median of FOMC participants’ estimates of its longer-run normal level. Broader measures of labor market utilization have also improved this year. Participation in the labor force has been little changed, on net, for about three years. Given the underlying downward trend in participation stemming largely from the aging of the U.S. population, a relatively steady participation rate is a further sign of improving conditions in the labor market. Looking ahead, we expect that the job market will strengthen somewhat further.

Janet Yellen’s responses as indicated to the various questions:

SAM FLEMING. Thank you very much. Sam Fleming from the Financial Times. We've
now had a very long streak of-- or fairly long streak of weak inflation numbers at least measured by the CPI this morning as well. Marketplace-based inflation expectations are declining. What kind of vigilance are you now saying is needed in terms of weak inflation? How does that interact with your policy outlook? And would further disappointments argue for pressing pause on rate hikes or delaying balance sheet run-off? How do you think about those two potential responses to weak inflation?

CHAIR YELLEN. So, let me just say as I emphasized in my statement and always say monitory policy is not on a preset course. We indicated in our statement today that we're closely
monitoring inflation developments and certainly have taken note of the fact there have been
several weak readings particular on core inflation. Our statement indicates that we expect
inflation to remain low in the near term. But on the other hand, we continue to feel that with a
strong labor market and labor market that's continuing to strengthen, the conditions are in place for inflation to move up. Now, obviously we need to monitor that very carefully. And ensure especially with roughly five years of inflation running under our 2 percent objective that is a goal to which the committee is strongly committed. And we need to make sure that we have in place the policies that are necessary to achieve 2 percent inflation and I pledge that we will do that. But let me say with respect to recent readings, it's important not overreact to a few readings and data on inflation can be noisy. As I pointed out, there have been some idiosyncratic factors I think that have held down inflation in recent months, particularly a huge decline in cell telephone service plan prices, some declines in prescription drugs. We had an exceptionally low reading on core PC in March, and that will continue to hold down 12-month changes until that reading drops out. But we are this morning's reading on the CPI showed weakness in a number of categories and it's certainly something that we will be closely monitoring in the months ahead. We will--we're focused on in making our policy decisions on the medium term outlook and we will, you know, be looking carefully at incoming data and as always revising our outlook and policy plans as appropriate.

also:

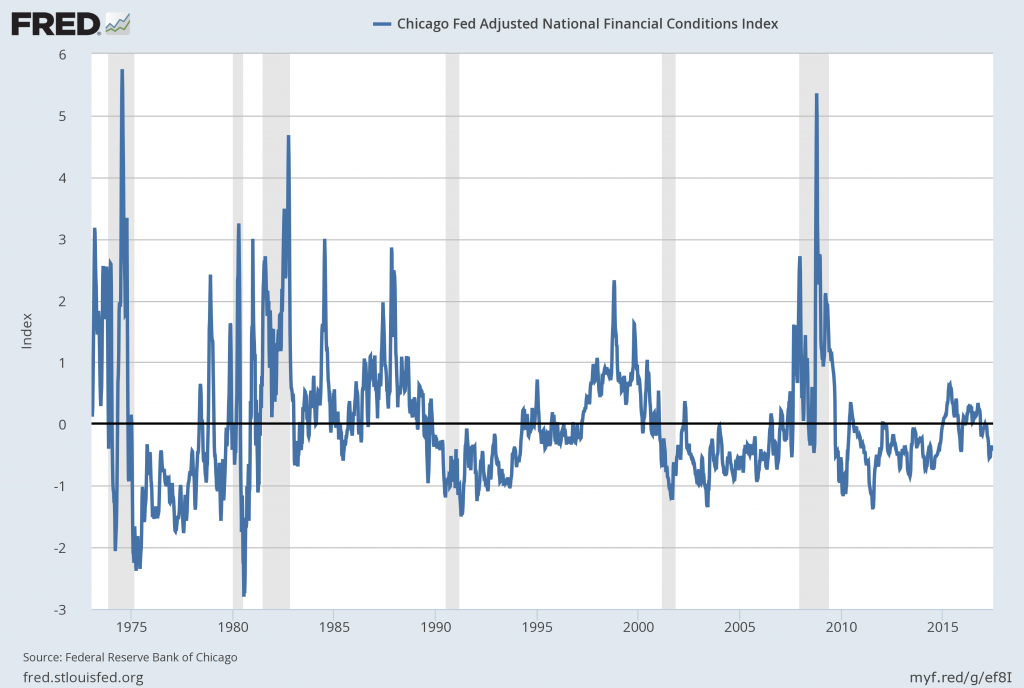
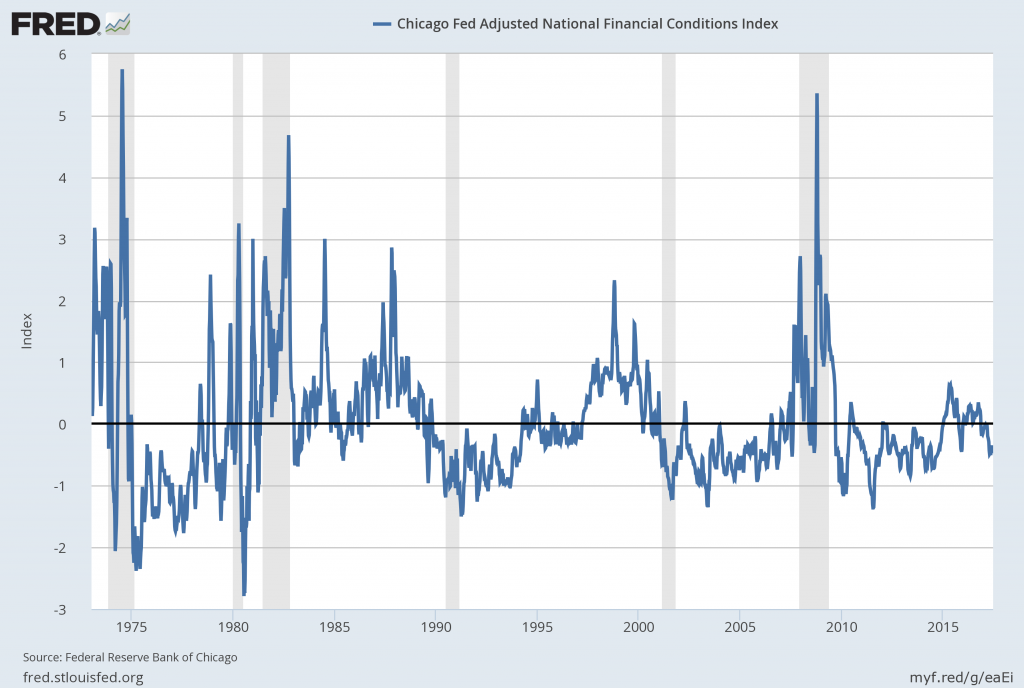
BINYAMIN APPELBAUM. Binyamin Appelbaum, the New York Times. Measures of financial conditions show that since the Fed started raising interest rates two years ago, financial conditions actually have loosened. Consumer business borrowing costs in many cases are down. Do you have the sense that the market is not listening to you? How much of a concern is that for you? And at some point, does it convince you that you need to raise rates perhaps more quickly?

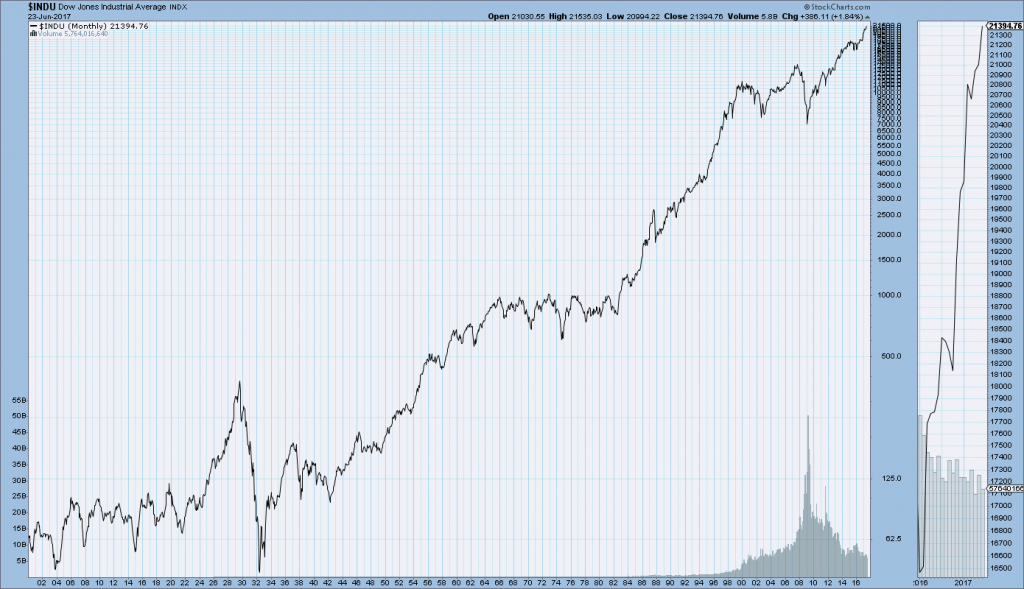
CHAIR YELLEN. Well, in deciding what the appropriate path of rates is, we take many
different factors into account. We have certainly noticed the stock market is up considerably over the last year. That usually shows up in financial conditions indexes and is an important reason why some of them show easier financial conditions. There has been a modest decrease recently in the value of the dollar although it's up substantially since mid-2014. So, we take those factors into account in deriving our forecasts and deciding the appropriate stance of policy. We have done that and-- but other things also affect the stance of policy. So there really can't be any simple relationship. We're not targeting financial conditions. We're trying to set a path of the federal funds rate, the taking into account of those factors and others that don't show up in the financial conditions index. We're trying to generate paths for employment and inflation that meet our mandated objectives.

also:

NANCY MARSHALL-GENZER. Hi, Nancy Marshall-Genzer from Marketplace.  Recently, a group of economists send the Fed a letter earlier this month, disagreeing with your 2 percent inflation target and saying, they would like the economy to run a bit hotter. They don't think the labor market is so tight. You say you're committed to the 2 percent target, but what do you say to them?

CHAIR YELLEN. So, at the time that we adopted the 2 percent target, it was back in
2012, we had a very thorough discussion of the factors that should determine what our inflation objective should be. And, you know, I believe that was a well thought out decision. Now, at the moment, we are highly focused on trying to achieve our 2 percent objective. And we recognize the fact that inflation has been running below and it's essential for us to move inflation back to that objective. Now, we've learned a lot in the meantime and assessments of the level of the neutral likely level currently and going forward of the neutral federal funds rate have changed and are quite a bit lower than they stood in 2012 or earlier years. And that means that the economy is-- has the potential where policy could be constrained by the zero lower bound more frequently than at the time that we adopted our 2 percent objective. So, it's that recognition that causes people to think we might be better off with a higher inflation objective, and that's an important set. This is one of our most critical decisions and one we are attentive to evidence and outside thinking. It's one that we will be reconsidering at some future time. And it's important for our decisions to be informed by a wide range of views and research which is ongoing inside and outside the Fed. But a reconsideration of that objective needs to take account, not only of benefits of a higher in potential benefits, of a higher inflation target, but also the potential cost that could be associated with it. It needs to be a balanced assessment. But I would say that this is one of the most important questions facing monetary policy around the world in the future and we very much look forward to seeing research by economists that will help inform our future decisions on this.

also:

MICHAEL MCKEE. And the characterization of you as a low-interest rate person?

CHAIR YELLEN. Well, I have felt that it's been appropriate for interest rates to remain
low for a very long time. We are in the process of as the economy strengthens normalizing
interest rates. But certainly, we've had a lot of years in which interest rates have been low. I
thought it was necessary to support the economy at that time and was strongly in favor of those policies.

also:

MICHAEL DERBY. Mike Derby from Dow Jones Newswires. In light of the plans to trim the balance sheet hopefully later this year, what have you learned about QE and your bond
buying policies as a tool for monetary policy? When they were launched, it wasn't something
you had, you know, engaged in that scale before, a lot of fear and said it was going to create a
hyperinflation that hasn't ever seem to come to pass. So, you know, in light of QE as potentially
a tool for the future, you know, it might come back again, what have you learned about how it
works in the economy? Like where do you see it affect things? You know, what are sort of the
lessons learned of the experience?

CHAIR YELLEN. Well, thanks. That's a great question. I mean, staff in the Federal Reserve and outside economists who have done a great deal of work trying to evaluate QE, I think the general conclusion is that it has worked in that it has put some downward pressure on
longer term interest rates, so-called term premiums embedded in longer term interest rates.
There's disagreement among economists about exactly how large those effects are and it's
something that's difficult to pin down. But obviously, it has not caused runaway inflation quite
the contrary. I mean, that was never my expectation but I do remember when people were afraid that that would happen. We do have the tools. We have, you know, even with a large balance sheet, we intend to shrink our balance sheet now. But even with a large balance sheet, we retain the ability to move the fed funds rate and set it as appropriate to the needs of the economy. So, I think we have learned that it works. It's a valuable part of the toolkit. It's something that if we were to encounter an episode in the future of extreme weakness where I've said, we want the fed funds rate and movements in short-term interest rates, that's our go-to number one main policy tool. But if we were to hit the zero lower bound and constrained in our use of that tool, certainly balance sheet policies and forward guidance of the type that we provided, I believe based on the evidence of how they worked or to remain part of our toolkit. And we have said in the bullets that we released today on our balance sheet that in such of-- an episode of such extreme weakness in the future, those are things we would consider going forward.

MICHAEL DERBY. One small follow-up. Is four and a half trillion sort of a natural limit
to how high you might want to push the balance sheet or could you envision it going higher if
you needed it to?

CHAIR YELLEN. Well, we've had no discussion of that issue, you know. And our focus
now is on getting it back to a more normal size. But I would say the use of QE in the United
States relative to the size of our economy is not as high as it's been in some other countries that
have employed it. But that's something we haven't seriously even discussed.

_____

The Special Note summarizes my overall thoughts about our economic situation

SPX at 2432.46 as this post is written

Wednesday, June 14, 2017

Chicago Fed National Financial Conditions Index (NFCI)

The St. Louis Fed’s Financial Stress Index (STLFSI) is one index that is supposed to measure stress in the financial system.  Its reading as of the June 8, 2017 update (reflecting data through June 2, 2017) is -1.58.

Of course, there are a variety of other measures and indices that are supposed to measure financial stress and other related issues, both from the Federal Reserve as well as from private sources.

Two other indices that I regularly monitor include the Chicago Fed National Financial Conditions Index (NFCI) as well as the Chicago Fed Adjusted National Financial Conditions Index (ANFCI).

Here are summary descriptions of each, as seen in FRED:
The National Financial Conditions Index (NFCI) measures risk, liquidity and leverage in money markets and debt and equity markets as well as in the traditional and “shadow” banking systems. Positive values of the NFCI indicate financial conditions that are tighter than average, while negative values indicate financial conditions that are looser than average. 
The adjusted NFCI (ANFCI). This index isolates a component of financial conditions uncorrelated with economic conditions to provide an update on how financial conditions compare with current economic conditions. 
For further information, please visit the Federal Reserve Bank of Chicago’s web site:
http://www.chicagofed.org/webpages/publications/nfci/index.cfm
Below are the most recently updated charts of the NFCI and ANFCI, respectively.

The NFCI chart below was last updated on June 14, 2017 incorporating data from January 5,1973 through June 9, 2017, on a weekly basis.  The June 9, 2017 value is -.86:

NFCI

Data Source: FRED, Federal Reserve Economic Data, Federal Reserve Bank of St. Louis; accessed June 14, 2017:

http://research.stlouisfed.org/fred2/series/NFCI


The ANFCI chart below was last updated on June 14, 2017 incorporating data from January 5,1973 through June 9, 2017, on a weekly basis.  The June 9 value is -.42:

ANFCI

Data Source: FRED, Federal Reserve Economic Data, Federal Reserve Bank of St. Louis; accessed June 14, 2017:

http://research.stlouisfed.org/fred2/series/ANFCI

_________

I post various indicators and indices because I believe they should be carefully monitored.  However, as those familiar with this site are aware, I do not necessarily agree with what they depict or imply.
_____

The Special Note summarizes my overall thoughts about our economic situation

SPX at 2437.91 as this post is written

U.S. Deflation – June 14, 2017 Update

This post provides an update to various past posts discussing deflation and “deflationary pressures,” including the most recent post, that of June 28, 2016 titled “U.S. Deflation – June 28, 2016 Update.”   I have extensively written of “deflationary pressures” and deflation as I continue to believe that prolonged and deep U.S. deflationary conditions are on the horizon, and that such deflationary conditions will cause, as well as accompany, inordinate economic hardship. [note: to clarify, for purposes of this discussion, when I mention “deflation” I am referring to the CPI going below zero. Also, I have been using the term “deflationary pressures” as a term to describe deflationary manifestations within an environment that is still overall inflationary but heading towards deflation.]

The subject of deflation contains many complex aspects, and accordingly no short discussion can even begin to be a comprehensive discussion of such.  For reference, my past posts concerning U.S. deflation can be found under the "deflation" label.

In this post I would like to highlight some recent notable developments.

Trying to assess and/or predict the possibility of U.S. deflation is very challenging for many reasons.  Among these reasons is that there are many different measures that are supposed to predict and/or depict the possibility of deflation, and they can show apparently contradictory readings.  Among these measures are both survey-based as well as market-based measures.

Another challenge is that deflation in the U.S. has been relatively non-existent since the beginning of the 20th Century.  As such, knowledge and “practical experience” with deflation is lacking.  As seen in the below chart (from Doug Short’s May 15, 2017 post titled “A Long-Term Look at Inflation“) with the exception of The Great Depression prolonged periods of pronounced deflation have practically been nonexistent, especially after 1950:

U.S. inflation long-term chart

Of note, the shortfall between the Federal Reserve’s stated inflation target (2% on the PCE Price Index) and the actual inflation reading continues.  For years there has been a continued inability for the 2% inflation target to be sustained.  For reference, here is a chart of the PCE Price Index from Doug Short’s post of May 30, 2017, titled “PCE Price Index Headline and Core Down Again in April“:

PCE Price Index Headline and Core

There are many reasons that I believe that U.S. deflation of a pronounced and lasting nature will occur.  Among the reasons for such are the following:
  • As mentioned above, the continuing inability to “create” inflation to rise above the 2% goal.
  • Prolonged and pronounced economic low- and no-growth levels experienced globally.   While there is widespread consensus that U.S. economic growth will remain positive for the foreseeable future, my analyses indicates that the economy continues to have many highly problematical areas and that the widespread consensus concerning current and future economic growth is (substantially) incorrect.
  • A renewed “flattening” of the Yield Curve.  While, for many reasons, I believe that the "Yield Curve" and its various proxies have to viewed with caution, the current trends are notable.  Below is a chart of a yield curve proxy,  showing the spread between the 10-Year Treasury and 2-Year Treasury, using constant maturity securities.  This daily chart is from June 1, 1976 through June 8, 2017, with recessionary periods shown in gray. The current value is .86%:
Yield Curve chart

source:  Federal Reserve Bank of St. Louis, 10-Year Treasury Constant Maturity Minus 2-Year Treasury Constant Maturity [T10Y2Y], retrieved from FRED, Federal Reserve Bank of St. Louis; accessed June 12, 2017:  https://research.stlouisfed.org/fred2/series/T10Y2Y
  • Continual indications of “deflationary pressures.”  I have written extensively concerning these persistent “deflationary pressures,” which have manifested in a variety of areas.
  • I continue to believe that the many continuing signs of “deflationary pressures” is a foreboding.  Among these signs is the pronounced weakness in many commodities.  One such measure is the Bloomberg Commodity Index, as seen below:  (chart courtesy of StockCharts.com; chart creation and annotation by the author)
Bloomberg Commodity Index chart

In conclusion, I continue to believe that significant (in extent and duration) U.S. deflation is on the horizon.  As discussed in the November 14, 2013 post (“Thoughts Concerning Deflation”), deflation often accompanies financial system distress.  My analyses continue to show an exceedingly complex future financial condition in which an exceedingly large “financial system crash” will occur, during  and after which outright deflation will both accompany and exacerbate economic and financial conditions.

_____

The Special Note summarizes my overall thoughts about our economic situation

SPX at 2440.35 as this post is written