Thursday, September 30, 2021

Chicago Fed National Financial Conditions Index (NFCI)

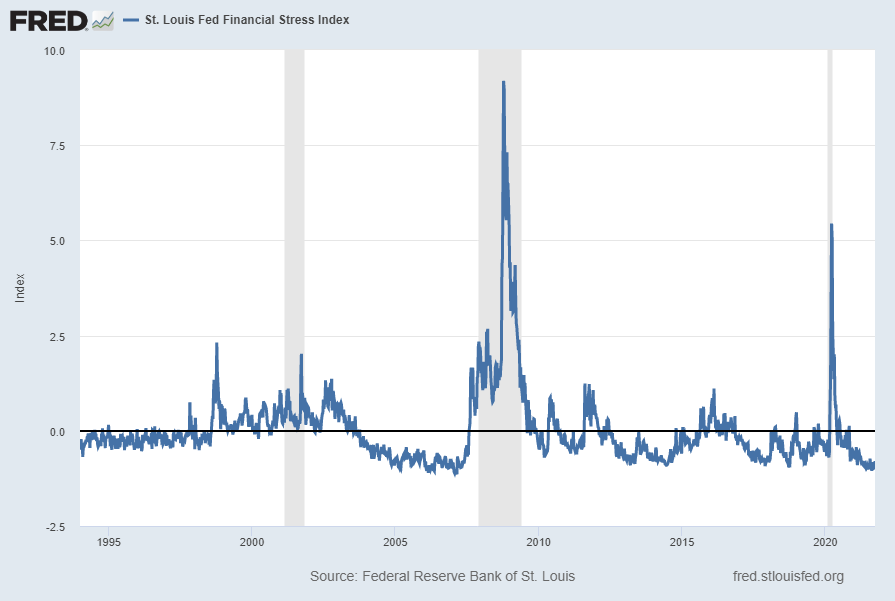
The St. Louis Fed’s Financial Stress Index (STLFSI2) is one index that is supposed to measure stress in the financial system. Its reading as of the September 30, 2021 update (reflecting data through September 24, 2021) is -.7951:

STLFSI2 -.7951

source: Federal Reserve Bank of St. Louis, St. Louis Fed Financial Stress Index [STLFSI2], retrieved from FRED, Federal Reserve Bank of St. Louis; accessed September 30, 2021: https://fred.stlouisfed.org/series/STLFSI2

Of course, there are a variety of other measures and indices that are supposed to measure financial stress and other related issues, both from the Federal Reserve as well as from private sources.

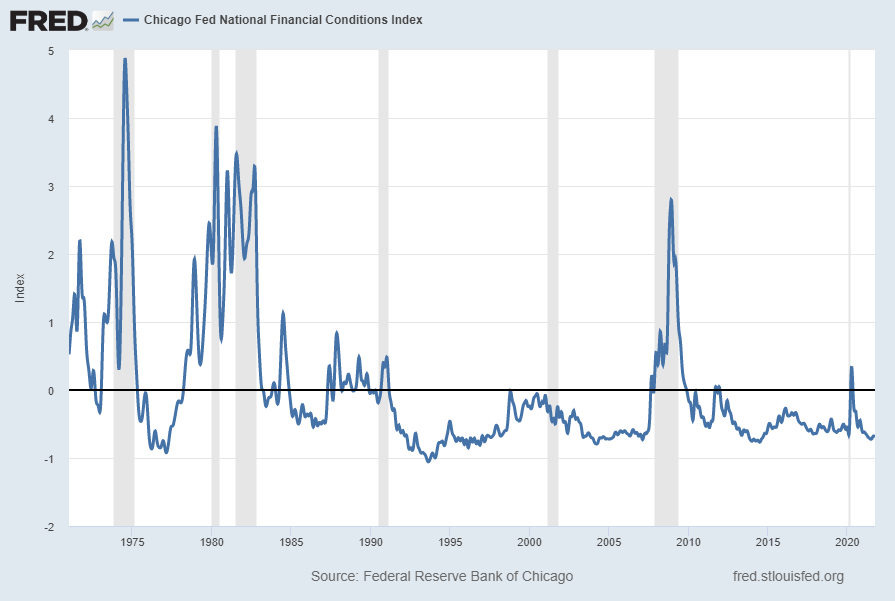
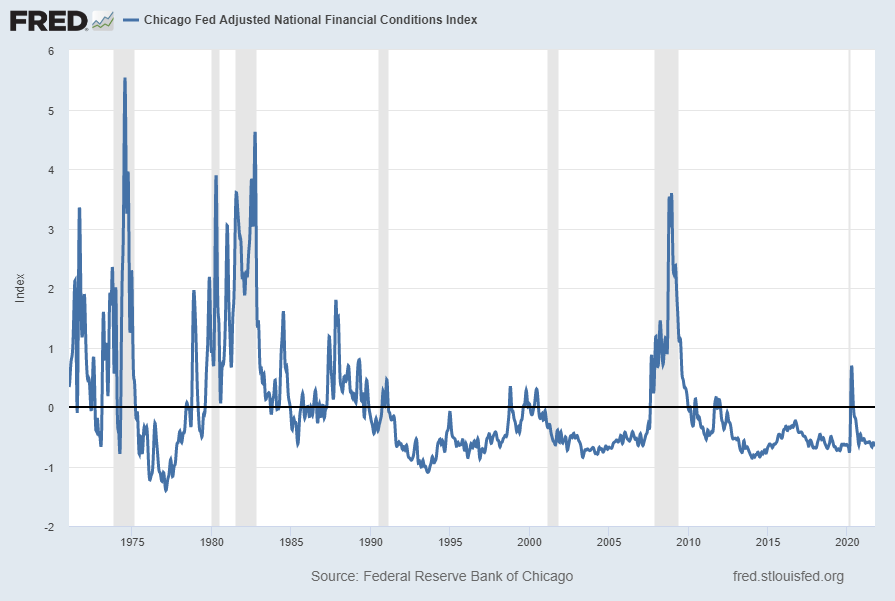
Two other indices that I regularly monitor include the Chicago Fed National Financial Conditions Index (NFCI) as well as the Chicago Fed Adjusted National Financial Conditions Index (ANFCI).

Here are summary descriptions of each, as seen in FRED:

The National Financial Conditions Index (NFCI) measures risk, liquidity and leverage in money markets and debt and equity markets as well as in the traditional and “shadow” banking systems. Positive values of the NFCI indicate financial conditions that are tighter than average, while negative values indicate financial conditions that are looser than average.

The adjusted NFCI (ANFCI). This index isolates a component of financial conditions uncorrelated with economic conditions to provide an update on how financial conditions compare with current economic conditions.

For further information, please visit the Federal Reserve Bank of Chicago’s web site:

http://www.chicagofed.org/webpages/publications/nfci/index.cfm

Below are the most recently updated charts of the NFCI and ANFCI, respectively.

The NFCI chart below was last updated on September 29, 2021 incorporating data from January 8, 1971 through September 24, 2021, on a weekly basis.  The September 24 value is -.68249:

NFCI -.68249

Data Source: FRED, Federal Reserve Economic Data, Federal Reserve Bank of St. Louis; accessed September 30, 2021:  
http://research.stlouisfed.org/fred2/series/NFCI

The ANFCI chart below was last updated on September 29, 2021 incorporating data from January 8, 1971 through September 24, 2021, on a weekly basis.  The September 24, 2021 value is -.62500:

ANFCI

Data Source: FRED, Federal Reserve Economic Data, Federal Reserve Bank of St. Louis; accessed September 30, 2021:  
http://research.stlouisfed.org/fred2/series/ANFCI

_________

I post various indicators and indices because I believe they should be carefully monitored.  However, as those familiar with this site are aware, I do not necessarily agree with what they depict or imply.

_____

The Special Note summarizes my overall thoughts about our economic situation

SPX at 4337.71 as this post is written

Tuesday, September 28, 2021

Money Supply Charts Through August 2021

For reference purposes, below are two sets of charts depicting growth in the money supply.

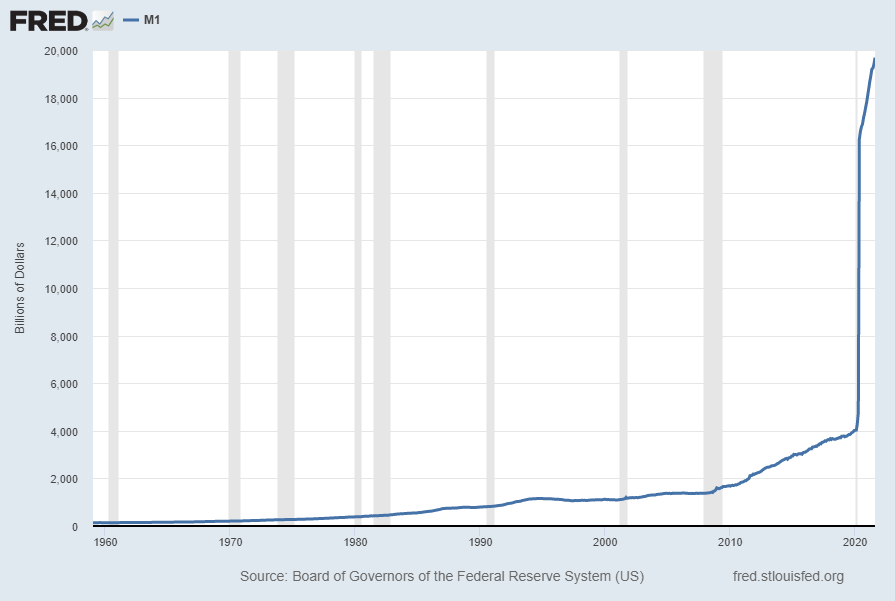
The first shows the M1, defined in FRED as the following:

Before May 2020, M1 consists of (1) currency outside the U.S. Treasury, Federal Reserve Banks, and the vaults of depository institutions; (2) demand deposits at commercial banks (excluding those amounts held by depository institutions, the U.S. government, and foreign banks and official institutions) less cash items in the process of collection and Federal Reserve float; and (3) other checkable deposits (OCDs), consisting of negotiable order of withdrawal, or NOW, and automatic transfer service, or ATS, accounts at depository institutions, share draft accounts at credit unions, and demand deposits at thrift institutions.

Beginning May 2020, M1 consists of (1) currency outside the U.S. Treasury, Federal Reserve Banks, and the vaults of depository institutions; (2) demand deposits at commercial banks (excluding those amounts held by depository institutions, the U.S. government, and foreign banks and official institutions) less cash items in the process of collection and Federal Reserve float; and (3) other liquid deposits, consisting of OCDs and savings deposits (including money market deposit accounts). Seasonally adjusted M1 is constructed by summing currency, demand deposits, and OCDs (before May 2020) or other liquid deposits (beginning May 2020), each seasonally adjusted separately.

Here is the “M1 Money Stock” (seasonally adjusted) chart, updated on September 28, 2021 depicting data through August 2021, with a value of $19,677.7 Billion:

M1SL

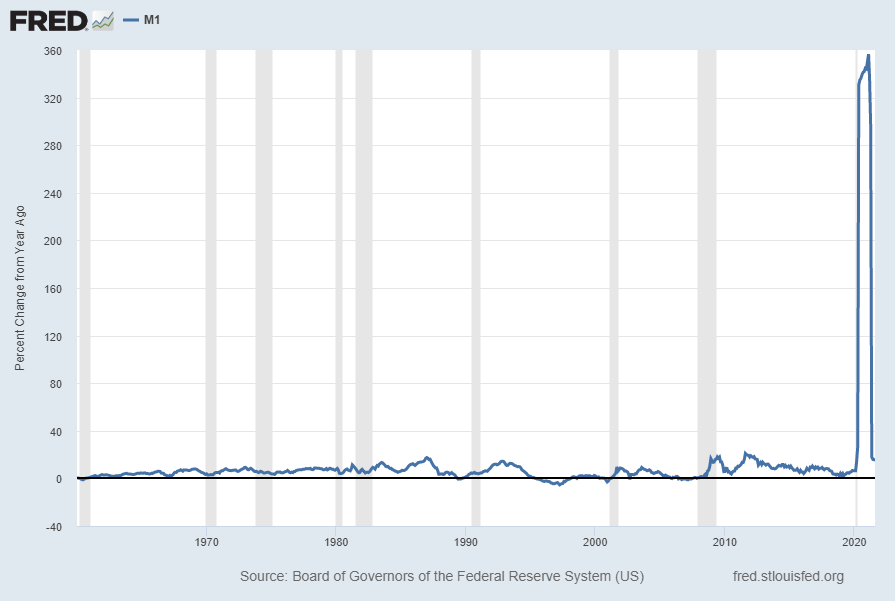
Here is the “M1 Money Stock” chart on a “Percent Change From Year Ago” basis, with a current value of 16.5%:

M1SL Percent Change From Year Ago

Data Source: Board of Governors of the Federal Reserve System (US), M1 Money Stock [M1SL], retrieved from FRED, Federal Reserve Bank of St. Louis; accessed September 28, 2021: https://fred.stlouisfed.org/series/M1SL

The second set shows M2, defined in FRED as the following:

Before May 2020, M2 consists of M1 plus (1) savings deposits (including money market deposit accounts); (2) small-denomination time deposits (time deposits in amounts of less than $100,000) less individual retirement account (IRA) and Keogh balances at depository institutions; and (3) balances in retail money market funds (MMFs) less IRA and Keogh balances at MMFs.

Beginning May 2020, M2 consists of M1 plus (1) small-denomination time deposits (time deposits in amounts of less than $100,000) less IRA and Keogh balances at depository institutions; and (2) balances in retail MMFs less IRA and Keogh balances at MMFs. Seasonally adjusted M2 is constructed by summing savings deposits (before May 2020), small-denomination time deposits, and retail MMFs, each seasonally adjusted separately, and adding this result to seasonally adjusted M1.

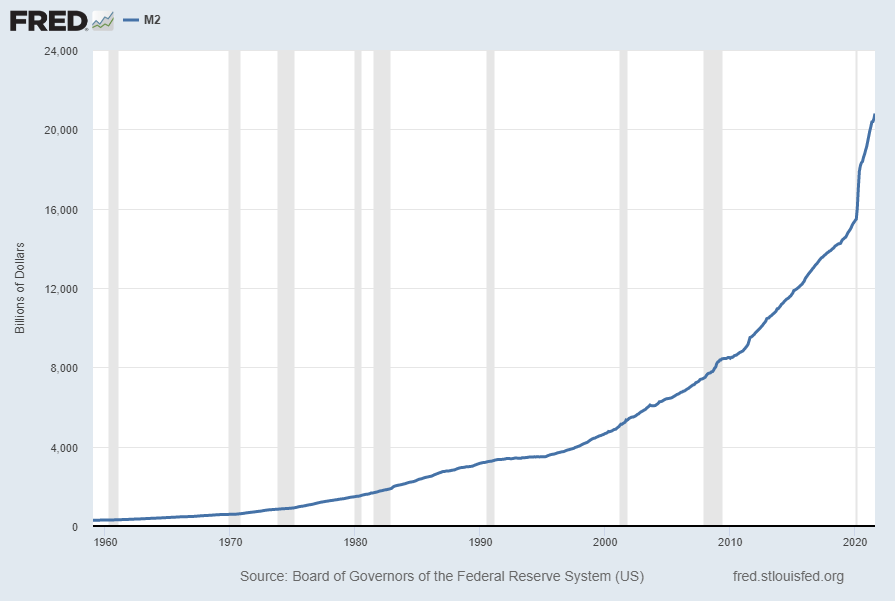
Here is the “M2 Money Stock” (seasonally adjusted) chart, updated on September 28, 2021, depicting data through August 2021, with a value of $20,797.0 Billion:

M2SL

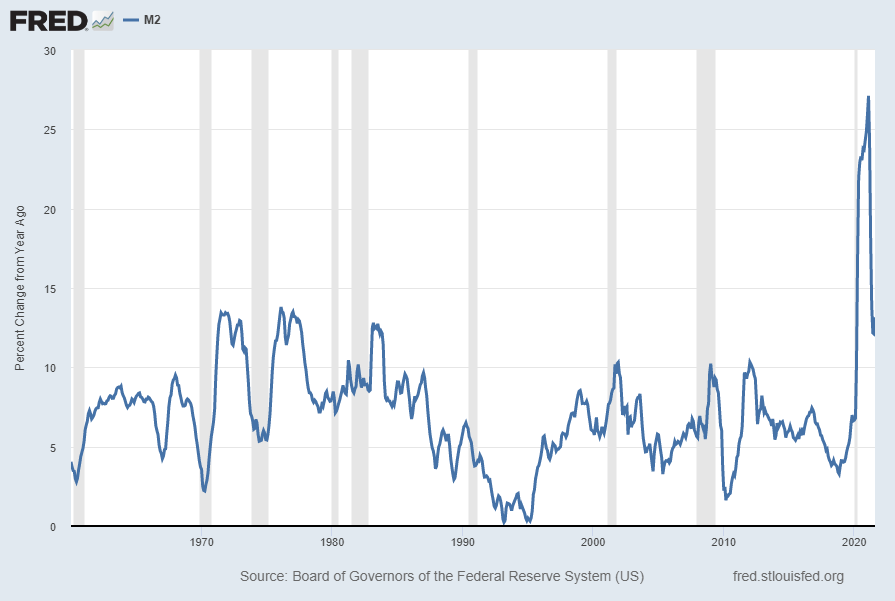
Here is the “M2 Money Stock” chart on a “Percent Change From Year Ago” basis, with a current value of 13.2%:

M2SL Percent Change From Year Ago

Data Source: Board of Governors of the Federal Reserve System (US), M2 Money Stock [M2SL], retrieved from FRED, Federal Reserve Bank of St. Louis; accessed September 28, 2021: https://fred.stlouisfed.org/series/M2SL

_____

The Special Note summarizes my overall thoughts about our economic situation

SPX at 4369.35 as this post is written

Monday, September 27, 2021

Durable Goods New Orders – Long-Term Charts Through August 2021

Many people place emphasis on Durable Goods New Orders as a prominent economic indicator and/or leading economic indicator.

For reference, below are two charts depicting this measure.

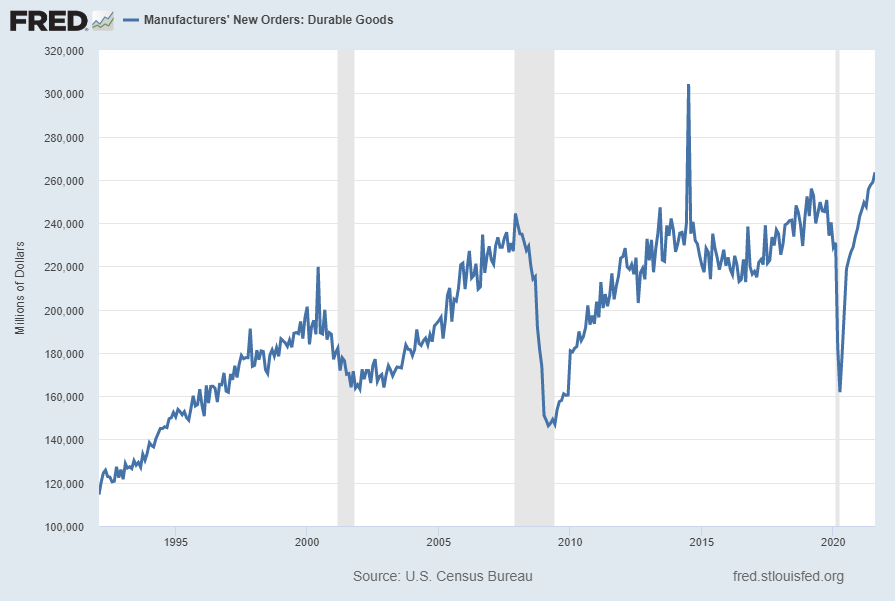
First, from the St. Louis Fed site (FRED), a chart through August 2021, updated on September 27, 2021. This value is $263,490 ($ Millions):

(click on charts to enlarge images)

Durable Goods New Orders

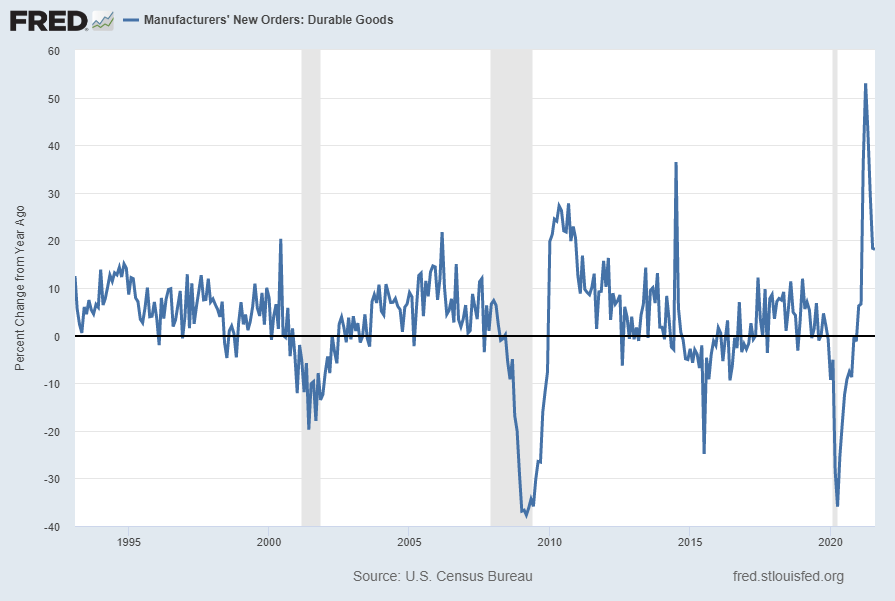
Second, here is the chart depicting this measure on a “Percentage Change from a Year Ago” basis, with a last value of 18.1%:

Durable Goods New Orders Percent Change From Year Ago

Data Source: FRED, Federal Reserve Economic Data, Federal Reserve Bank of St. Louis: Manufacturers’ New Orders:  Durable Goods [DGORDER]; U.S. Department of Commerce: Census Bureau; accessed September 27, 2021; 
http://research.stlouisfed.org/fred2/series/DGORDER

_________

I post various indicators and indices because I believe they should be carefully monitored.  However, as those familiar with this site are aware, I do not necessarily agree with what they depict or imply.

_____

The Special Note summarizes my overall thoughts about our economic situation

SPX at 4443.66 as this post is written

Thursday, September 23, 2021

Total Household Net Worth As Of 2Q 2021 – Two Long-Term Charts

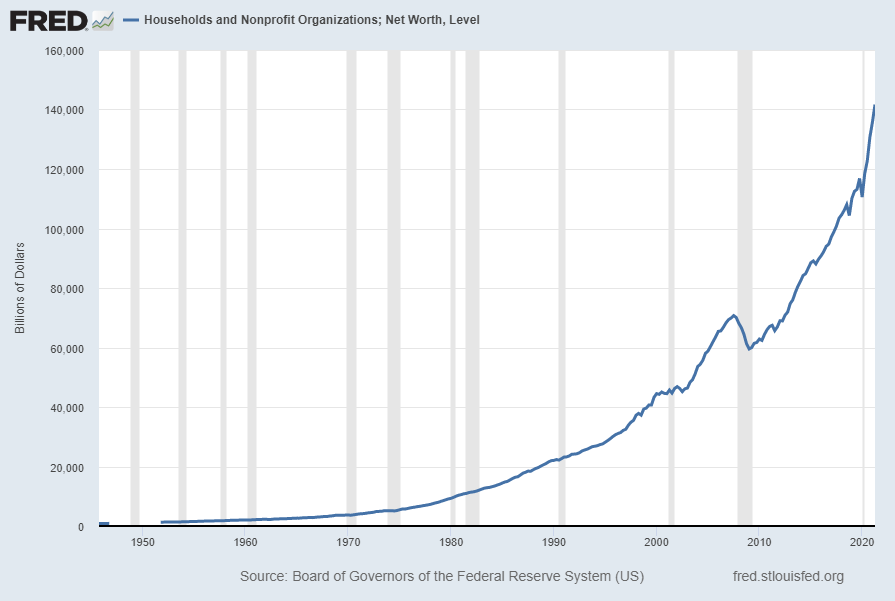
For reference purposes, here is Total Household Net Worth from a long-term perspective (from 1945:Q4 through 2021:Q2).  The last value (as of the September 23, 2021 update) is $141.667529 Trillion:

(click on each chart to enlarge image)

TNWBSHNO $141.667529T

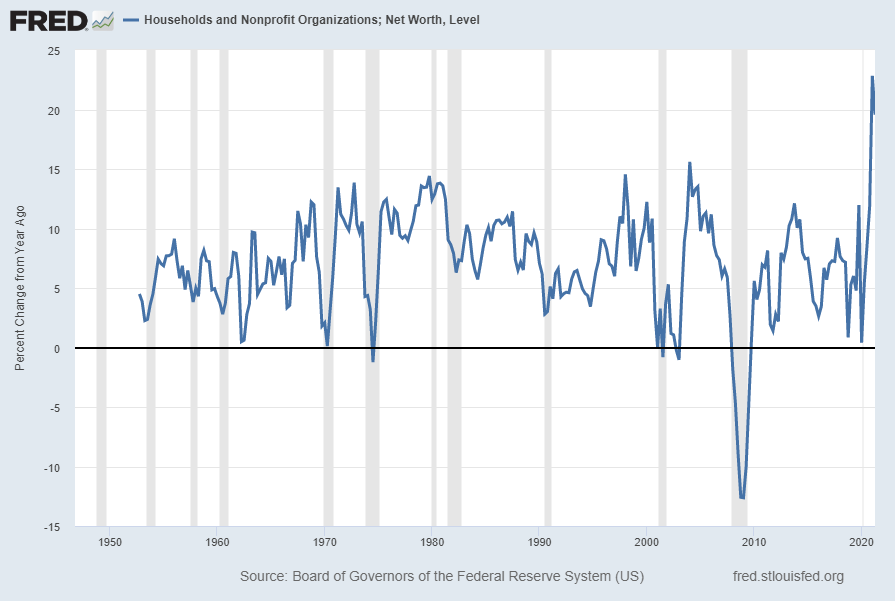
Also of interest is the same metric presented on a “Percent Change from a Year Ago” basis, with a current value of 19.6%:

TNWBSHNO 19.6 Percent Change From Year Ago

Data Source: FRED, Federal Reserve Economic Data, Board of Governors of the Federal Reserve System; accessed September 23, 2021; 
http://research.stlouisfed.org/fred2/series/TNWBSHNO

_____

The Special Note summarizes my overall thoughts about our economic situation

SPX at 4456.07 as this post is written

Total Household Net Worth As A Percent Of GDP 2Q 2021

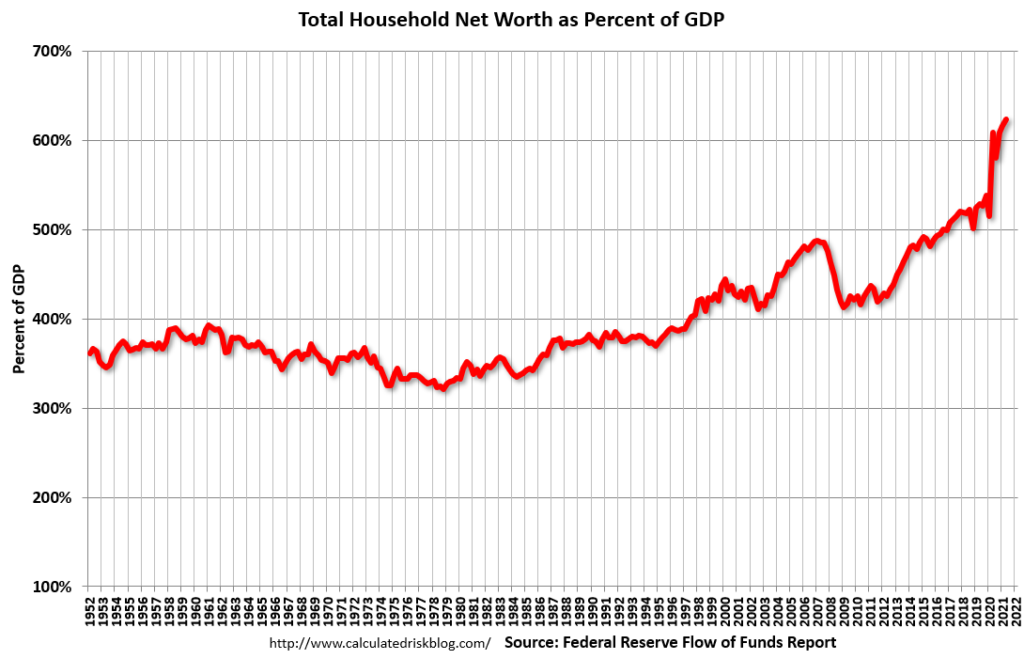
The following chart is from the CalculatedRisk post of September 23, 2021 titled “Fed’s Flow of Funds: Household Net Worth Increased $5.9 Trillion in Q2.” It depicts Total Household Net Worth as a Percent of GDP.  The underlying data is from the Federal Reserve’s Z.1 report, “Financial Accounts of the United States“:

(click on chart to enlarge image)

Total Household Net Worth As A Percent Of GDP

As seen in the above-referenced CalculatedRisk post:

The net worth of households and nonprofits rose to $141.7 trillion during the second quarter of 2021. The value of directly and indirectly held corporate equities increased $3.5 trillion and the value of real estate increased $1.2 trillion.

As I have written in previous posts concerning this Household Net Worth (as a percent of GDP) topic:

As one can see, the first outsized peak was in 2000, and attained after the stock market bull market / stock market bubbles and economic strength.  The second outsized peak was in 2007, right near the peak of the housing bubble as well as near the stock market peak.

also:

I could extensively write about various interpretations that can be made from this chart.  One way this chart can be interpreted is a gauge of “what’s in it for me?” as far as the aggregated wealth citizens are gleaning from economic activity, as measured compared to GDP.

_____

The Special Note summarizes my overall thoughts about our economic situation

SPX at 4465.14 as this post is written

Jerome Powell’s September 22, 2021 Press Conference – Notable Aspects

On Wednesday, September 22, 2021 FOMC Chairman Jerome Powell gave his scheduled September 2021 FOMC Press Conference. (link of video and related materials)

Below are Jerome Powell’s comments I found most notable – although I don’t necessarily agree with them – in the order they appear in the transcript.  These comments are excerpted from the “Transcript of Chairman Powell’s Press Conference“ (preliminary)(pdf) of September 22, 2021, with the accompanying “FOMC Statement” and “Summary of Economic Projections” dated September 22, 2021.

Excerpts from Chairman Powell’s opening comments:

Today the Federal Open Market Committee kept interest rates near zero and maintained our current pace of asset purchases.  These measures, along with our strong guidance on interest rates and on our balance sheet, will ensure that monetary policy will continue to support the economy until the recovery is complete.

Progress on vaccinations and unprecedented fiscal policy actions are also providing strong support to the recovery.  Indicators of economic activity and employment have continued to strengthen.  Real GDP rose at a robust 6.4 percent pace in the first half of the year, and growth is widely expected to continue at a strong pace in the second half.  The sectors most adversely affected by the pandemic have improved in recent months, but the rise in COVID-19 cases has slowed their recovery.  Household spending rose at an especially rapid pace over the first half of the year, but flattened out in July and August as spending softened in COVID-sensitive sectors, such as travel and restaurants.  Additionally, in some industries, near-term supply constraints are restraining activity.  These constraints are particularly acute in the motor vehicle industry, where the worldwide shortage of semiconductors has sharply curtailed production.  Partly reflecting the effects of the virus and supply constraints, forecasts from FOMC participants for economic growth this year have been revised somewhat lower since our June Summary of Economic Projections, but participants still foresee rapid growth.

Excerpts of Jerome Powell’s responses as indicated to various questions:

CHRIS RUGABER. Thank you. Thank you, thank you, Chair Powell. I have a question about jobs and the Fed’s schedule, the Fed’s policy framework that you laid out here. You and other Fed officials have often talked about expecting a job market pickup in September as more children return to school, freeing up more parents to work, COVID abating. You mentioned in the past the extra unemployment benefits expiring. There’s some real-time data suggesting that we may not be seeing much of a return of labor supply. So do you still expect to see that in the next couple of jobs reports? And how would a relatively weak jobs report in September affect your plans? Thank you. 

CHAIR POWELL. So you’re right, we have a, really I’ll call it a unique situation where by many measures the labor market is tight. And 11 million job openings, very widespread, reports from employers all over the economy saying it’s quite difficult to hire people, wages moving up and that. So quite a tight labor market. So our view, I think widespread view a few months ago was that several things were coming together in the fall, including kids back to school, which would, you know, which would lighten caregiving duties, including the expiration of unemployment, extra unemployment benefits, and other things would come together to provide an increase in labor supply, and so we’d get out of this strange world where there’s lots of unemployed people and a high unemployment rate, but a labor shortage. And so what happened was Delta happened. And you had this very sharp spike in Delta cases. And I think — so that affects, for example, when schools are open 60 percent of time or when they’re always at a threat of being closed because of Delta, the Delta variant, you know, you might want to wait rather than going ahead and taking a job and starting work only to have to quit it three weeks later. You’re going to wait until you’re confident of that. So some of that may not have happened. Also people didn’t, you know, as you know, hiring and spending in these face-to-face service industries, travel and leisure, it just kind of stopped during those months. So we — so that — really the big shortfall in labor, in jobs was largely in travel and leisure and because of, clearly because of Delta. So that all happened. And so what we, [inaudible] didn’t happen. I think there’s still — it may just be that it’s going to take more time. But it still seems that inexorably people will — these are people who were largely working back in February of 2020. They’ll get back to work when it’s time to do that. It just may take longer time. You’re right, though, it didn’t happen with any force in September, and a lot of that was Delta. In terms of the, you asked also about the test for November. I think if the economy continues to progress broadly in line with expectations, then I think — and also the overall situation is appropriate for this, then I think we could easily move ahead at the next meeting or not, depending on whether we feel like that, those tests are met. 

CHRIS RUGABER. Just a, If I could just quickly follow-up. I mean, what, how much of that will depend on what kind of jobs report we get for September? And, I mean, is it, you know, are you in a data-dependent phase here where you need to see certain numbers going ahead? Or are we at a point where you’ve accumulated enough progress that – 

CHAIR POWELL. So it is, it’s accumulated progress. So, you know, for me, it wouldn’t take a knockout, great, super strong employment report. It would take a reasonably good employment report for me to feel like that test is met. And others on the Committee, many on the Committee feel that the test is already met. Others want to see more progress. And, you know, we’ll work it out as we go. But I would say that, in my own thinking, the test is all but met. So I don’t personally need to see a very strong employment report, but I’d like it see a decent employment report. I mean, it’s not, it’s, again, it’s not to be confused with the test for liftoff, which is so much higher. 

also:

JEAN YUNG. Thank you, Michelle. Chair Powell, I wanted to ask about how the Fed would balance the two parts of its dual mandate if inflation stays elevated but we still have a labor shortage and participation remains lower than ideal? Would you hold off on raising rates? Or how would you think about that? Thank you. 

CHAIR POWELL. Well, let me say one thing, you’re looking for conditions consistent with maximum employment to liftoff, and those conditions can change over time. So you’re not necessarily bound by a particular level of the unemployment rate or the participation rate or anything else like that, which can change over time. But more to your point really, we actually have a paragraph in our framework, and something like this has been there for a long time. It’s, I think it’s paragraph six. And you’re talking about a situation in which the two goals are not complementary, they’re somehow in tension. And if we judge thats effect, that is the case, what it says is we take into account the employment shortfalls and inflation deviations and the potentially different time horizons over which employment and inflation are projected to return to levels judged consistent with mandate. So, we used to call that the balanced approach paragraph because it had those words. So it’s a very difficult situation for any Central Bank to be, pardon me, to be in a situation where the two goals are in tension. And that paragraph tries to address it by saying we would sort of weigh the equities between the two. How long will it take? And how big are the gaps? And that kind of thing. We don’t really think we’re in that — we’re sort in that situation, I’d say, in a short-term way. But we think, we do expect that this is sort of because of the COVID shock and the reopening and all that, you’re seeing this temporarily.

also:

SCOTT HORSLEY. Thank you, Mr. Chairman. You talked a little bit about inflation expectations. And there does seem to be something of a divide between market expectations and the views of professional economists, which are pretty much in line with the FOMC members, and lay people’s expectations, at least as reflected in the recent New York Fed survey. How much weight do you put on lay people’s expectations? And what do you think accounts for that divide? 

CHAIR POWELL. So within, let’s just take the household surveys generally. The New York Fed survey, let me talk about that specifically, and this is from the New York Fed. It’s only an eight-year old survey, and it does seem as though the, they’re looking three years out. And it seems like there’s a high correlation between three year and one year. For the most part, surveys are showing that households expect higher inflation in the near-term, but not in the longer-term. And that’s also what expectations are showing. So there are many, many different inflation measures, of course. And that’s why we have this thing called the CIE, which is the, it’s an index of, it’s market-based measures. It’s professional forecasters and it’s household surveys. And you just put them all, it’s not, you know, it doesn’t have a lot of grand theory about it. You put them all in, and you measure the change. So you should be — and also you measure things like the dispersion and that sort of thing, so you can look at all that. And, you know, it tells a story of inflation expectations moving up. Many of the different measures will also show inflation expectations moving back up to where they were in, say 2013, which was before the really — the drop in inflation expectations broadly happened in ’14 and ’15, around then. So, that’s not a troubling thing. But, you know, inflation expectations are terribly important. We spend a lot of time watching them. And if we did see them moving up in a troubling way and running persistently above levels that are really consistent with our mandate, then, you know, we would certainly react to that. But we don’t really see that now. We see more of a moderate increase that is, the first part of which is welcome. And because, you know, inflation expectations had drifted down, and it was good to see them get back up a bit. But, again, we watch carefully. 

_____

_____

The Special Note summarizes my overall thoughts about our economic situation

SPX at 4460.74 as this post is written 
Updates Of Economic Indicators September 2021

The following is an update of various indicators that are supposed to predict and/or depict economic activity. These indicators have been discussed in previous blog posts:

The September 2021 Chicago Fed National Activity Index (CFNAI) updated as of September 23, 2021:

The CFNAI, with a current reading of .29:

CFNAI .29

source:  Federal Reserve Bank of Chicago, Chicago Fed National Activity Index [CFNAI], retrieved from FRED, Federal Reserve Bank of St. Louis, September 23, 2021; 
https://fred.stlouisfed.org/series/CFNAI

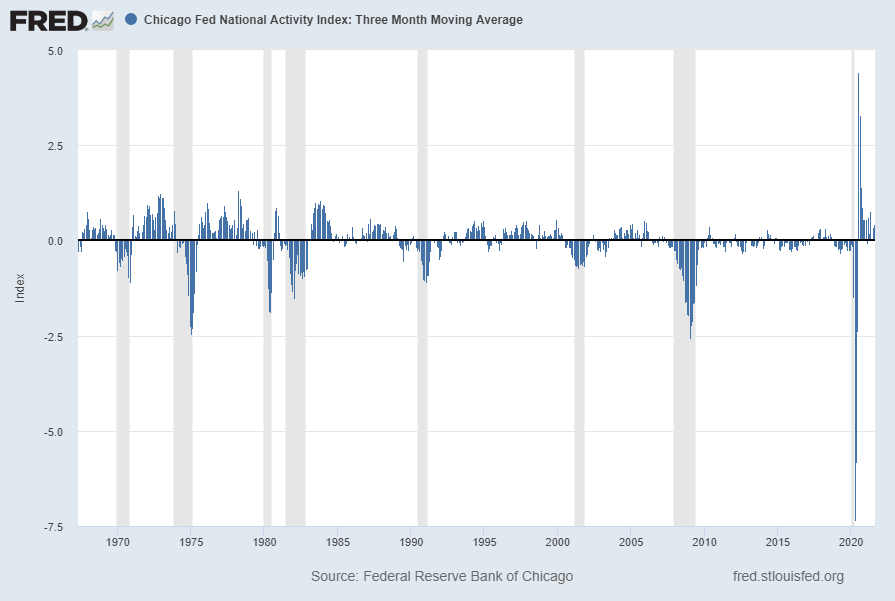
The CFNAI-MA3, with a current reading of .43:

CFNAIMA3 .43

source:  Federal Reserve Bank of Chicago, Chicago Fed National Activity Index: Three Month Moving Average [CFNAIMA3], retrieved from FRED, Federal Reserve Bank of St. Louis, September 23, 2021; 
https://fred.stlouisfed.org/series/CFNAIMA3

The ECRI WLI (Weekly Leading Index):

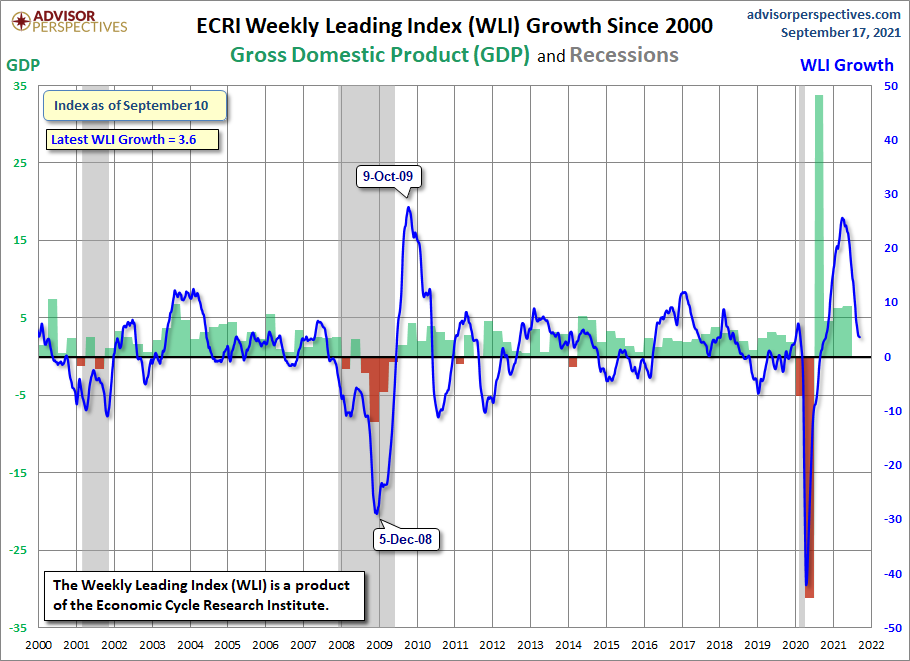
As of September 17, 2021 (incorporating data through September 10, 2021) the WLI was at 153.3 and the WLI, Gr. was at 3.6%.

A chart of the WLI,Gr., from the Advisor Perspectives’ ECRI update post of September 17, 2021:

ECRI WLI,Gr. 3.6 percent

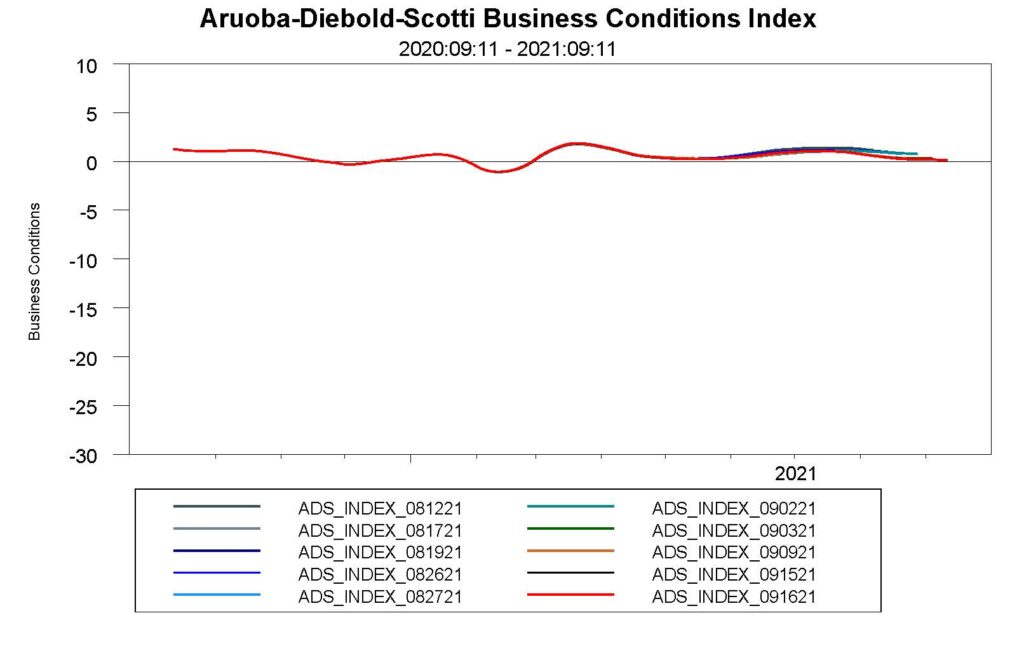
The Aruoba-Diebold-Scotti Business Conditions (ADS) Index

The ADS Index as of September 16, 2021, reflecting data from September 11, 2020 through September 11, 2021, with last value .128961:

ADS

The Conference Board Leading Economic Index (LEI), Coincident Economic Index (CEI), and Lagging Economic Index (LAG):

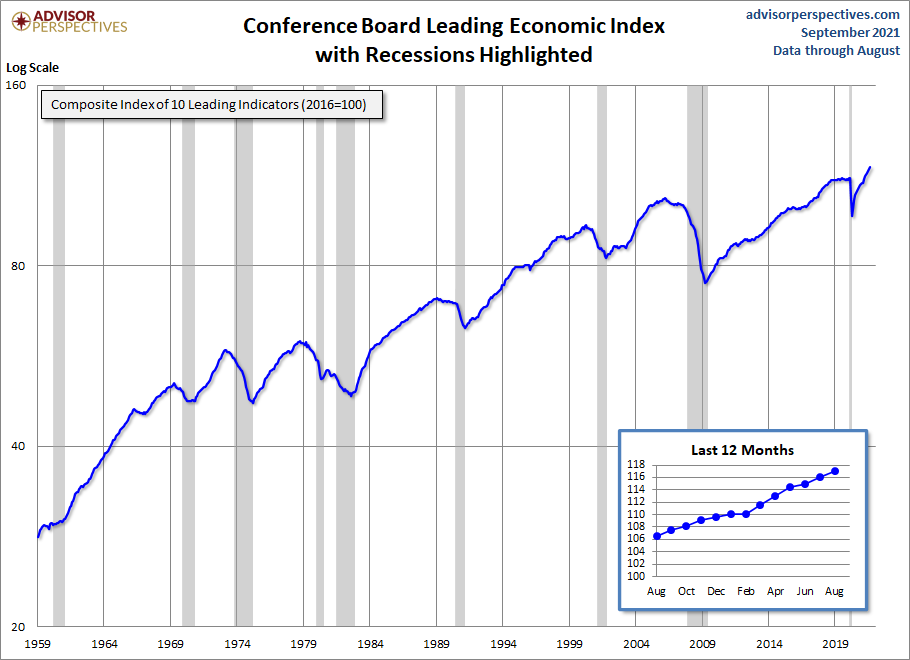
As per the September 23, 2021 Conference Board press release, titled “The Conference Board Leading Economic Index (LEI) for the U.S. Increased in August” the LEI was at 117.1 in August, the CEI was at 105.9 in August, and the LAG was at 106.3 in August.

An excerpt from the release:

“The U.S. LEI rose sharply in August and remains on a rapidly rising trajectory,” said Ataman Ozyildirim, Senior Director of Economic Research at The Conference Board. “While the Delta variant—alongside rising inflation fears—could create headwinds for labor markets and the consumer spending outlook in the near term, the trend in the LEI is consistent with robust economic growth in the reminder of the year. Real GDP growth for 2021 is expected to reach nearly 6.0 percent year-over-year, before easing to a still-robust 4.0 percent for 2022.”

Here is a chart of the LEI from the Advisor Perspectives’ Conference Board Leading Economic Index update of September 23, 2021:

Conference Board LEI 117.1

_________

I post various indicators and indices because I believe they should be carefully monitored.  However, as those familiar with this site are aware, I do not necessarily agree with what they depict or imply.

_____

The Special Note summarizes my overall thoughts about our economic situation

SPX at 4452.88 as this post is written
Wednesday, September 22, 2021

The U.S. Economic Situation – September 22, 2021 Update

Perhaps the main reason that I write of our economic situation is that I continue to believe, based upon various analyses, that our economic situation is in many ways misunderstood.  While no one likes to contemplate a future rife with economic adversity, current and future economic problems must be properly recognized and rectified if high-quality, sustainable long-term economic vitality is to be realized.

There are an array of indications and other “warning signs” – many readily apparent – that current economic activity and financial market performance is accompanied by exceedingly perilous dynamics.
I have written extensively about this peril, including in the following:
Building Financial Danger” (ongoing updates)
My analyses continues to indicate that the growing level of financial danger will lead to the next stock market crash that will also involve (as seen in 2008) various other markets as well.  Key attributes of this next crash is its outsized magnitude (when viewed from an ultra-long term historical perspective) and the resulting economic impact.  This next financial crash is of tremendous concern, as my analyses indicate it will lead to a Super Depression – i.e. an economy characterized by deeply embedded, highly complex, and difficult-to-solve problems.

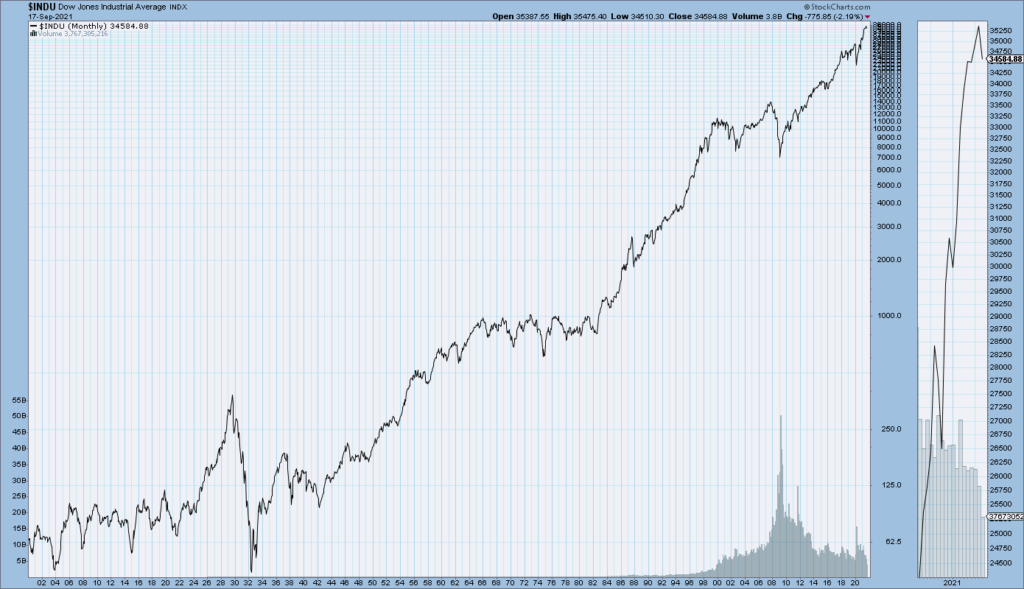
For long-term reference purposes, here is a chart of the Dow Jones Industrial Average since 1900, depicted on a monthly basis using a LOG scale (updated through September 17, 2021, with a last value of 34,584.88):

(click on chart to enlarge image)(chart courtesy of StockCharts.com)

DJIA since 1900

_____

The Special Note summarizes my overall thoughts about our economic situation

SPX at 4377.91 as this post is written