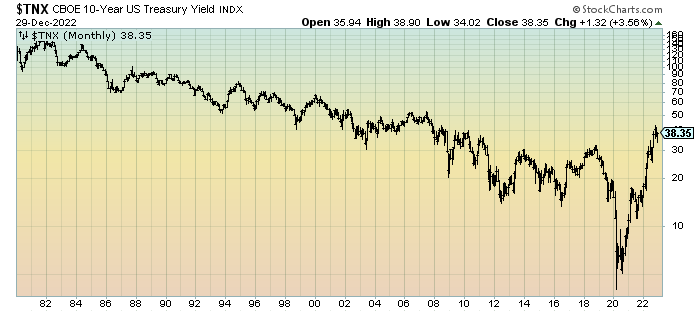
I have written extensively about the importance of U.S. interest rate levels. Rising interest rates have substantial ramifications for many aspects of the current-day economy. My commentaries with regard to interest rates and the bond bubble are largely found under the “bond bubble” label. From an intervention perspective commentary is found under the “Intervention” label.
As reference, below is a long-term chart of the 10-Year Treasury yield since 1980, depicted on a monthly basis, LOG scale:
(click on charts to enlarge images)(charts courtesy of StockCharts.com; chart creation and annotation by the author)
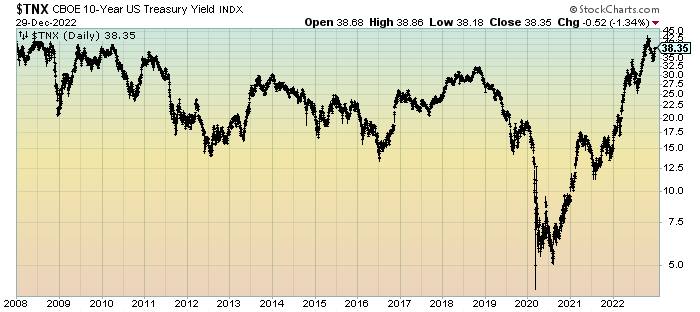
Here is a long-term chart of the 10-Year Treasury yield since 2008, depicted on a daily basis, LOG scale:
_____
The Special Note summarizes my overall thoughts about our economic situation
In the July 2, 2010 post I explained my policy with regard to changing the content of posts after the day the posts have been published on the blog.
While I change bad links and incorrect formatting without notification, I believe that changing blog posts’ content warrants disclosure.
Over time I have made corrections to content on various blog posts. These corrections generally have been for reasons of (factual) accuracy and – for better readability – to correct typos and/or incorrect extraneous wording.
A list of these corrections is seen below. This list indicates the posts corrected and the reason for such corrections. The error as seen in the original posting is seen in bold:
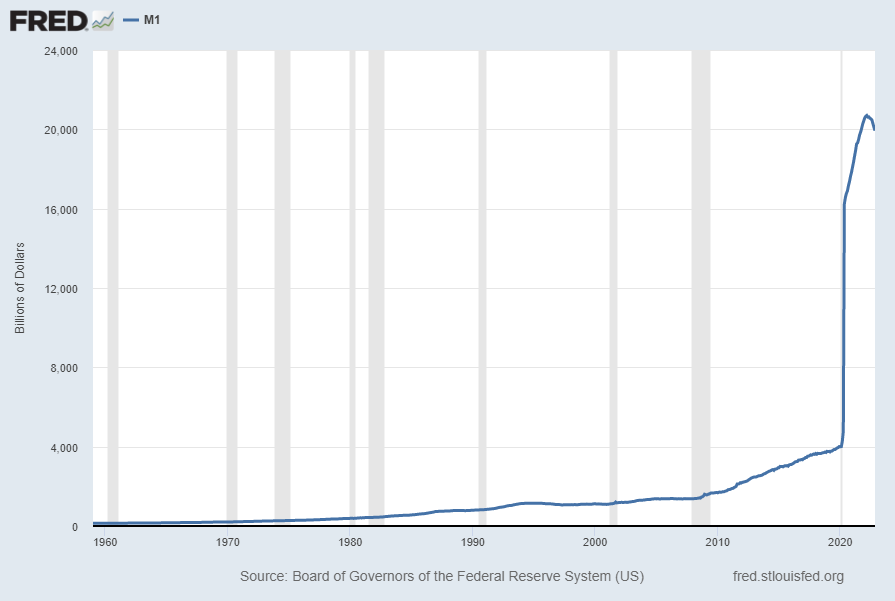
For reference purposes, below are two sets of charts depicting growth in the money supply.
The first shows the M1, defined in FRED as the following:
Before May 2020, M1 consists of (1) currency outside the U.S. Treasury, Federal Reserve Banks, and the vaults of depository institutions; (2) demand deposits at commercial banks (excluding those amounts held by depository institutions, the U.S. government, and foreign banks and official institutions) less cash items in the process of collection and Federal Reserve float; and (3) other checkable deposits (OCDs), consisting of negotiable order of withdrawal, or NOW, and automatic transfer service, or ATS, accounts at depository institutions, share draft accounts at credit unions, and demand deposits at thrift institutions.
Beginning May 2020, M1 consists of (1) currency outside the U.S. Treasury, Federal Reserve Banks, and the vaults of depository institutions; (2) demand deposits at commercial banks (excluding those amounts held by depository institutions, the U.S. government, and foreign banks and official institutions) less cash items in the process of collection and Federal Reserve float; and (3) other liquid deposits, consisting of OCDs and savings deposits (including money market deposit accounts). Seasonally adjusted M1 is constructed by summing currency, demand deposits, and OCDs (before May 2020) or other liquid deposits (beginning May 2020), each seasonally adjusted separately.
Here is the “M1 Money Stock” (seasonally adjusted) chart, updated on December 27, 2022 depicting data through November 2022, with a value of $19,933.2 Billion:
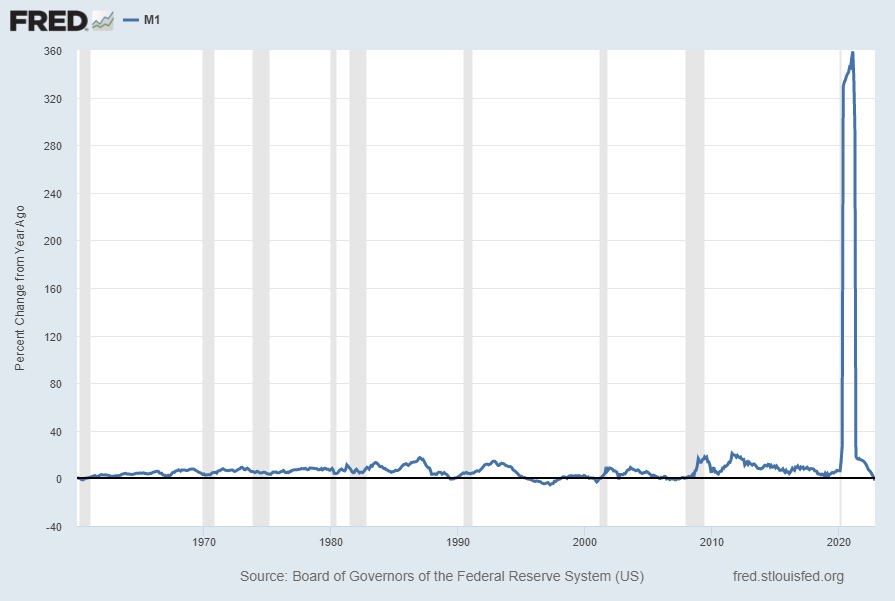
Here is the “M1 Money Stock” chart on a “Percent Change From Year Ago” basis, with a current value of -1.7%:
Data Source: Board of Governors of the Federal Reserve System (US), M1 Money Stock [M1SL], retrieved from FRED, Federal Reserve Bank of St. Louis; accessed December 27, 2022: https://fred.stlouisfed.org/series/M1SL
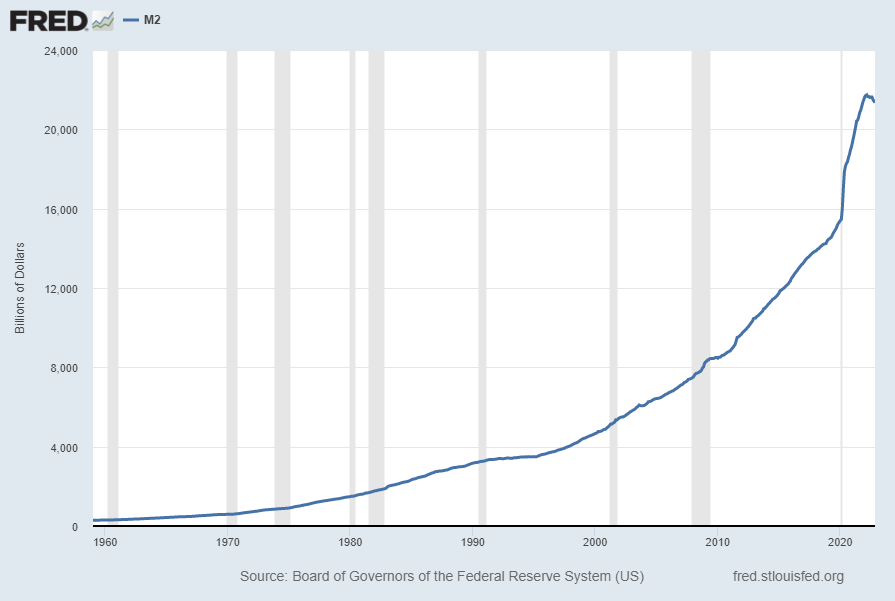
The second set shows M2, defined in FRED as the following:
Before May 2020, M2 consists of M1 plus (1) savings deposits (including money market deposit accounts); (2) small-denomination time deposits (time deposits in amounts of less than $100,000) less individual retirement account (IRA) and Keogh balances at depository institutions; and (3) balances in retail money market funds (MMFs) less IRA and Keogh balances at MMFs.
Beginning May 2020, M2 consists of M1 plus (1) small-denomination time deposits (time deposits in amounts of less than $100,000) less IRA and Keogh balances at depository institutions; and (2) balances in retail MMFs less IRA and Keogh balances at MMFs. Seasonally adjusted M2 is constructed by summing savings deposits (before May 2020), small-denomination time deposits, and retail MMFs, each seasonally adjusted separately, and adding this result to seasonally adjusted M1.
Here is the “M2 Money Stock” (seasonally adjusted) chart, updated on December 27, 2022, depicting data through November 2022, with a value of $21,351.6 Billion:
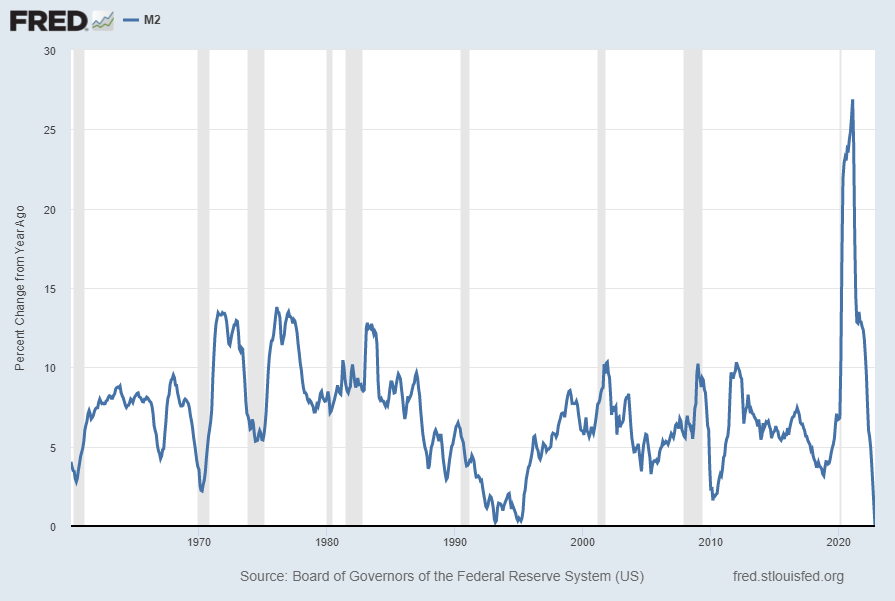
Here is the “M2 Money Stock” chart on a “Percent Change From Year Ago” basis, with a current value of 0%:
Data Source: Board of Governors of the Federal Reserve System (US), M2 Money Stock [M2SL], retrieved from FRED, Federal Reserve Bank of St. Louis; accessed December 27, 2022: https://fred.stlouisfed.org/series/M2SL
_____
The Special Note summarizes my overall thoughts about our economic situation
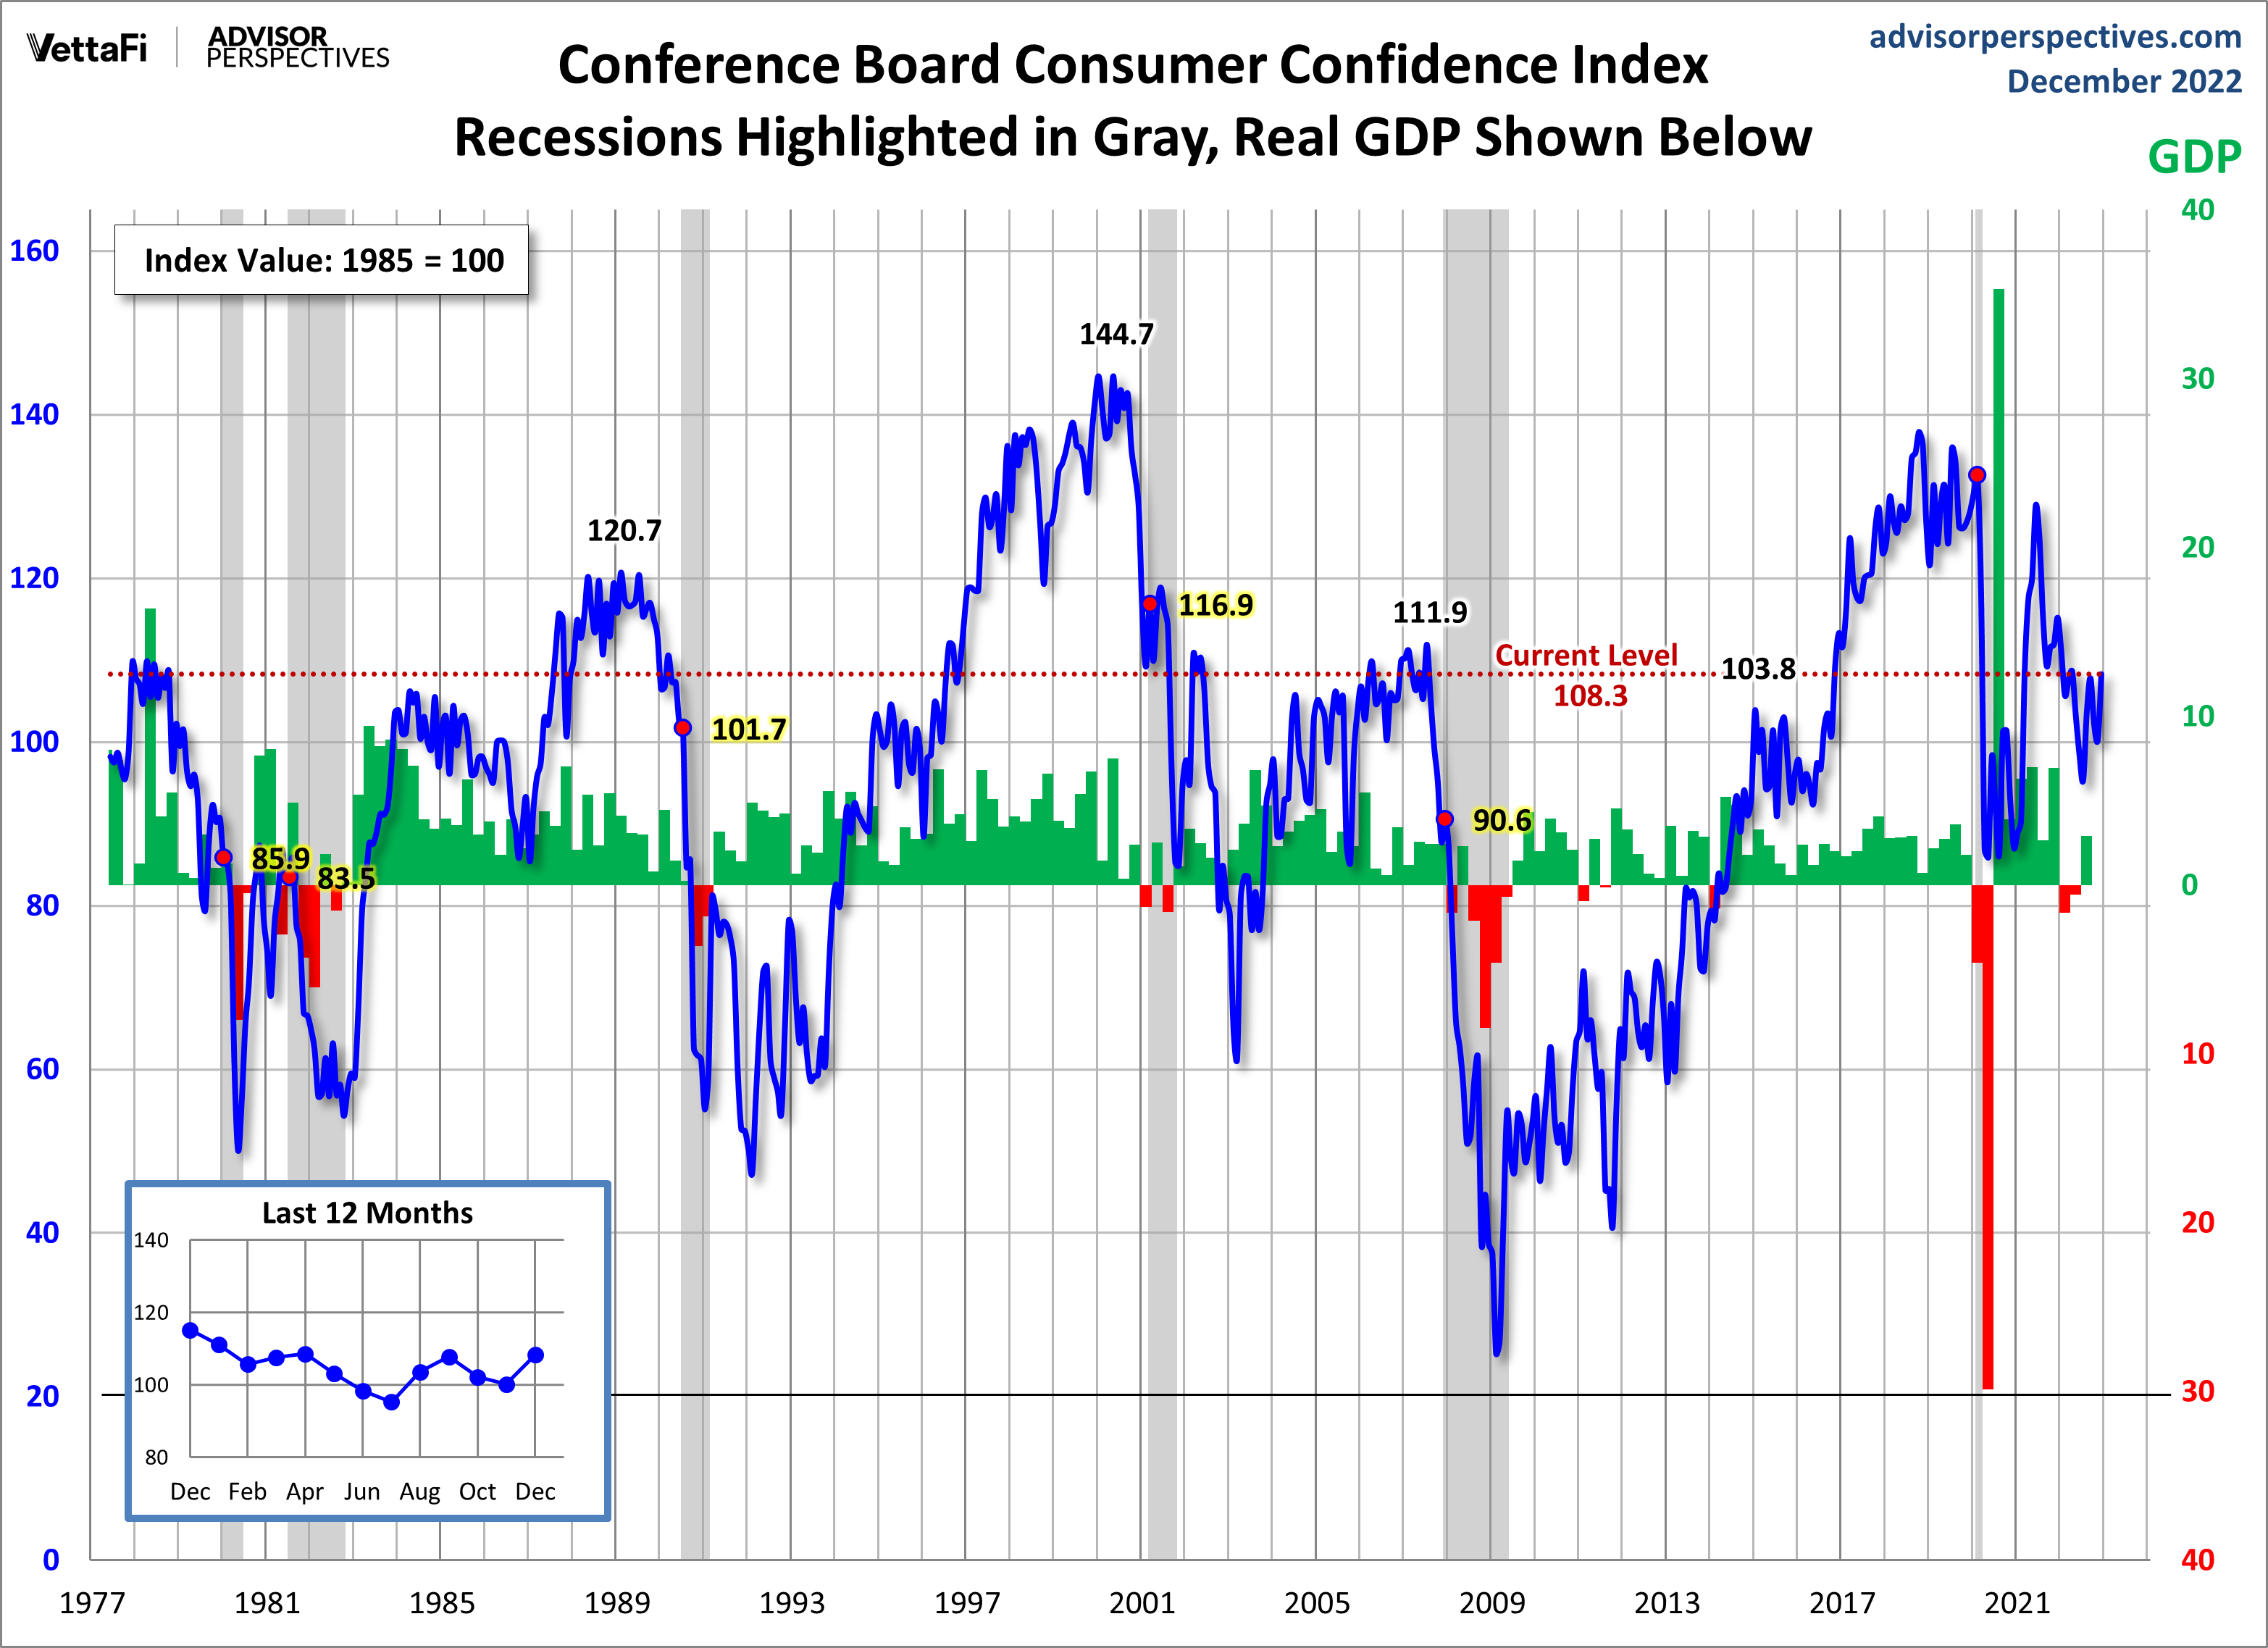
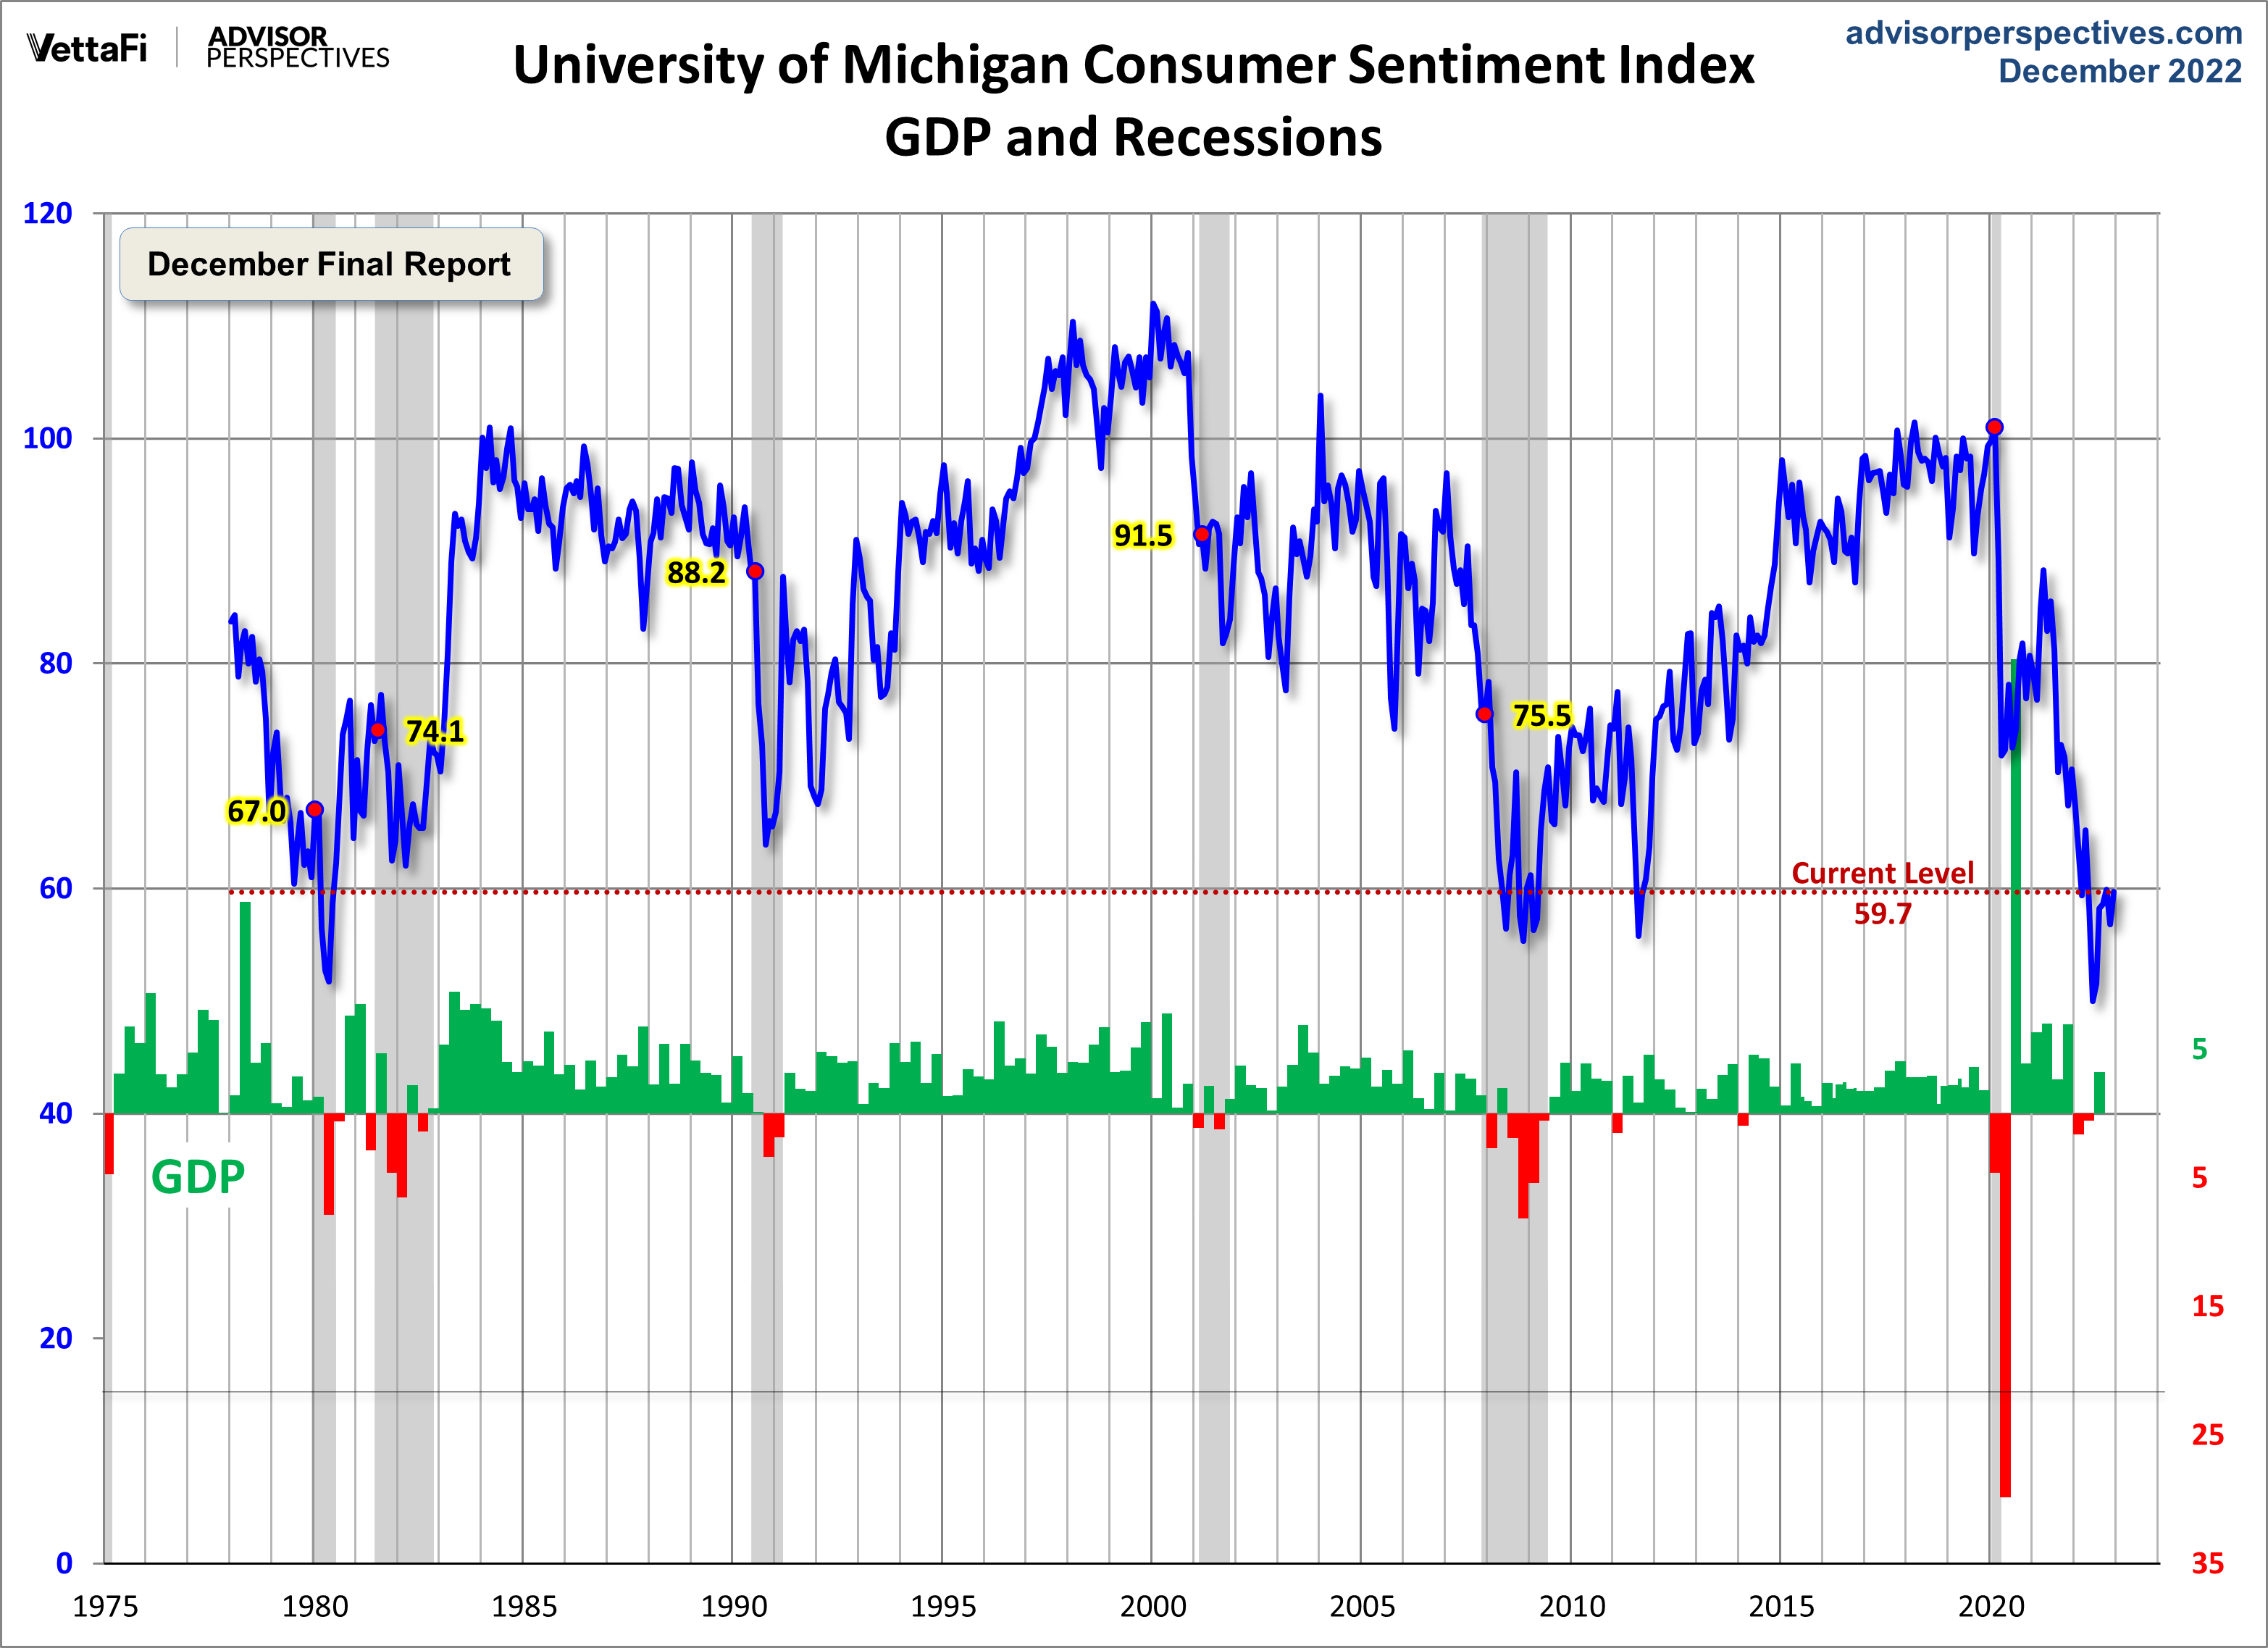
Advisor Perspectives had a post of December 23, 2022 (“Michigan Consumer Sentiment Up 5% in December“) that displays the latest Conference Board Consumer Confidence and University of Michigan Consumer Sentiment Index charts. They are presented below:
(click on charts to enlarge images)
–
–
While I don’t believe that confidence surveys should be overemphasized, I find these readings and trends to be notable, especially in light of a variety of other highly disconcerting measures highlighted throughout this site.
_____
The Special Note summarizes my overall thoughts about our economic situation
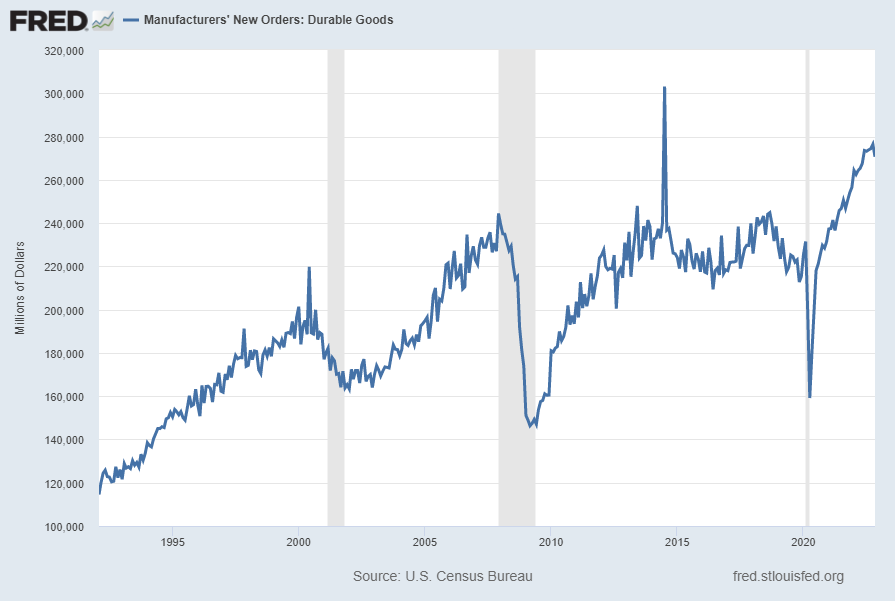
Many people place emphasis on Durable Goods New Orders as a prominent economic indicator and/or leading economic indicator.
For reference, below are two charts depicting this measure.
First, from the St. Louis Fed site (FRED), a chart through November 2022, updated on December 23, 2022. This value is $270,644 ($ Millions):
(click on charts to enlarge images)
–
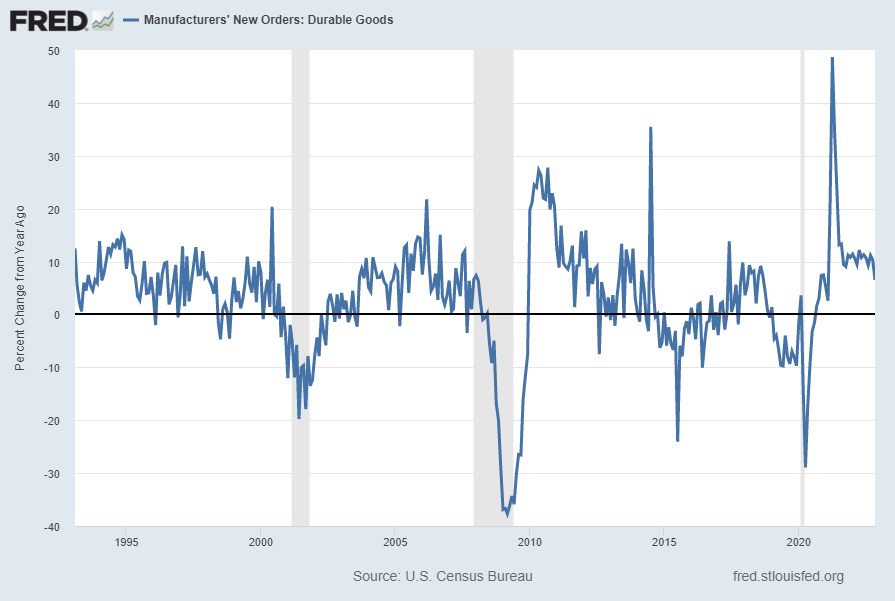
Second, here is the chart depicting this measure on a “Percent Change from a Year Ago” basis, with a last value of 6.5%:
Data Source: FRED, Federal Reserve Economic Data, Federal Reserve Bank of St. Louis: Manufacturers’ New Orders: Durable Goods [DGORDER]; U.S. Department of Commerce: Census Bureau; accessed December 23, 2022; http://research.stlouisfed.org/fred2/series/DGORDER
_________
I post various indicators and indices because I believe they should be carefully monitored. However, as those familiar with this site are aware, I do not necessarily agree with what they depict or imply.
_____
The Special Note summarizes my overall thoughts about our economic situation
Perhaps the main reason that I write of our economic situation is that I continue to believe, based upon various analyses, that our economic situation is in many ways misunderstood. While no one likes to contemplate a future rife with economic adversity, current and future economic problems must be properly recognized and rectified if high-quality, sustainable long-term economic vitality is to be realized.
There are an array of indications and other “warning signs” – many readily apparent – that current economic activity and financial market performance is accompanied by exceedingly perilous dynamics.
I have written extensively about this peril, including in the following:
My analyses continues to indicate that the growing level of financial danger will lead to the next stock market crash that will also involve (as seen in 2008) various other markets as well. Key attributes of this next crash is its outsized magnitude (when viewed from an ultra-long term historical perspective) and the resulting economic impact. This next financial crash is of tremendous concern, as my analyses indicate it will lead to a Super Depression – i.e. an economy characterized by deeply embedded, highly complex, and difficult-to-solve problems.
For long-term reference purposes, here is a chart of the Dow Jones Industrial Average since 1900, depicted on a monthly basis using a LOG scale (updated through December 21, 2022, with a last value of 33,376.48):
(click on chart to enlarge image)(chart courtesy of StockCharts.com)
_____
The Special Note summarizes my overall thoughts about our economic situation
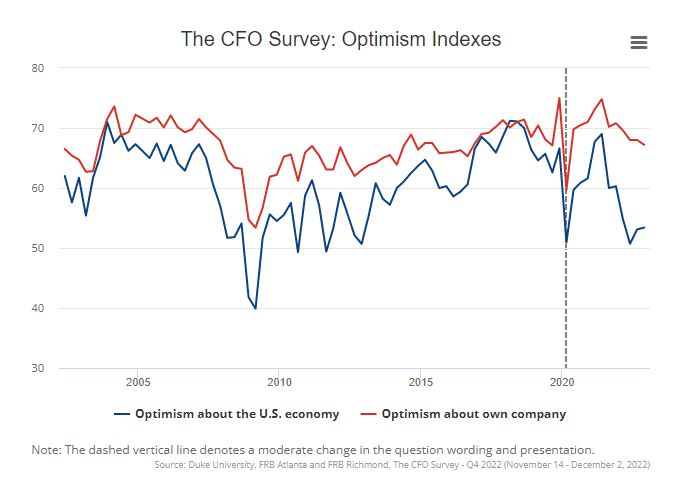
On December 21, 2022 The CFO Survey (formerly called the “Duke/CFO Global Business Outlook”) was released. It contains a variety of statistics regarding how CFOs view business and economic conditions.
In this CFO Survey press release, I found the following to be the most notable excerpts – although I don’t necessarily agree with them:
CFO optimism about the U.S. economy remains at 53 on a scale of 0 to 100, the same as last quarter but well below the historic average of about 60. And CFOs expect real GDP to grow by only 0.7 percent in 2023, with 31 percent of CFOs expecting negative real growth. Also, CFOs anticipate their companies’ revenues to grow by only 5 percent in 2023, which is down from last quarter’s 2023 forecast and also less than anticipated 2022 revenue growth.
About two-thirds of CFOs report that current interest rates have not affected their capital expenditures or non-capital spending plans, while about 30 percent say that rates have already dampened spending plans. Nearly 40 percent say they either have already curtailed spending plans or would curtail spending should interest rates increase by another two percentage points.
This CFO Survey contains an Optimism Index chart, with the blue line showing U.S. Optimism (with regard to the economy) at 53.4, as seen below:
—
It should be interesting to see how well the CFOs predict business and economic conditions going forward. I discussed past various aspects of this, and the importance of these predictions, in the July 9, 2010 post titled “The Business Environment”.
(past posts on CEO and CFO surveys can be found under the “CFO and CEO Confidence” label)
_____
I post various economic forecasts because I believe they should be carefully monitored. However, as those familiar with this site are aware, I do not necessarily agree with many of the consensus estimates and much of the commentary in these forecast surveys.
_____
The Special Note summarizes my overall thoughts about our economic situation
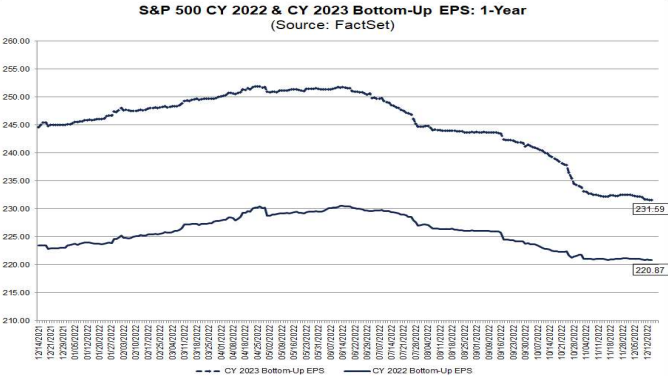
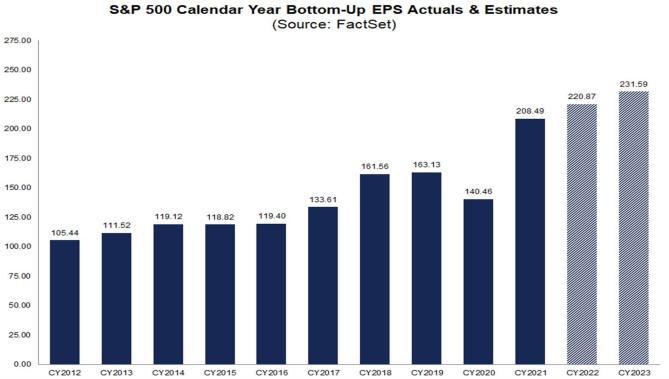
FactSet publishes a report titled “Earnings Insight” that contains a variety of information including the trends and expectations of S&P500 earnings.
For reference purposes, here are two charts as seen in the “Earnings Insight” report of December 15, 2022:
from page 30:
(click on charts to enlarge images)
from page 31:
_____
I post various economic forecasts because I believe they should be carefully monitored. However, as those familiar with this site are aware, I do not agree with many of the consensus estimates and much of the commentary in these forecast surveys.
_____
The Special Note summarizes my overall thoughts about our economic situation
As many are aware, Refinitiv publishes earnings estimates for the S&P500. (My other posts concerning S&P earnings estimates can be found under the S&P500 Earnings label)
The following estimates are from Exhibit 24 of the “S&P500 Earnings Scorecard” (pdf) of December 9, 2022, and represent an aggregation of individual S&P500 component “bottom up” analyst forecasts. For reference, the Year 2014 value is $118.78/share; the Year 2015 value is $117.46/share; the Year 2016 value is $118.10/share; the Year 2017 value is $132.00/share; the Year 2018 value is $161.93/share; the Year 2019 value is $162.93/share; the Year 2020 value is $139.72/share; and the year 2021 value is $208.12:
Year 2022 estimate:
$220.40/share
Year 2023 estimate:
$231.14/share
Year 2024 estimate:
$254.29/share
_____
I post various economic forecasts because I believe they should be carefully monitored. However, as those familiar with this site are aware, I do not agree with many of the consensus estimates and much of the commentary in these forecast surveys.
_____
The Special Note summarizes my overall thoughts about our economic situation
As many are aware, Standard & Poor’s publishes earnings estimates for the S&P500. (My posts concerning their estimates can be found under the S&P500 Earnings label)
For reference purposes, the most current estimates are reflected below, and are as of December 15, 2022:
Year 2022 estimates add to the following:
-From a “bottom up” perspective, operating earnings of $200.49/share
-From a “bottom up” perspective, “as reported” earnings of $181.14/share
Year 2023 estimates add to the following:
-From a “bottom up” perspective, operating earnings of $227.16/share
-From a “bottom up” perspective, “as reported” earnings of $203.75/share
_____
I post various economic forecasts because I believe they should be carefully monitored. However, as those familiar with this site are aware, I do not agree with many of the consensus estimates and much of the commentary in these forecast surveys.
_____
The Special Note summarizes my overall thoughts about our economic situation
The December 2022 Livingston Survey (pdf) published on December 16, 2022 contains, among its various forecasts, a S&P500 forecast. It shows the following price forecast for the dates shown:
Dec. 30, 2022 3970.0
June 30, 2023 3927.4
Dec. 29, 2023 4170.0
Dec. 31, 2024 4321.8
These figures represent the median value across the forecasters on the survey’s panel.
_____
I post various economic forecasts because I believe they should be carefully monitored. However, as those familiar with this site are aware, I do not agree with many of the consensus estimates and much of the commentary in these forecast surveys.
_____
The Special Note summarizes my overall thoughts about our economic situation
Business Roundtable today released its Q4 2022 CEO Economic Outlook Survey, a composite index of CEO plans for capital spending and employment and expectations for sales over the next six months. The overall Index declined 11 points from last quarter to 73, which is the first time it has dipped below its long-run average of 84 since Q3 2020. The Index remains above the expansion or contraction threshold of 50.
also:
In their first estimate of 2023 U.S. GDP growth, CEOs projected 1.2% growth for the year. CEOs were also asked to identify the greatest cost pressure facing their company, a question posed every fourth quarter since 2003. Forty-nine percent of Business Roundtable CEOs identified labor costs as the top cost pressure, followed by 15% who identified material costs and 14% who identified supply chain disruption costs. Other top cost pressures included energy and regulatory costs.
On October 13, 2022, The Conference Board released the Q4 2022 Measure Of CEO Confidence. The overall measure of CEO Confidence was at 32, down from the previous reading of 34. [note: a reading of more than 50 points reflects more positive than negative responses]
Notable excerpts from this October 13, 2022 Press Release include:
The recent survey asked CEOs to describe the economic conditions they are preparing to face over the next 12-18 months. An overwhelming majority—98%—said they were preparing for a US recession. Moreover, 99% of CEOs said they were preparing for an EU recession.
also:
Current Conditions
CEOs’ assessment of general economic conditions deteriorated further to start Q4:
About 5% of CEOs reported economic conditions were better compared to six months ago, compared to 6% in Q3.
81% said conditions were worse, up from 77%.
CEOs remained pessimistic about conditions in their own industries to start Q4:
15% of CEOs reported that conditions in their industries were better compared to six months ago, down from 25%.
52% said conditions in their own industries were worse, up from 48%.
Future Conditions
CEOs’ expectations about the short-term economic outlook weakened to start Q4:
Just 5% of CEOs said they expected economic conditions to improve over the next six months, down from 7% in Q3.
74% expected conditions to worsen, up from 73%.
CEOs’ expectations regarding short-term prospects in their own industries also weakened to start Q4:
19% of CEOs expected conditions in their own industry to improve over the next six months, down from 20%.
54% expect conditions to worsen, up from 48%.
_____
Additional details can be seen in the sources mentioned above.
_____
I post various economic forecasts because I believe they should be carefully monitored. However, as those familiar with this site are aware, I do not necessarily agree with many of the consensus estimates and much of the commentary in these forecast surveys.
_____
The Special Note summarizes my overall thoughts about our economic situation