Thursday, January 31, 2019

Jerome Powell’s January 30, 2019 Press Conference – Notable Aspects

On Wednesday, January 30, 2019 Jerome Powell gave his scheduled January 2019 FOMC Press Conference. (link of video and related materials)
Below are Jerome Powell’s comments I found most notable – although I don’t necessarily agree with them – in the order they appear in the transcript.  These comments are excerpted from the “Transcript of Chairman Powell’s Press Conference“ (preliminary)(pdf) of January 30, 2019, with the accompanying “FOMC Statement.
From Chairman Powell’s opening comments:
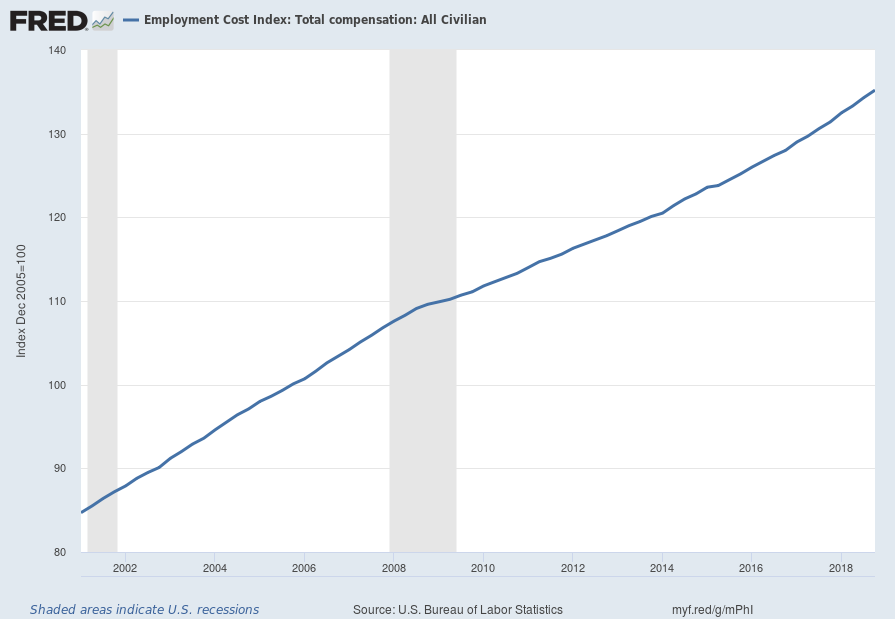
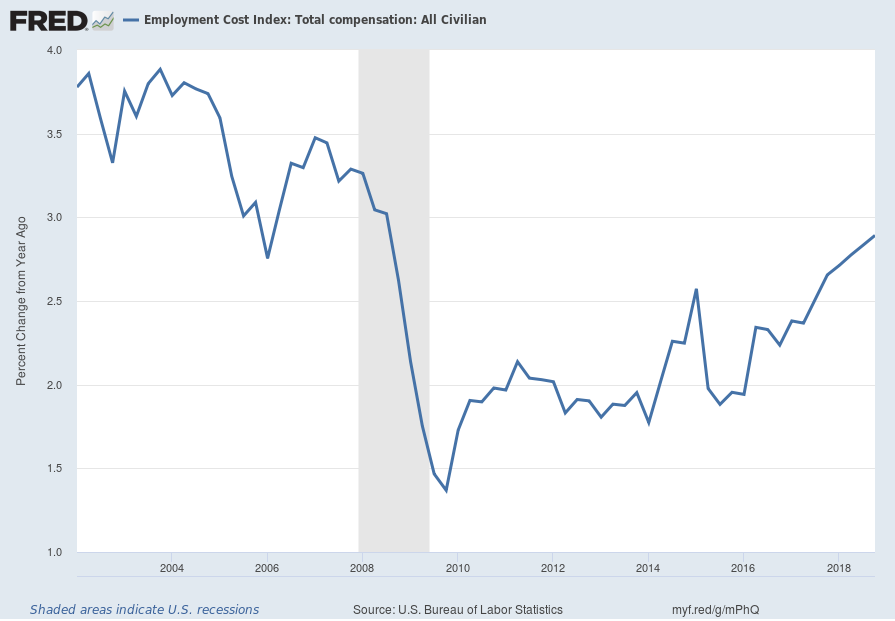
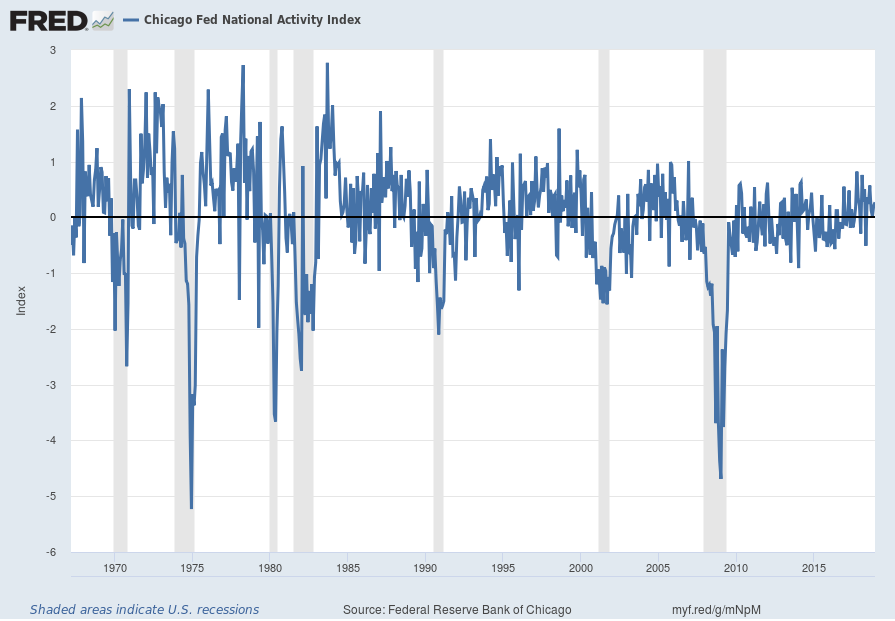
CHAIRMAN POWELL: Good afternoon, everyone, and welcome. I will start with a recap of our discussions, including our assessment of the outlook for the economy, and the judgments we made about our interest rate policy and our balance sheet. I will cover the decisions we made today, as well as our ongoing discussions of matters on which we expect to make decisions in coming meetings. My colleagues and I have one overarching goal: to sustain the economic expansion, with a strong job market and stable prices, for the benefit of the American people. The U.S. economy is in a good place, and we will continue to use our monetary policy tools to help keep it there. The jobs picture continues to be strong, with the unemployment rate near historic lows and with stronger wage gains. Inflation remains near our 2 percent goal. We continue to expect that the American economy will grow at a solid pace in 2019, although likely slower than the very strong pace of 2018. We believe that our current policy stance is appropriate at this time. 
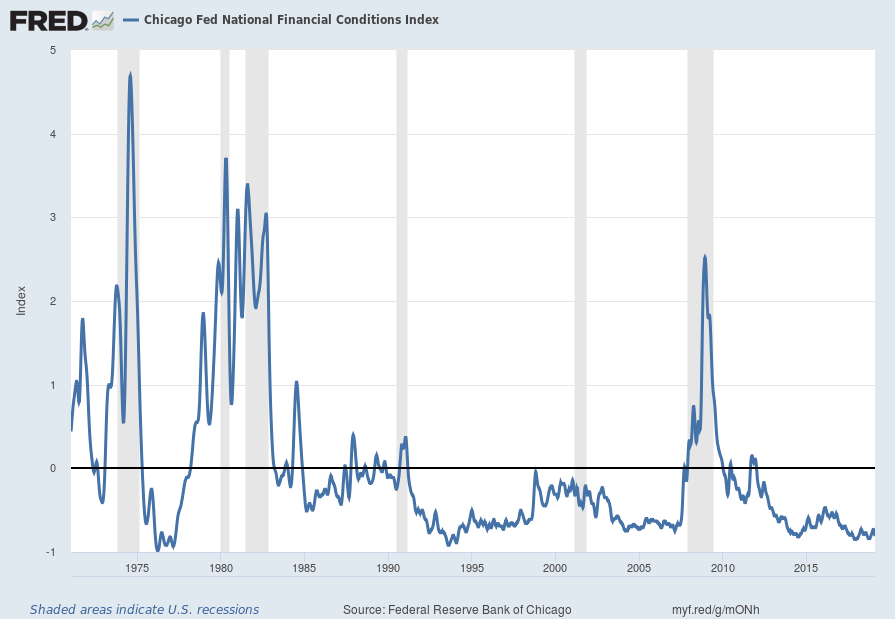
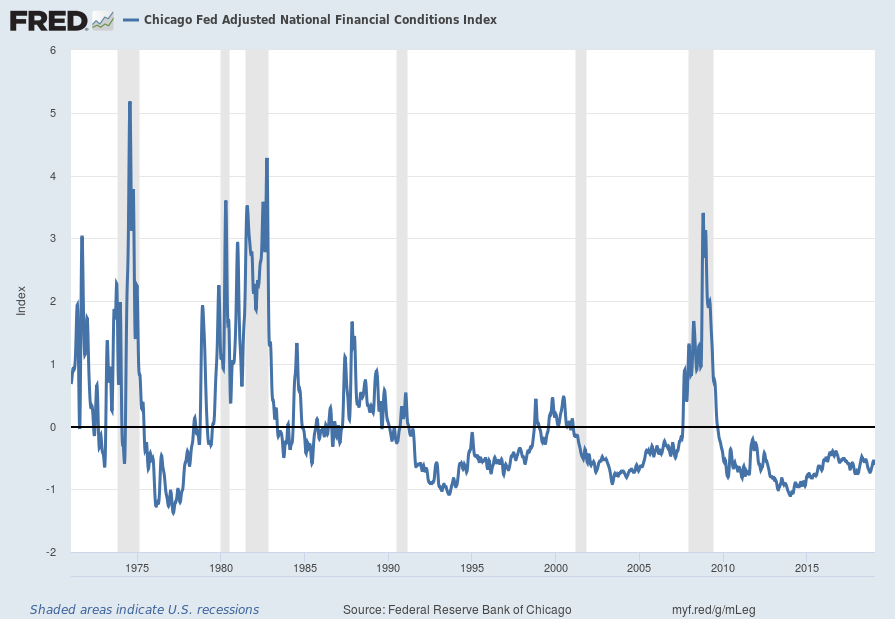
Despite this positive outlook, over the past few months we have seen some cross-currents and conflicting signals about the outlook. Growth has slowed in some major foreign economies, particularly China and Europe. There is elevated uncertainty around several unresolved government policy issues, including Brexit, ongoing trade negotiations, and the effects from the partial government shutdown in the United States. Financial conditions tightened considerably late in 2018, and remain less supportive of growth than they were earlier in 2018. And, while most of the incoming domestic economic data have been solid, some surveys of business and consumer sentiment have moved lower, giving reason for caution.
also:
In addition, the case for raising rates has weakened somewhat. The traditional case for rate increases is to protect the economy from risks that arise when rates are too low for too long, particularly the risk of too-high inflation. Over the past few months, that risk appears to have diminished. Inflation readings have been muted, and the recent drop in oil prices is likely to push headline inflation lower still in coming months. Further, as we noted in our post-meeting statement, while survey-based measures of inflation expectations have been stable, financial market measures of inflation compensation have moved lower. Similarly, the risk of financial imbalances appears to have receded, as a number of indicators that showed elevated levels of financial risk appetite last fall have moved closer to historical norms. 
In this environment, we believe we can best support the economy by being patient in evaluating the outlook before making any future adjustment to policy.
Jerome Powell’s responses as indicated to the various questions:
HEATHER LONG. Heather Long from the Washington Post. Last week, the IMF said risks are clearly skewed to the downside for the U.S. and global economy. Can you clarify, does the FOMC see risks as skewed to the downside, particularly after you removed the statement about risk being balanced? 
CHAIRMAN POWELL. We had an extensive discussion of the baseline and also of the risks to the baseline and the risks are of course the fact that financial conditions have tightened, that global growth has slowed, as well as some, let’s say, government related risks like Brexit and trade discussions and also the effects and ultimate disposition of the shutdown. So we looked at – we look at those. And the way we think of it is that policy, we will use our policy and we have to offset risks to the baseline. So we view the baseline as still solid and part of that is the way we adjusted our baseline to address those risks. So that’s the way we’re thinking about that now. 
also:
STEVE LIESMAN. Steve Liesman, CNBC. Mr. Chairman, did the Committee discuss an actual change to the runoff policy or the runoff schedule right now? If so, is that under consideration right now and when might we know? The second thing is, I have to nail down this thing. You guys, Fed folks, keep mentioning the market average or the market outlook for the size of the balance sheet. Are you endorsing the market average, which is 3-1/2 trillion? And if you’re not endorsing it, why do you keep mentioning it? 
CHAIRMAN POWELL. Okay. So, today I’m here to talk about decisions and also discussions about decisions that haven’t been made. So we’re talking about the latter thing, which is discussions and so I can’t get ahead of where decisions are. But so the Committee is — what we’re looking to do is create a whole plan that will bring us to our goal, our longer run goal which is a balance sheet no larger than it needs to be for us to efficiently conduct — efficiently and effectively conduct monetary policy, but to do so in a way that doesn’t put our goals at risk or result in unnecessary market turmoil. So there are a lot of pieces to that and we’ve learned over time that it’s — when making these — when designing these plans, like for example the original normalization plan, it’s good to take your time. Let the best ideas rise to the top. Let them stand the test of time and argument and then move when you’re really comfortable with what you’ve got and when you feel you can communicate it clearly. So I don’t want to get ahead of that process today. 
So we’ve discussed — there are a number of pieces to that puzzle. There are several different pieces to them and I think they’re coming and I’m very pleased with the progress that we’ve made and, you know, the piece that you mentioned is something that is in those discussions. That’s the first question. I’m not going to give our estimate or ratify anybody else’s estimate of what the equilibrium balance sheet is here today. There are estimates out there but I’m not at a point today where I’m going to be giving out numbers on that. But there are estimates and I think they’re consistent with what I said, broadly speaking.
also:
BINYAMIN APPELBAUM. Binyamin Appelbaum, New York Times. I am struggling a little bit to understand what has changed since we sat here with you six weeks ago. You’ve said today that you think that inflation would be the reason that the Fed would need to continue raising rates. Has the inflation outlook shifted that dramatically in the last six weeks? Can you speak specifically to why you’ve moved from a posture of saying we expect to keep raising rates this year to a posture of standing still? 
CHAIRMAN POWELL. I’d point to a couple of things. First, the narrative of slowing global growth continues, if you will. The incoming data have shown more of that. We’ve seen that both in China and in Western Europe, and so that’s an important — that has important implications for us and that story has — let’s just say it continues. 
And in addition — I mean, I think important — possibly less important now, probably less important now but has been the shutdown, which will leave some sort of imprint on first quarter GDP. We don’t know the ultimate resolution of it. If that’s all there is and the shutdown is gone and there isn’t another shutdown, then we’ll get most of that back in the second period — second quarter. 
So those things — in addition, you know, you have to look back. Financial conditions began to tighten in the fourth quarter and they now have persisted and remain tighter — significantly tighter, let’s say — than they were and that’s something that we have to take into account as well. So that’s where we are. 
also:
EDWARD LAWRENCE. Edward Lawrence from FOX Business News, thank you Mr. Chairman. The long-term federal funds rate is 2.8 percent. I’ve talked in the last year with a number of Fed presidents who worry that under 3 percent is not enough to handle the next recession. You say that’s your first tool. That’s your primary means of adjusting monetary policy. So with a larger balance sheet — with a larger balance sheet, could you — how could you handle that next recession then with the combination of those two? 
CHAIRMAN POWELL. I guess the sense of your question is that we could be in a situation in the future — we hope not — but we could be in a situation where we’d like to cut rates more than we can effectively and we hit the zero lower bound. We don’t think anything like that is in the cards. Now there’s no reason to think that it would be. But, as we said in today’s release, if that happens, then we’ll use the full range of our tools and that includes the balance sheet. But we would use it after using our conventional tools, which would be the interest rate and forward guidance about the interest rate. 
EDWARD LAWRENCE. Even if you have a large balance sheet, 4 trillion? Above four trillion? 
CHAIRMAN POWELL. Yes. There would be room to do substantially more. 
also:
COURTENAY BROWN. Hi, Mr. Chairman. Courtenay Brown from Axios. A data dependency question, has there been a prioritization of market data over the economic data? How do you balance those two things? 
CHAIRMAN POWELL. I would say that, you know, our mandate is maximum employment and stable prices and that’s about, you know, hard, real-side economic data. As I mentioned earlier, we — our tool, you know, our interest rate tool operates on the economy through financial conditions. 
So financial conditions matter and they matter in the way that I suggested earlier, which is to say broad financial conditions changing over a sustained period, that has implications for the macro economy — it does. So if you lower interest rates and they stay low, every borrower in the country ultimately has a lower interest rate. That will have an effect on — over time — an effect on the economy. But again, the entire focus we have is on maximum employment and stable prices, not on any particular financial market or financial conditions generally. 
_____
_____
The Special Note summarizes my overall thoughts about our economic situation
SPX at 2699.90 as this post is written

Employment Cost Index (ECI) – Fourth Quarter 2018

While the concept of Americans’ incomes can be defined in a number of ways, many prominent measures continue to show disconcerting trends.
One prominent measure is the Employment Cost Index (ECI).
Here is a description from the BLS document titled “The Employment Cost Index:  what is it?“:
The Employment Cost Index (ECI) is a quarterly measure of the change in the price of labor, defined as compensation per employee hour worked. Closely watched by many economists, the ECI is an indicator of cost pressures within companies that could lead to price inflation for finished goods and services. The index measures changes in the cost of compensation not only for wages and salaries, but also for an extensive list of benefits. As a fixed-weight, or Laspeyres, index, the ECI controls for changes occurring over time in the industrial-occupational composition of employment.
On January 31, 2019, the ECI for the fourth quarter was released.  Here are two excerpts from the BLS release titled “Employment Cost Index – December 2018“:
Compensation costs for civilian workers increased 0.7 percent, seasonally adjusted, for the 3-month period ending in December 2018, the U.S. Bureau of Labor Statistics reported today. Wages and salaries (which make up about 70 percent of compensation costs) increased 0.6 percent and benefit costs (which make up the remaining 30 percent of compensation) increased 0.7 percent from September 2018. (See tables A, 1, 2, and 3.)
also:
Compensation costs for civilian workers increased 2.9 percent for the 12-month period ending in December 2018 compared with a compensation costs increase of 2.6 percent in December 2017. Wages and salaries increased 3.1 percent for the 12-month period ending in December 2018 and increased 2.5 percent for the 12-month period ending in December 2017. Benefit costs increased 2.8 percent for the 12-month period ending in December 2018. In December 2017, the increase was 2.5 percent. (See tables A, 4, 8, and 12.)
Below are three charts, updated on January 31, 2019 that depict various aspects of the ECI, which is seasonally adjusted (SA):
The first depicts the ECI, with a value of 135.2:
ECIALLCIV chart
source: US. Bureau of Labor Statistics, Employment Cost Index: Total compensation: All Civilian[ECIALLCIV], retrieved from FRED, Federal Reserve Bank of St. Louis, accessed January 31, 2019:
https://research.stlouisfed.org/fred2/series/ECIALLCIV/
The second chart depicts the ECI on a “Percent Change from Year Ago” basis, with a value of 2.9%:
ECIALLCIV Percent Change From Year Ago
The third chart depicts the ECI on a “Percent Change” (from last quarter) basis, with a value of .7%:
ECI Percent Change chart
_________
I post various indicators and indices because I believe they should be carefully monitored.  However, as those familiar with this site are aware, I do not necessarily agree with what they depict or imply.
_____
The Special Note summarizes my overall thoughts about our economic situation
SPX at 2688.98 as this post is written

Wednesday, January 30, 2019

Chicago Fed National Financial Conditions Index (NFCI)

The St. Louis Fed’s Financial Stress Index (STLFSI) is one index that is supposed to measure stress in the financial system.  Its reading as of the January 24, 2019 update (reflecting data through January 18, 2019) is -.907.
Of course, there are a variety of other measures and indices that are supposed to measure financial stress and other related issues, both from the Federal Reserve as well as from private sources.
Two other indices that I regularly monitor include the Chicago Fed National Financial Conditions Index (NFCI) as well as the Chicago Fed Adjusted National Financial Conditions Index (ANFCI).
Here are summary descriptions of each, as seen in FRED:
The National Financial Conditions Index (NFCI) measures risk, liquidity and leverage in money markets and debt and equity markets as well as in the traditional and “shadow” banking systems. Positive values of the NFCI indicate financial conditions that are tighter than average, while negative values indicate financial conditions that are looser than average.
The adjusted NFCI (ANFCI). This index isolates a component of financial conditions uncorrelated with economic conditions to provide an update on how financial conditions compare with current economic conditions.
For further information, please visit the Federal Reserve Bank of Chicago’s web site:
Below are the most recently updated charts of the NFCI and ANFCI, respectively.
The NFCI chart below was last updated on January 30, 2019 incorporating data from January 8, 1971 through January 25, 2019, on a weekly basis.  The January 25 value is -.81:
NFCI
Data Source: FRED, Federal Reserve Economic Data, Federal Reserve Bank of St. Louis; accessed January 30, 2019: 
http://research.stlouisfed.org/fred2/series/NFCI
The ANFCI chart below was last updated on January 30, 2019 incorporating data from January 8, 1971 through January 25, 2019, on a weekly basis.  The January 25 value is -.57:
ANFCI
Data Source: FRED, Federal Reserve Economic Data, Federal Reserve Bank of St. Louis; accessed January 30, 2019: 
http://research.stlouisfed.org/fred2/series/ANFCI
_________
I post various indicators and indices because I believe they should be carefully monitored.  However, as those familiar with this site are aware, I do not necessarily agree with what they depict or imply.
_____
The Special Note summarizes my overall thoughts about our economic situation
SPX at 2665.84 as this post is written

Monday, January 28, 2019

Updates Of Economic Indicators January 2019

Here is an update of various indicators that are supposed to predict and/or depict economic activity. These indicators have been discussed in previous blog posts:
The January 2019 Chicago Fed National Activity Index (CFNAI) updated as of January 28, 2019:
The CFNAI, with current reading of .27:
CFNAI
source:  Federal Reserve Bank of Chicago, Chicago Fed National Activity Index [CFNAI], retrieved from FRED, Federal Reserve Bank of St. Louis, January 28, 2019;
https://fred.stlouisfed.org/series/CFNAI
The CFNAI-MA3, with current reading of .16:
CFNAIMA3
source:  Federal Reserve Bank of Chicago, Chicago Fed National Activity Index: Three Month Moving Average [CFNAIMA3], retrieved from FRED, Federal Reserve Bank of St. Louis, January 28, 2019;
https://fred.stlouisfed.org/series/CFNAIMA3
As of January 25, 2019 (incorporating data through January 18, 2019) the WLI was at 145.8 and the WLI, Gr. was at -5.3%.
A chart of the WLI,Gr., from the Doug Short’s site ECRI update post of January 25, 2019:
ECRI WLI,Gr.
Here is the latest chart, depicting the ADS Index from December 31, 2007 through January 19, 2019:
ADS Index
The Conference Board Leading (LEI), Coincident (CEI) Economic Indexes, and Lagging Economic Indicator (LAG):
As per the January 24, 2019 press release, titled “The Conference Board Leading Economic Index (LEI) for the U.S. Declined” (pdf) the LEI was at 111.7, the CEI was at 105.1, and the LAG was 106.7 in December.
An excerpt from the release:
“The US LEI declined slightly in December and the recent moderation in the LEI suggests that the US economic growth rate may slow down this year,” said Ataman Ozyildirim, Director of Economic Research at The Conference Board. “While the effects of the government shutdown are not yet reflected here, the LEI suggests that the economy could decelerate towards 2 percent growth by the end of 2019.”
Here is a chart of the LEI from the Doug Short’s site Conference Board Leading Economic Indexupdate of January 24, 2019:
Conference Board LEI
_________
I post various indicators and indices because I believe they should be carefully monitored.  However, as those familiar with this site are aware, I do not necessarily agree with what they depict or imply.
_____
The Special Note summarizes my overall thoughts about our economic situation
SPX at 2636.93 as this post is written

Thursday, January 24, 2019

Chicago Fed National Financial Conditions Index (NFCI)

The St. Louis Fed’s Financial Stress Index (STLFSI) is one index that is supposed to measure stress in the financial system.  Its reading as of the January 17, 2019 update (reflecting data through January 11, 2019) is -.841.
Of course, there are a variety of other measures and indices that are supposed to measure financial stress and other related issues, both from the Federal Reserve as well as from private sources.
Two other indices that I regularly monitor include the Chicago Fed National Financial Conditions Index (NFCI) as well as the Chicago Fed Adjusted National Financial Conditions Index (ANFCI).
Here are summary descriptions of each, as seen in FRED:
The National Financial Conditions Index (NFCI) measures risk, liquidity and leverage in money markets and debt and equity markets as well as in the traditional and “shadow” banking systems. Positive values of the NFCI indicate financial conditions that are tighter than average, while negative values indicate financial conditions that are looser than average.
The adjusted NFCI (ANFCI). This index isolates a component of financial conditions uncorrelated with economic conditions to provide an update on how financial conditions compare with current economic conditions.
For further information, please visit the Federal Reserve Bank of Chicago’s web site:
Below are the most recently updated charts of the NFCI and ANFCI, respectively.
The NFCI chart below was last updated on January 24, 2019 incorporating data from January 8, 1971 through January 18, 2019, on a weekly basis.  The January 18 value is -.78:
NFCI chart
Data Source: FRED, Federal Reserve Economic Data, Federal Reserve Bank of St. Louis; accessed January 24, 2019: 
http://research.stlouisfed.org/fred2/series/NFCI
The ANFCI chart below was last updated on January 24, 2019 incorporating data from January 8, 1971 through January 18, 2019, on a weekly basis.  The January 18 value is -.58:
ANFCI
Data Source: FRED, Federal Reserve Economic Data, Federal Reserve Bank of St. Louis; accessed January 24, 2019: 
http://research.stlouisfed.org/fred2/series/ANFCI
_________
I post various indicators and indices because I believe they should be carefully monitored.  However, as those familiar with this site are aware, I do not necessarily agree with what they depict or imply.
_____
The Special Note summarizes my overall thoughts about our economic situation
SPX at 2638.70 as this post is written

Money Supply Charts Through December 2018

For reference purposes, below are two sets of charts depicting growth in the money supply.
The first shows the MZM (Money Zero Maturity), defined in FRED as the following:
M2 less small-denomination time deposits plus institutional money funds.
Money Zero Maturity is calculated by the Federal Reserve Bank of St. Louis.
Here is the “MZM Money Stock” (seasonally adjusted) chart, updated on January 18, 2019 depicting data through December 2018, with a value of $15,753.50 Billion:
MZM money supply
Here is the “MZM Money Stock” chart on a “Percent Change From Year Ago” basis, with a current value of 3.3%:
MZMSL Percent Change From Year Ago chart
Data Source: FRED, Federal Reserve Economic Data, Federal Reserve Bank of St. Louis; accessed Janaury 24, 2019;
https://research.stlouisfed.org/fred2/series/MZMSL
The second set shows M2, defined in FRED as the following:
M2 includes a broader set of financial assets held principally by households. M2 consists of M1 plus: (1) savings deposits (which include money market deposit accounts, or MMDAs); (2) small-denomination time deposits (time deposits in amounts of less than $100,000); and (3) balances in retail money market mutual funds (MMMFs). Seasonally adjusted M2 is computed by summing savings deposits, small-denomination time deposits, and retail MMMFs, each seasonally adjusted separately, and adding this result to seasonally adjusted M1.
Here is the “M2 Money Stock” (seasonally adjusted) chart, updated on January 17, 2019, depicting data through December 2018, with a value of $14,455.1 Billion:
M2 Money Supply chart
Here is the “M2 Money Stock” chart on a “Percent Change From Year Ago” basis, with a current value of 4.5%:
M2 Money Supply Percent Change From A Year Ago chart
Data Source: FRED, Federal Reserve Economic Data, Federal Reserve Bank of St. Louis; accessed January 24, 2019;
https://research.stlouisfed.org/fred2/series/M2SL
_____
The Special Note summarizes my overall thoughts about our economic situation
SPX at 2638.70 as this post is written

Wednesday, January 23, 2019

The U.S. Economic Situation – January 23, 2019 Update

Perhaps the main reason that I write of our economic situation is that I continue to believe, based upon various analyses, that our economic situation is in many ways misunderstood.  While no one likes to contemplate a future rife with economic adversity, current and future economic problems must be properly recognized and rectified if high-quality, sustainable long-term economic vitality is to be realized.
There are an array of indications and other “warning signs” – many readily apparent – that current economic activity and financial market performance is accompanied by exceedingly perilous dynamics.
I have written extensively about this peril, including in the following:
Building Financial Danger” (ongoing updates)
My analyses continues to indicate that the growing level of financial danger will lead to the next stock market crash that will also involve (as seen in 2008) various other markets as well.  Key attributes of this next crash is its outsized magnitude (when viewed from an ultra-long term historical perspective) and the resulting economic impact.  This next financial crash is of tremendous concern, as my analyses indicate it will lead to a Super Depression – i.e. an economy characterized by deeply embedded, highly complex, and difficult-to-solve problems.
For long-term reference purposes, here is a chart of the Dow Jones Industrial Average since 1900, depicted on a monthly basis using a LOG scale (updated through January 18, 2019, with a last value of 24706.35):
(click on chart to enlarge image)(chart courtesy of StockCharts.com)
DJIA price chart since 1900
_____
The Special Note summarizes my overall thoughts about our economic situation
SPX at 2632.90 as this post is written

Trends Of S&P500 Earnings Forecasts

S&P500 earnings trends and estimates are a notably important topic, for a variety of reasons, at this point in time.
FactSet publishes a report titled “Earnings Insight” that contains a variety of information including the trends and expectations of S&P500 earnings.
For reference purposes, here are two charts as seen in the “Earnings Insight” (pdf) report of January 18, 2019:
from page 23:
(click on charts to enlarge images)
S&P500 EPS forecasts
from page 24:
S&P500 historical EPS
_____
I post various economic forecasts because I believe they should be carefully monitored.  However, as those familiar with this site are aware, I do not agree with many of the consensus estimates and much of the commentary in these forecast surveys.
_____
The Special Note summarizes my overall thoughts about our economic situation
SPX at 2632.90 as this post is written

Tuesday, January 22, 2019

S&P500 EPS Forecasts For Years Of 2018 2019 2020

As many are aware, Thomson Reuters publishes earnings estimates for the S&P500.  (My other posts concerning S&P earnings estimates can be found under the S&P500 Earnings label)
The following estimates are from Exhibit 24 of the “S&P500 Earnings Scorecard” (pdf) of January 22, 2019, and represent an aggregation of individual S&P500 component “bottom up” analyst forecasts.  For reference, the Year 2014 value is $118.78/share, the Year 2015 value is $117.46, the Year 2016 value is $118.10/share, and the Year 2017 value is $132.00/share:
Year 2018 estimate:
$161.55/share
Year 2019 estimate:
$171.29/share
Year 2020 estimate:
$190.27/share
_____
I post various economic forecasts because I believe they should be carefully monitored.  However, as those familiar with this site are aware, I do not agree with many of the consensus estimates and much of the commentary in these forecast surveys.
_____
The Special Note summarizes my overall thoughts about our economic situation
SPX at 2627.61 as this post is written