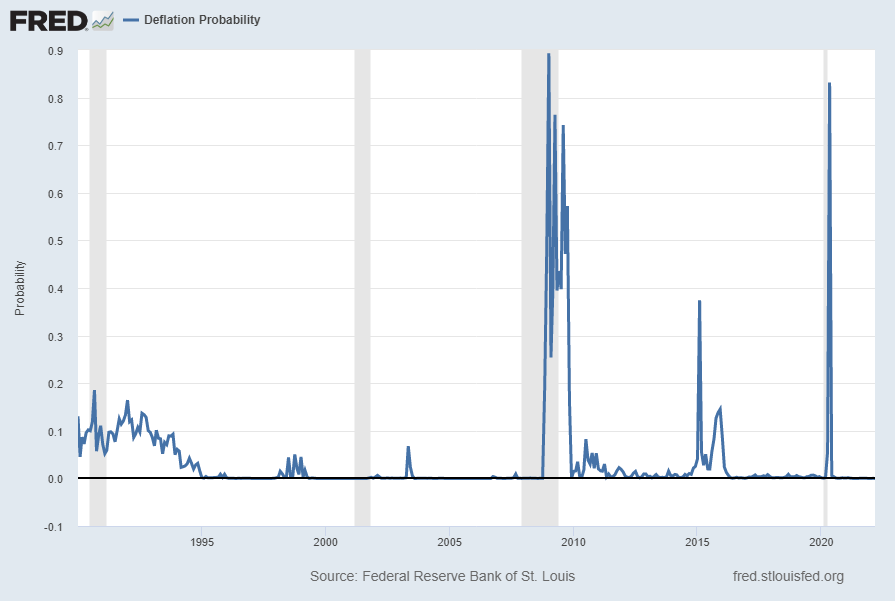
For reference, below is a chart of the St. Louis Fed Price Pressures Measures – Deflation Probability [FRED STLPPMDEF] through March 2022.
While I do not necessarily agree with the current readings of the measure, I view this as a proxy of U.S. deflation probability.
A description of this measure, as seen in FRED:
This series measures the probability that the personal consumption expenditures price index (PCEPI) inflation rate (12-month changes) over the next 12 months will fall below zero.
The chart, on a monthly basis from January 1990 – March 2022, with a last reading of .00000, last updated on March 31, 2022:
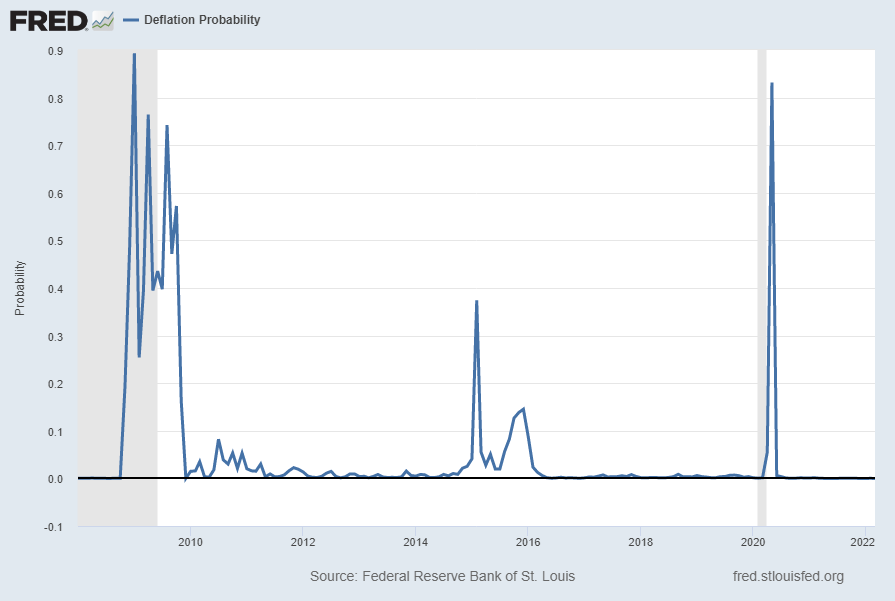
Here is this same U.S. deflation probability measure since 2008:
source: Federal Reserve Bank of St. Louis, Deflation Probability [STLPPMDEF], retrieved from FRED, Federal Reserve Bank of St. Louis; accessed March 31, 2022: https://fred.stlouisfed.org/series/STLPPMDEF
_________
I post various economic indicators and indices because I believe they should be carefully monitored. However, as those familiar with this site are aware, I do not necessarily agree with what they depict or imply.
_____
The Special Note summarizes my overall thoughts about our economic situation
On March 30, 2022 the latest CFO Survey (formerly called the “Duke/CFO Global Business Outlook”) was released. It contains a variety of statistics regarding how CFOs view business and economic conditions.
In this CFO Survey press release, I found the following to be the most notable excerpts – although I don’t necessarily agree with them:
Optimism about the U.S. economy among CFOs fell in the first quarter of 2022, according to The CFO Survey, a collaboration of Duke University’s Fuqua School of Business and the Federal Reserve Banks of Richmond and Atlanta. Alongside the decline in optimism, expectations of firms for real GDP growth and stock market appreciation both softened. CFOs indicated that their most pressing concerns are around cost pressure and inflation, supply chains, and the availability and quality of labor. Geopolitical risk also entered the list of top concerns.
When asked to rate optimism about the overall U.S. economy on a scale from 0 to 100, the average rating from CFOs was 54.8, well down from the 60.3 reading in the fourth quarter of 2021. Optimism for their own firms’ financial prospects remained relatively unchanged: on average, optimism edged down to 69.6 from the fourth quarter reading of 70.8.
This CFO Survey contains an Optimism Index chart, with the blue line showing U.S. Optimism (with regard to the economy) at 54.8, as seen below:
—
It should be interesting to see how well the CFOs predict business and economic conditions going forward. I discussed past various aspects of this, and the importance of these predictions, in the July 9, 2010 post titled “The Business Environment”.
(past posts on CEO and CFO surveys can be found under the “CFO and CEO Confidence” label)
_____
I post various economic forecasts because I believe they should be carefully monitored. However, as those familiar with this site are aware, I do not necessarily agree with many of the consensus estimates and much of the commentary in these forecast surveys.
_____
The Special Note summarizes my overall thoughts about our economic situation
In the last post (“4th Quarter 2021 Corporate Profits“) I displayed, for reference purposes, a long-term chart depicting Corporate Profits After Tax.
There are many ways to view this measure, both on an absolute as well as relative basis.
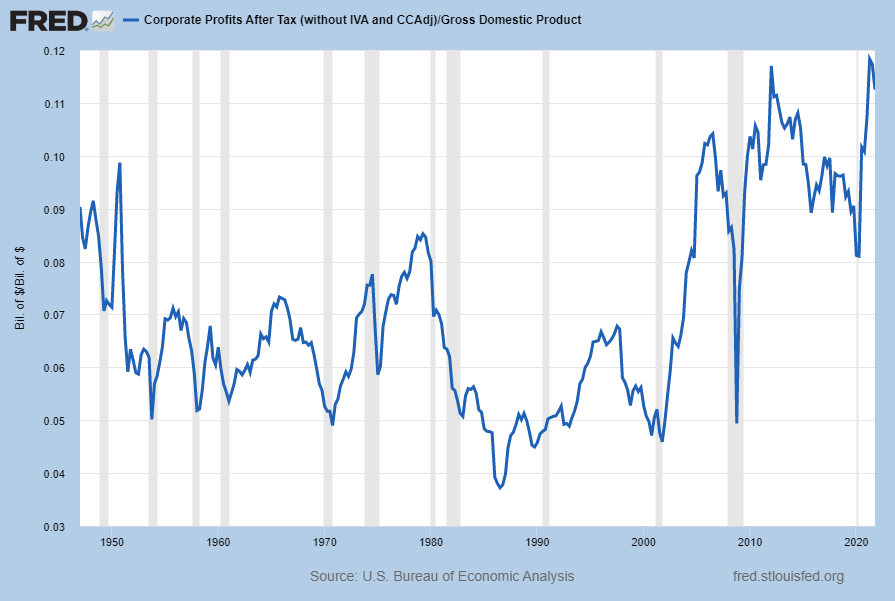
One relative measure is viewing Corporate Profits as a Percentage of GDP. I feel that this metric is important for a variety of reasons. As well, the measure is important to a variety of parties, including investors, businesses, and government policy makers.
As one can see from the long-term chart below (updated through the fourth quarter), (After Tax) Corporate Profits as a Percentage of GDP is still at levels that can be seen as historically high. While there are many reasons as to why this is so, from a going-forward standpoint I think it is important to recognize both that such a notable condition exists, as well as contemplate and/or plan for such factors and conditions that would come about if (and in my opinion “when”) a more historically “normal” ratio of Corporate Profits as a Percentage of GDP occurs. This topic can be very complex in nature, and depends upon myriad factors. In my opinion it deserves far greater recognition.
(click on chart to enlarge image)
Data Source: FRED, Federal Reserve Economic Data, Federal Reserve Bank of St. Louis; accessed March 30, 2022
_____
The Special Note summarizes my overall thoughts about our economic situation
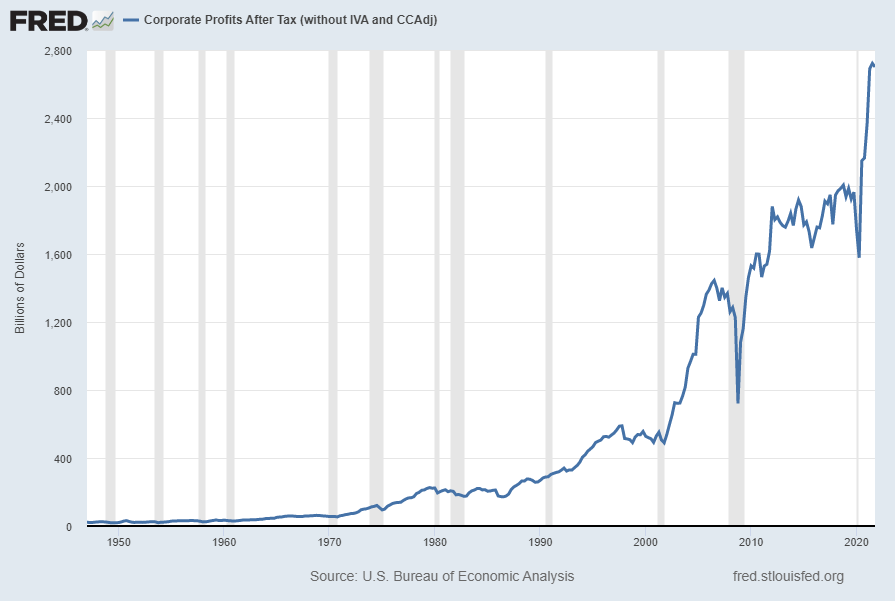
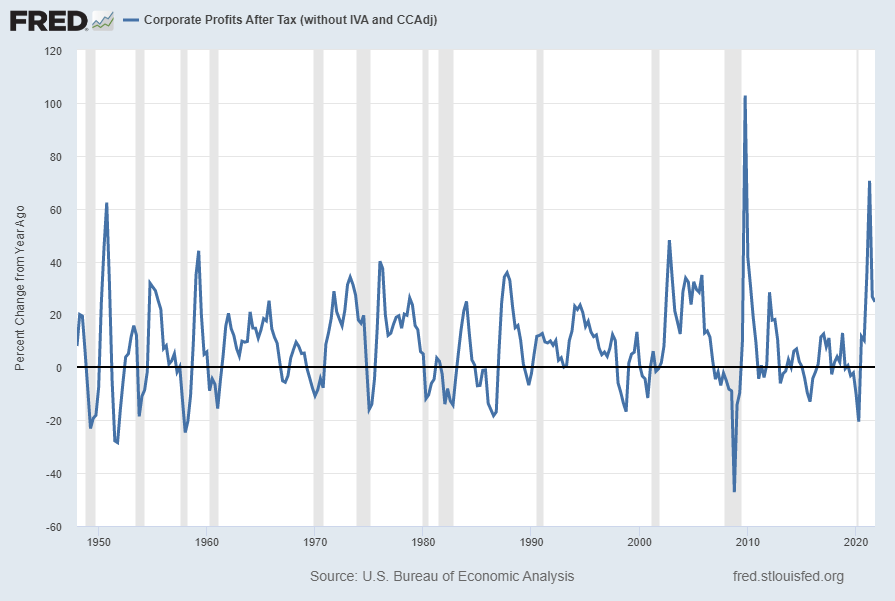
Today’s (March 30, 2022) GDP release (Q4 2021, Third Estimate) was accompanied by the Bureau of Economic Analysis (BEA) Corporate Profits report (Preliminary Estimate) for the 4th Quarter.
Of course, there are many ways to adjust and depict overall Corporate Profits. For reference purposes, here is a chart from the St. Louis Federal Reserve (FRED) showing the Corporate Profits After Tax (without IVA and CCAdj) (last updated March 30, 2022 with a value of $2700.326 Billion SAAR):
–
Here is the Corporate Profits After Tax measure shown on a Percentage Change from a Year Ago perspective (value of 24.8%):
Data Source: FRED, Federal Reserve Economic Data, Federal Reserve Bank of St. Louis: Corporate Profits After Tax [CP]; U.S. Department of Commerce: Bureau of Economic Analysis; accessed March 30, 2022; https://research.stlouisfed.org/fred2/series/CP
_________
I post various indicators and indices because I believe they should be carefully monitored. However, as those familiar with this site are aware, I do not necessarily agree with what they depict or imply.
_____
The Special Note summarizes my overall thoughts about our economic situation
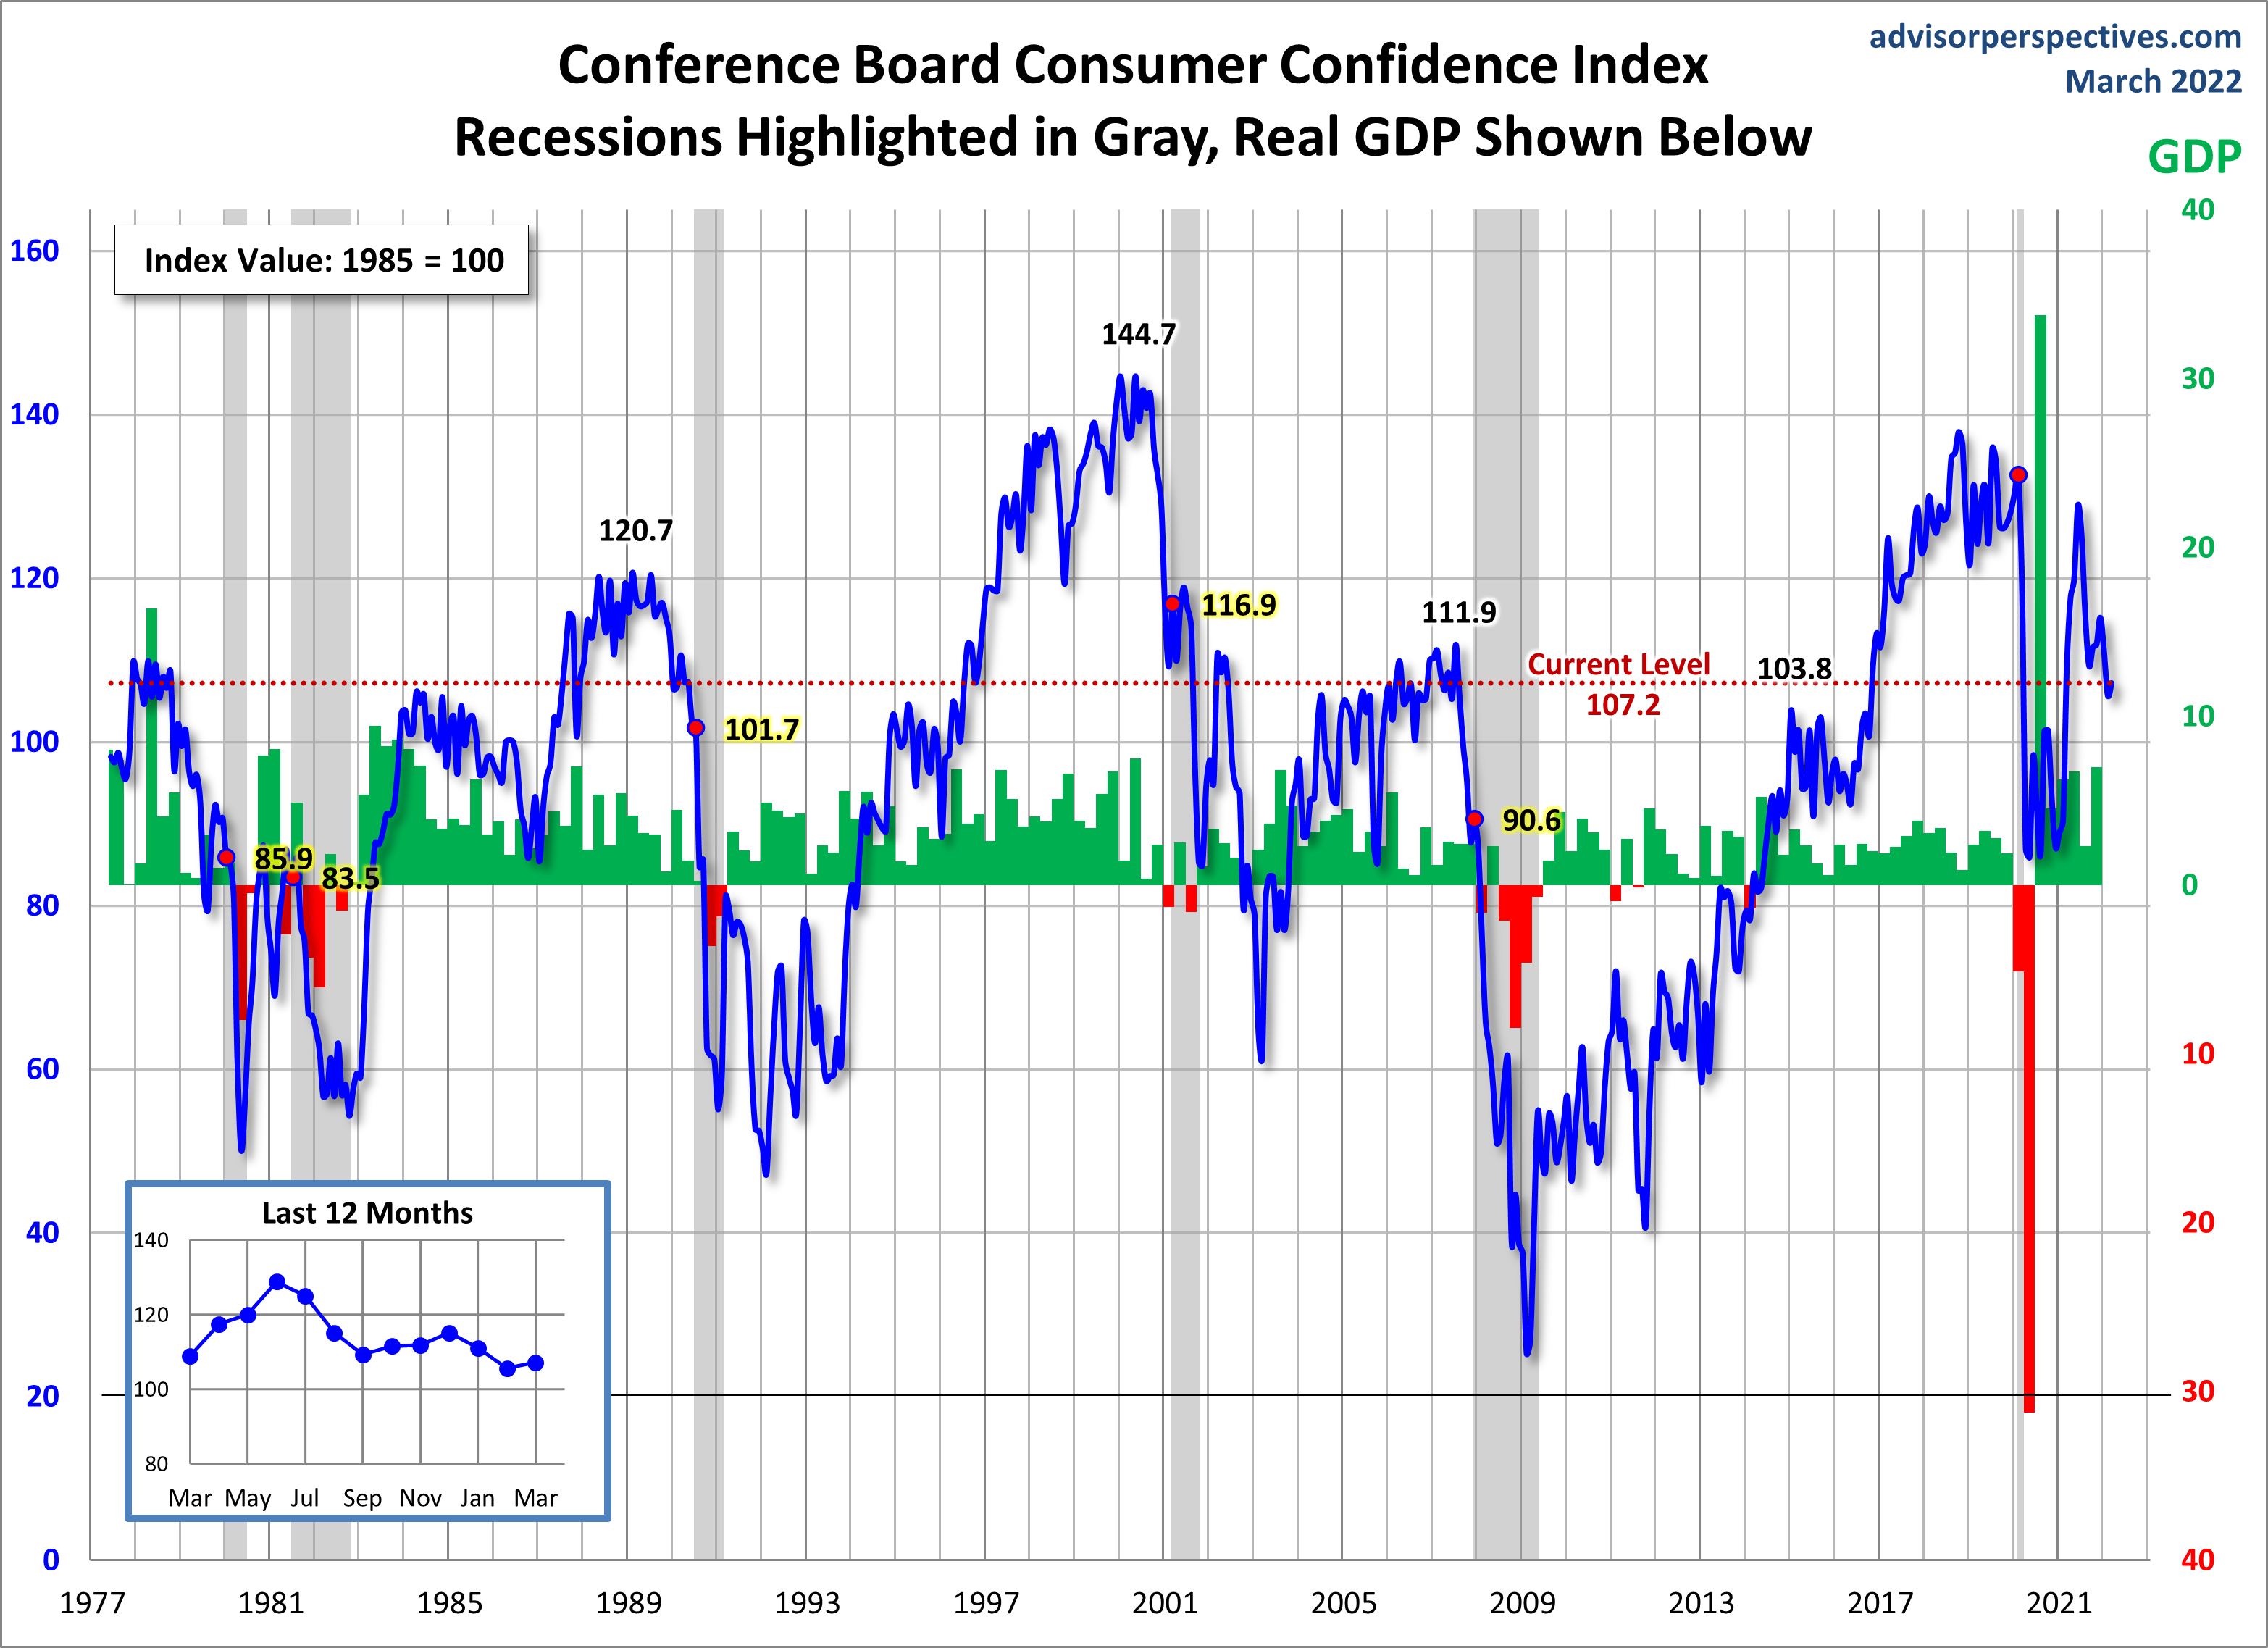
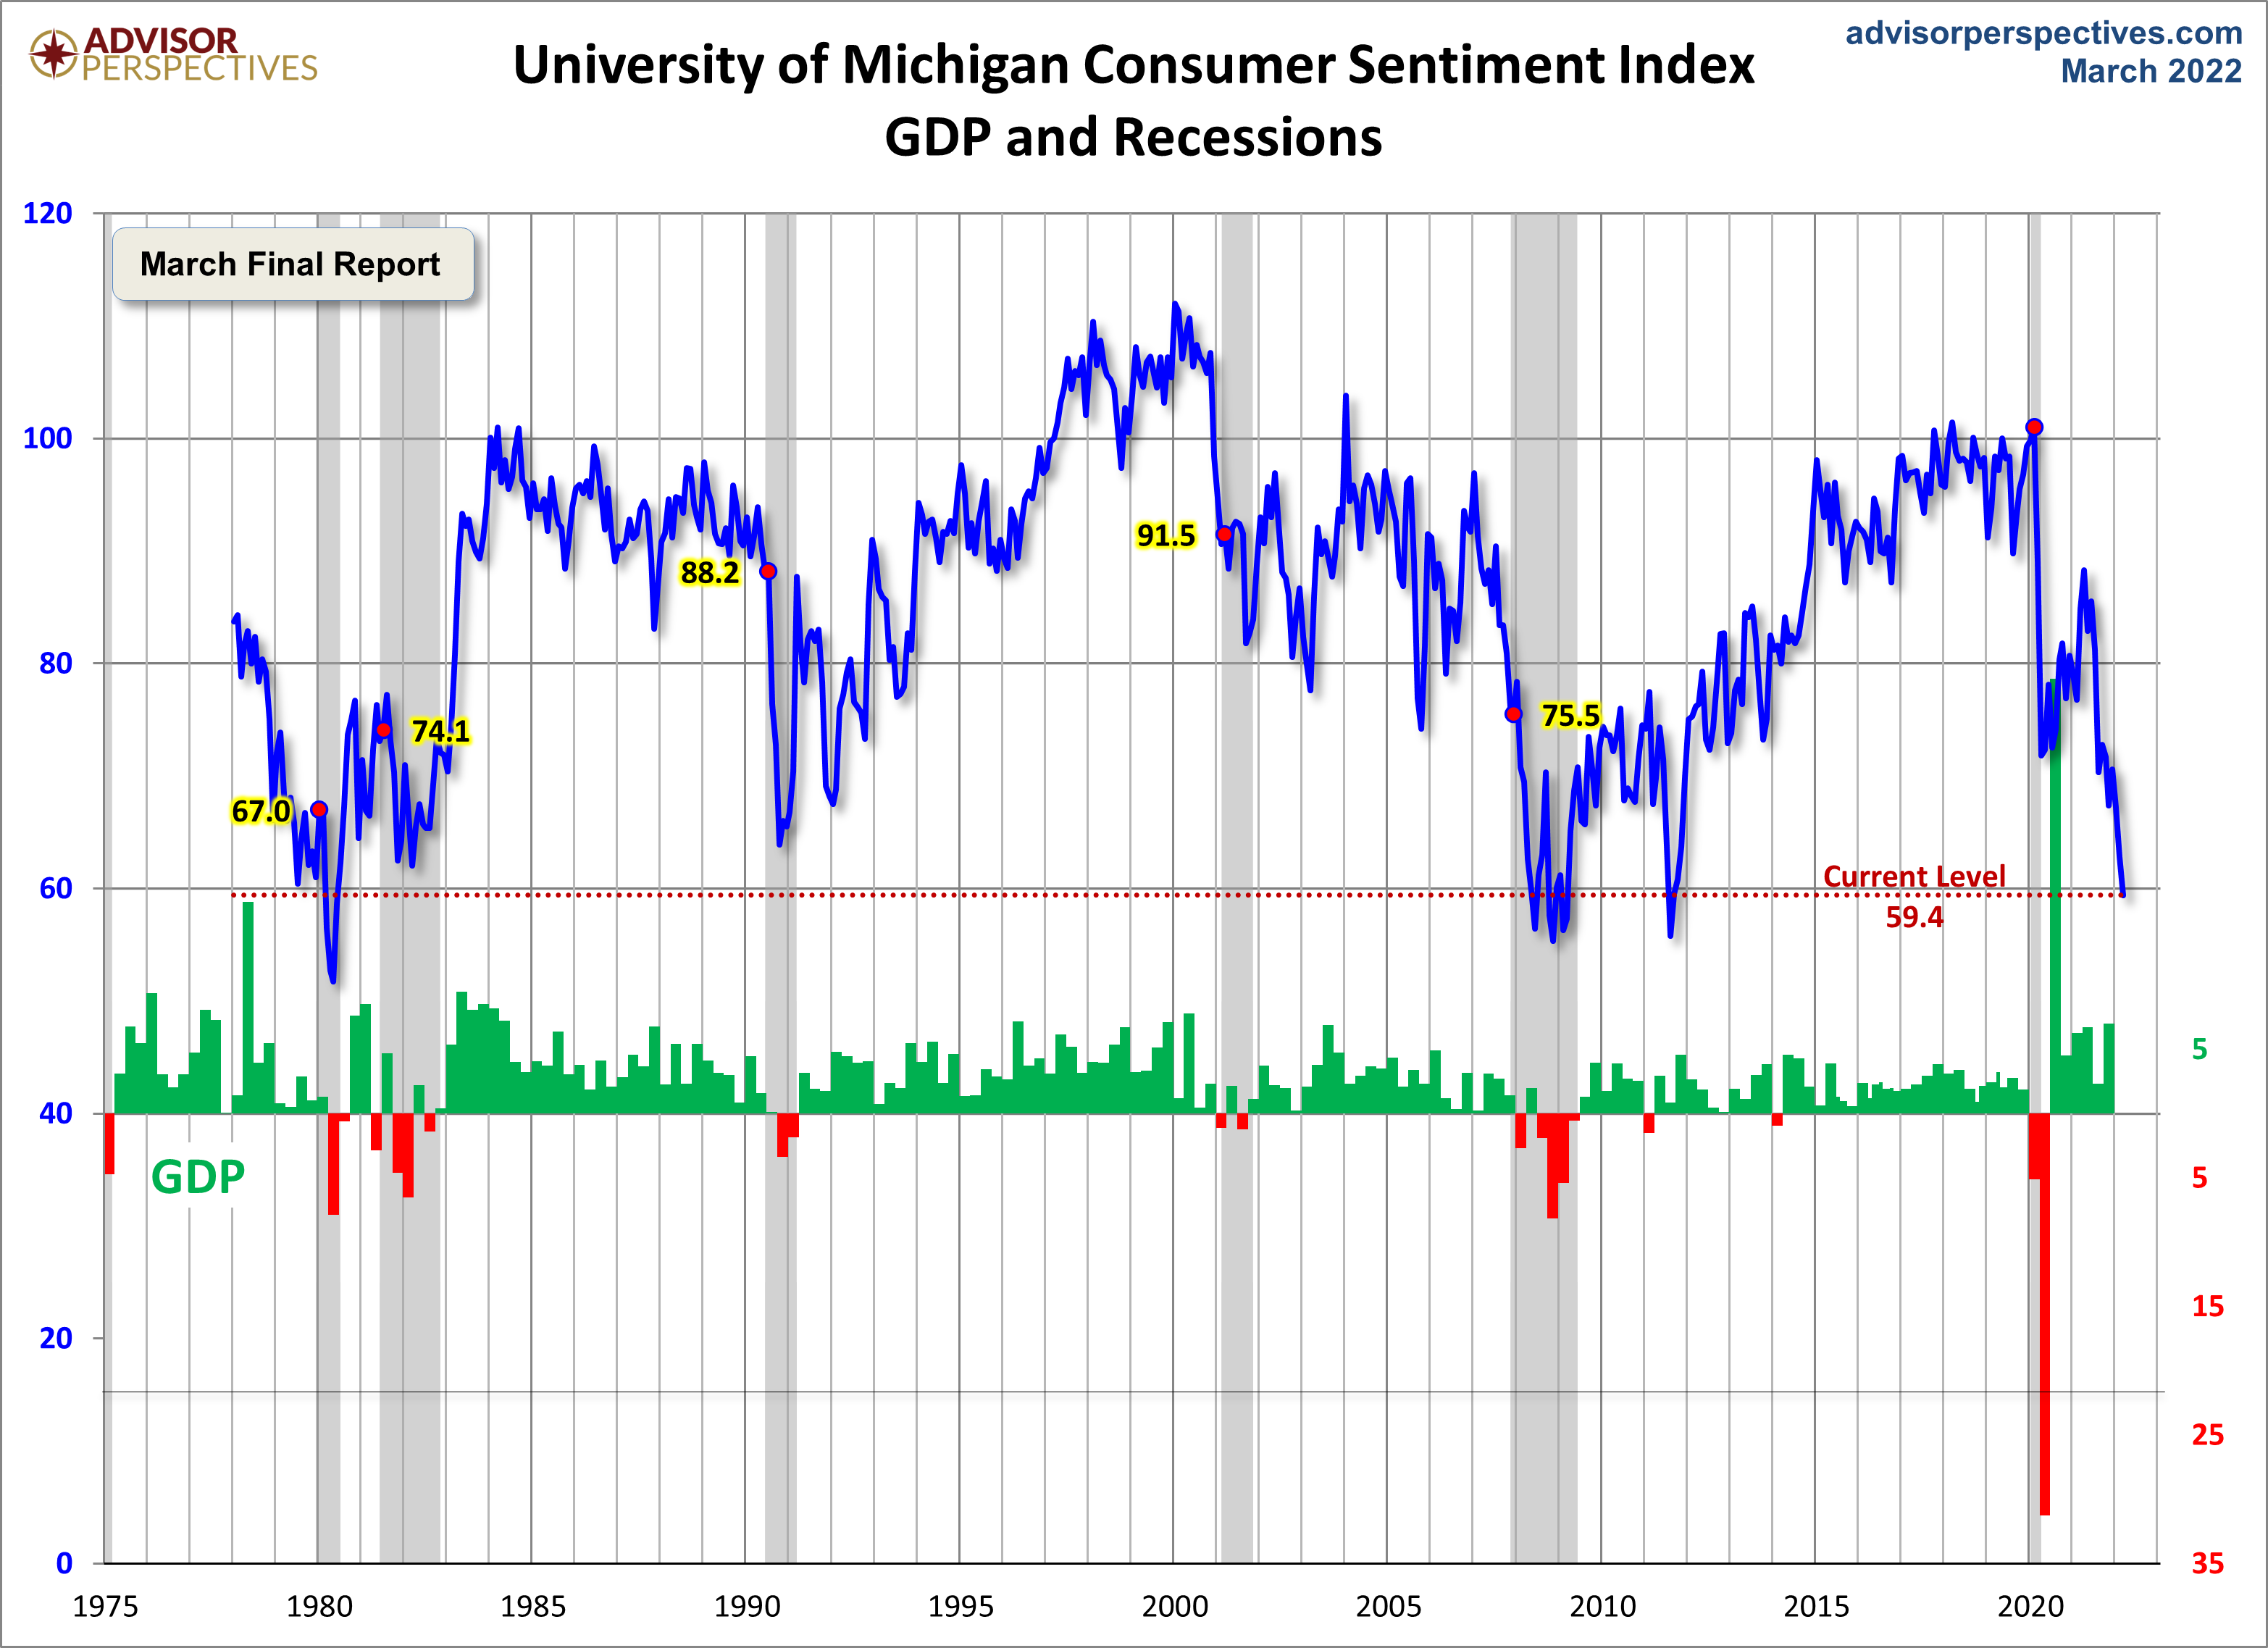
Advisor Perspectives had a post of March 29, 2022 (“Consumer Confidence Rebounds in March“) that displays the latest Conference Board Consumer Confidence and Thomson/Reuters University of Michigan Consumer Sentiment Index charts. They are presented below:
(click on charts to enlarge images)
–
While I don’t believe that confidence surveys should be overemphasized, I find these readings and trends to be notable, especially in light of a variety of other highly disconcerting measures highlighted throughout this site.
_____
The Special Note summarizes my overall thoughts about our economic situation
I post various indicators and indices because I believe they should be carefully monitored. However, as those familiar with this site are aware, I do not necessarily agree with what they depict or imply.
_____
The Special Note summarizes my overall thoughts about our economic situation
Business Roundtable today released its Q1 2022 CEO Economic Outlook Survey, a composite index of CEO plans for capital spending and employment and expectations for sales over the next six months. The overall CEO Economic Outlook Index declined 9 points from last quarter to 115 but remains well above its long-run average.
also:
In their second estimate of 2022 U.S. GDP growth, CEOs projected 3.9% growth for the year.
On February 10, 2022, The Conference Board released the Q1 2022 Measure Of CEO Confidence. The overall measure of CEO Confidence was at 57, down from the previous reading of 65. [note: a reading of more than 50 points reflects more positive than negative responses]
Notable excerpts from this February 10, 2022 Press Release include:
Current Conditions
CEOs’ assessment of general economic conditions declined in Q1 2022:
34% of CEOs reported economic conditions were better compared to six months ago, down from 61% in Q4 2021.
35% said conditions were worse, up from 19%.
CEOs were less optimistic about conditions in their own industries in Q1 2022:
40% of CEOs reported that conditions in their industries were better compared to six months ago, down from 58%.
22% said conditions in their own industries were worse, up from 18%.
Future Conditions
Expectations about the short-term economic outlook weakened in Q1 2022:
50% of CEOs said they expected economic conditions to improve over the next six months, down from 61% in Q4.
23% expected conditions to worsen, up from 13%.
CEOs’ expectations regarding short-term prospects in their own industries moderated in Q1:
58% of CEOs expected conditions in their own industry to improve over the next six months, down from 61%.
13% expected conditions to worsen, up from 8%.
_____
Additional details can be seen in the sources mentioned above.
_____
I post various economic forecasts because I believe they should be carefully monitored. However, as those familiar with this site are aware, I do not necessarily agree with many of the consensus estimates and much of the commentary in these forecast surveys.
_____
The Special Note summarizes my overall thoughts about our economic situation
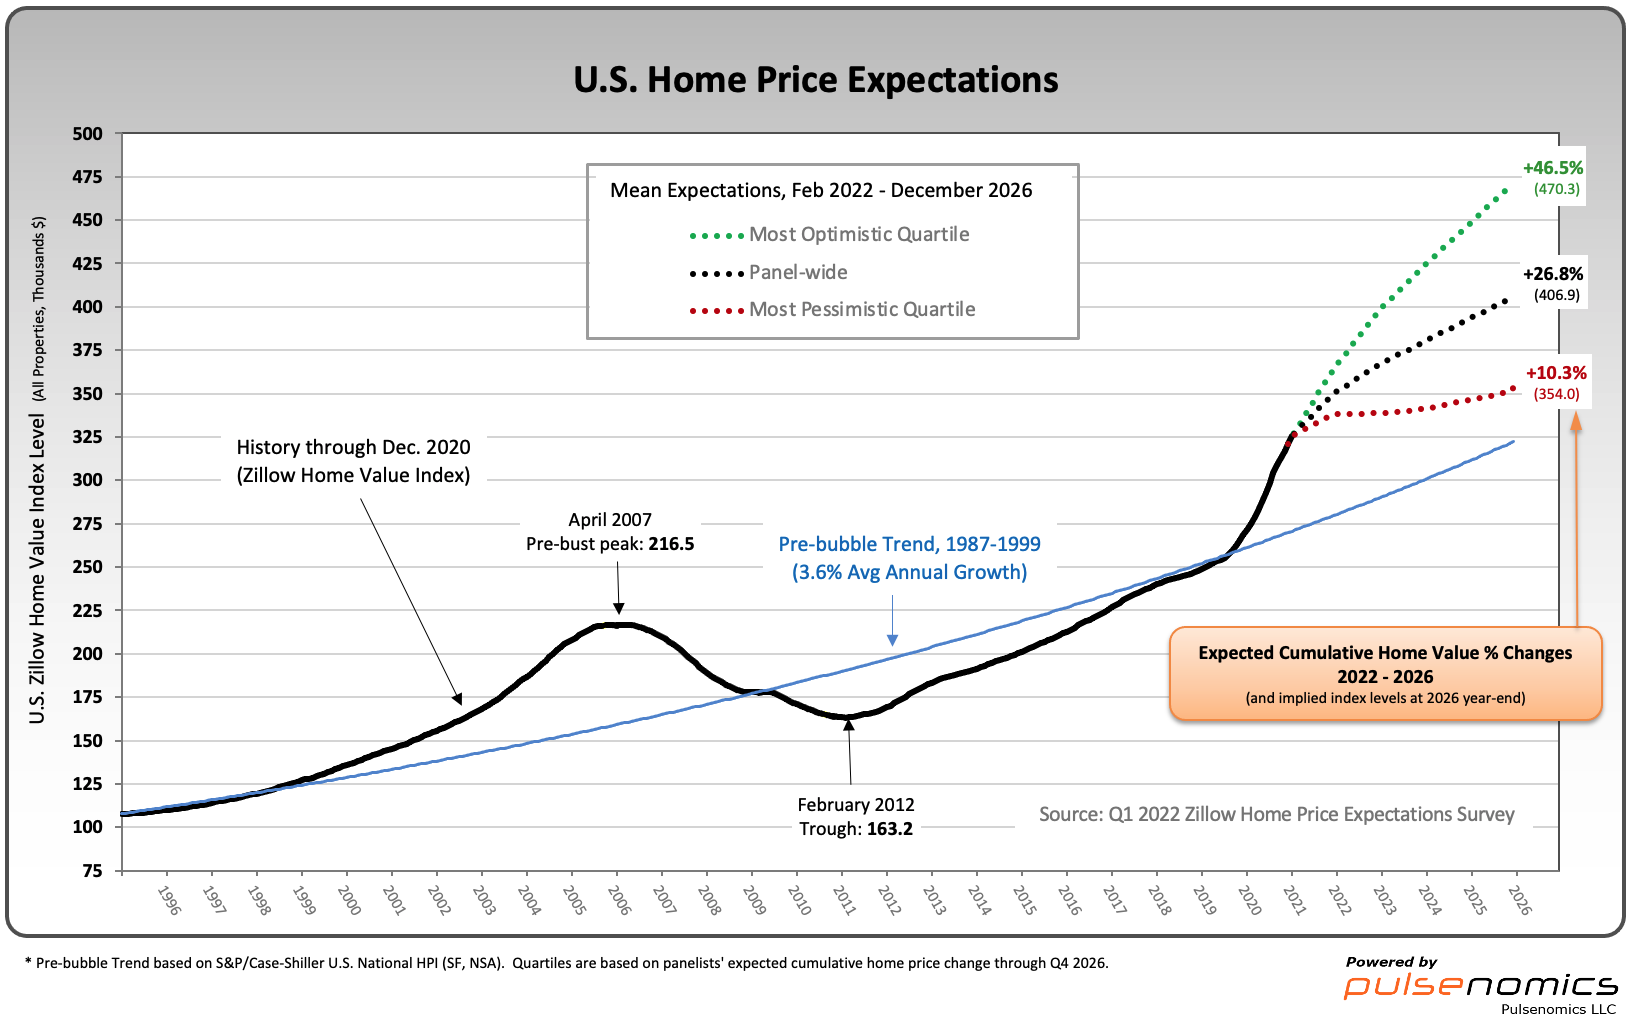
Pulsenomics founder Terry Loebs said the panel’s average projections for home price growth in 2022 have been revised upward, from 6.6% three months ago to 9% in this survey.
“Against the backdrop of tightening Fed policy and increasing mortgage rates, this more bullish outlook for home values suggests that home inventory shortages will remain the dominant price driver this year,” Loebs said. “If price increases this year for homes, rents, energy, and food each exceed wage growth – as the panel expects – home affordability challenges will intensify further, especially for low- and moderate-income renters.”
Zillow economists forecast a 16.3% rise in typical home values from February through December.
As one can see from the above chart, the average expectation is that the residential real estate market, as depicted by the U.S. Zillow Home Value Index, will continually climb.
The detail of the Q1 2022 Home Price Expectations Survey is interesting. Of the 109 survey respondents, only four (of the displayed responses) forecasts a cumulative price decrease through 2026.
The Median Cumulative Home Price Appreciation for years 2022-2026 is seen as 8.50%, 13.60%, 17.81%, 21.08%, and 25.43%, respectively.
For a variety of reasons, I continue to believe that these forecasts will prove far too optimistic in hindsight.
For a variety of reasons, I continue to believe that these forecasts will prove far too optimistic in hindsight.
I have written extensively about the residential real estate situation. For a variety of reasons, it is exceedingly complex. While many people continue to have an optimistic view regarding future residential real estate prices, in my opinion such a view is unsupported on an “all things considered” basis. Residential real estate is an exceedingly large asset bubble. As such, from these price levels there exists potential for a price decline of outsized magnitude.
_____
The Special Note summarizes my overall thoughts about our economic situation
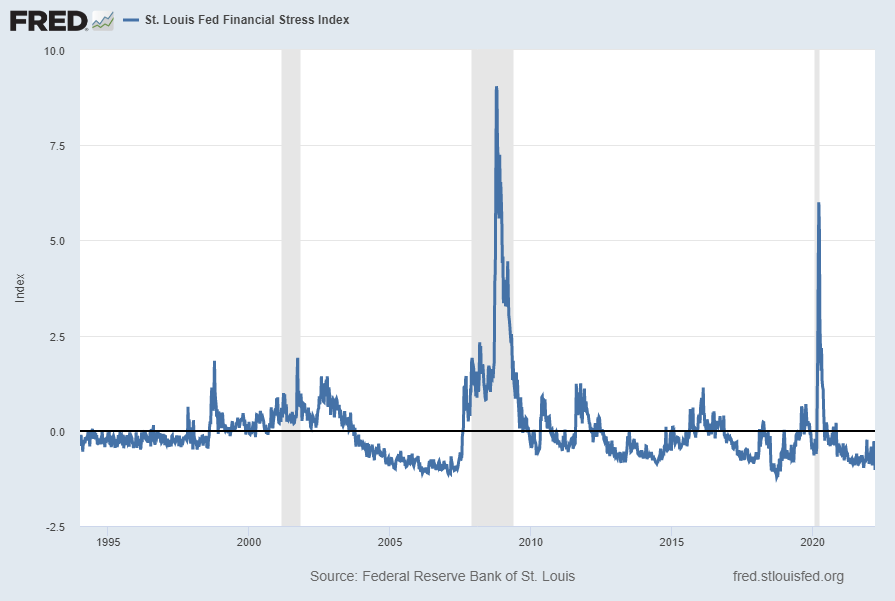
The St. Louis Fed’s Financial Stress Index (STLFSI3) is one index that is supposed to measure stress in the financial system. Its reading as of the March 24, 2022 update (reflecting data through March 18, 2022) is -1.0293:
source: Federal Reserve Bank of St. Louis, St. Louis Fed Financial Stress Index [STLFSI3], retrieved from FRED, Federal Reserve Bank of St. Louis; accessed March 24, 2022: https://fred.stlouisfed.org/series/STLFSI3
Of course, there are a variety of other measures and indices that are supposed to measure financial stress and other related issues, both from the Federal Reserve as well as from private sources.
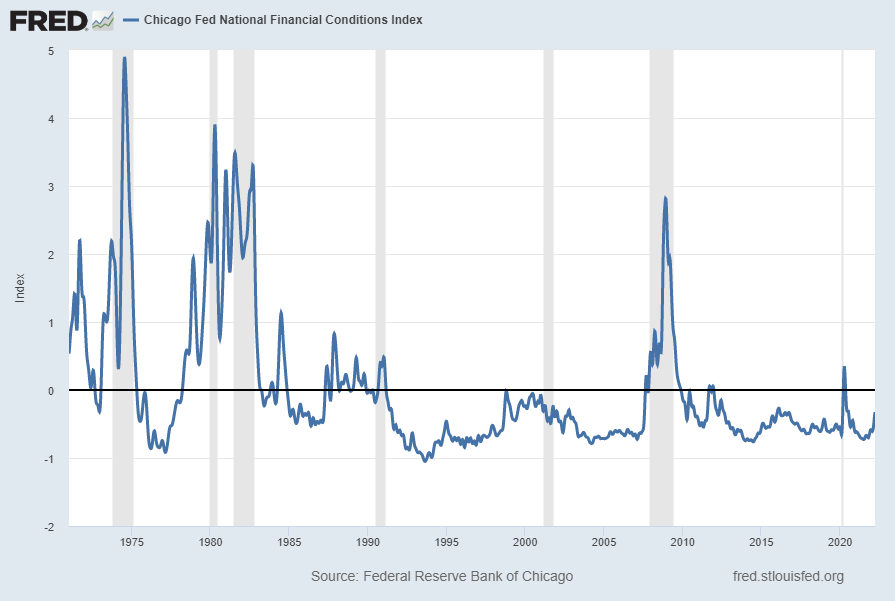
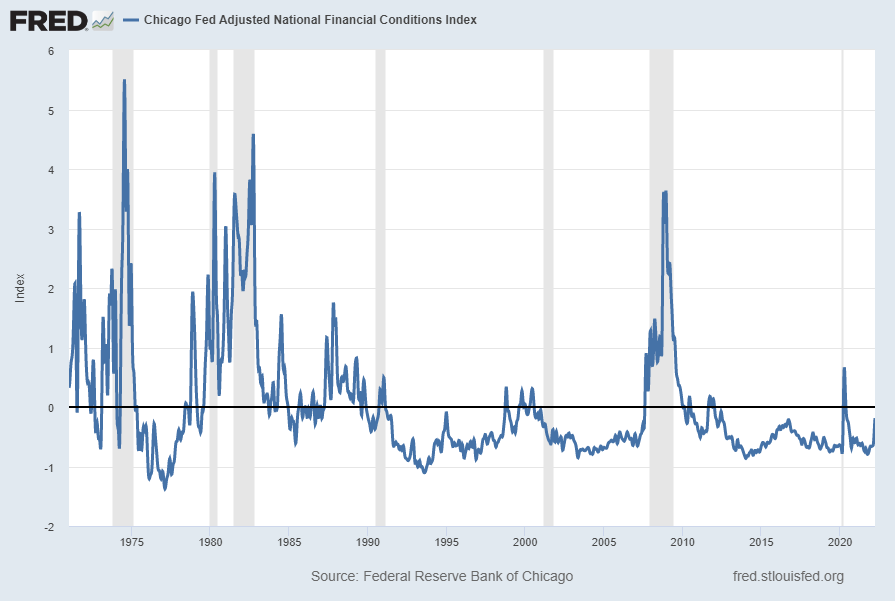
Two other indices that I regularly monitor include the Chicago Fed National Financial Conditions Index (NFCI) as well as the Chicago Fed Adjusted National Financial Conditions Index (ANFCI).
Here are summary descriptions of each, as seen in FRED:
The National Financial Conditions Index (NFCI) measures risk, liquidity and leverage in money markets and debt and equity markets as well as in the traditional and “shadow” banking systems. Positive values of the NFCI indicate financial conditions that are tighter than average, while negative values indicate financial conditions that are looser than average.
The adjusted NFCI (ANFCI). This index isolates a component of financial conditions uncorrelated with economic conditions to provide an update on how financial conditions compare with current economic conditions.
For further information, please visit the Federal Reserve Bank of Chicago’s web site:
Below are the most recently updated charts of the NFCI and ANFCI, respectively.
The NFCI chart below was last updated on March 23, 2022 incorporating data from January 8, 1971 through March 18, 2022 on a weekly basis. The March 18 value is -.32546:
The ANFCI chart below was last updated on March 23, 2022 incorporating data from January 8, 1971 through March 18, 2022, on a weekly basis. The March 18, 2022 value is -.18719:
I post various indicators and indices because I believe they should be carefully monitored. However, as those familiar with this site are aware, I do not necessarily agree with what they depict or imply.
_____
The Special Note summarizes my overall thoughts about our economic situation
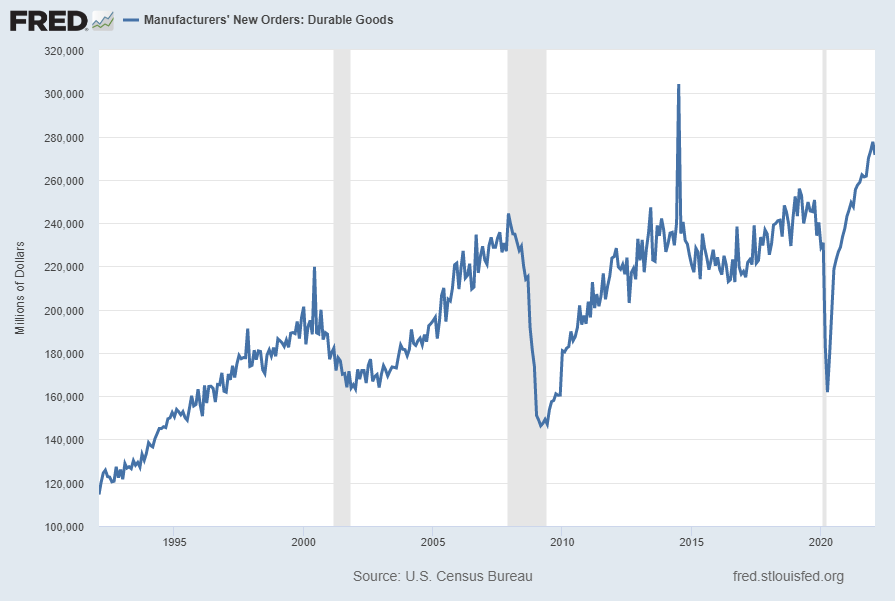
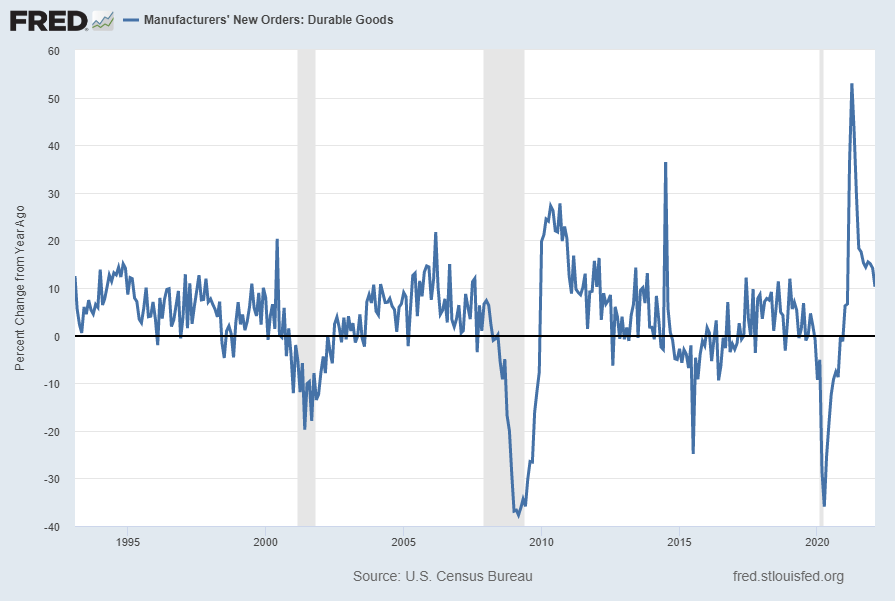
Many people place emphasis on Durable Goods New Orders as a prominent economic indicator and/or leading economic indicator.
For reference, below are two charts depicting this measure.
First, from the St. Louis Fed site (FRED), a chart through February 2022, updated on March 24, 2022. This value is $271,512 ($ Millions):
(click on charts to enlarge images)
–
Second, here is the chart depicting this measure on a “Percent Change from a Year Ago” basis, with a last value of 10.3%:
Data Source: FRED, Federal Reserve Economic Data, Federal Reserve Bank of St. Louis: Manufacturers’ New Orders: Durable Goods [DGORDER]; U.S. Department of Commerce: Census Bureau; accessed March 24, 2022; http://research.stlouisfed.org/fred2/series/DGORDER
_________
I post various indicators and indices because I believe they should be carefully monitored. However, as those familiar with this site are aware, I do not necessarily agree with what they depict or imply.
_____
The Special Note summarizes my overall thoughts about our economic situation
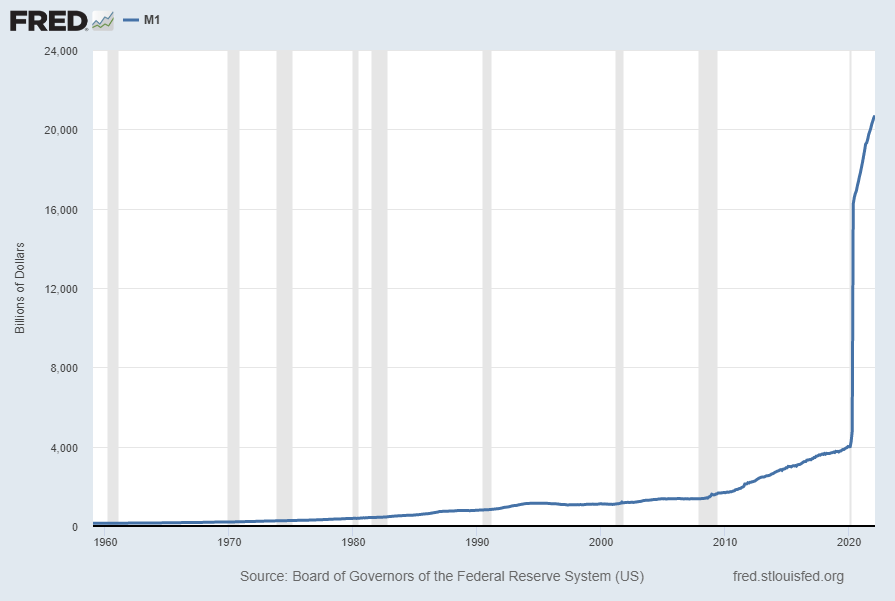
For reference purposes, below are two sets of charts depicting growth in the money supply.
The first shows the M1, defined in FRED as the following:
Before May 2020, M1 consists of (1) currency outside the U.S. Treasury, Federal Reserve Banks, and the vaults of depository institutions; (2) demand deposits at commercial banks (excluding those amounts held by depository institutions, the U.S. government, and foreign banks and official institutions) less cash items in the process of collection and Federal Reserve float; and (3) other checkable deposits (OCDs), consisting of negotiable order of withdrawal, or NOW, and automatic transfer service, or ATS, accounts at depository institutions, share draft accounts at credit unions, and demand deposits at thrift institutions.
Beginning May 2020, M1 consists of (1) currency outside the U.S. Treasury, Federal Reserve Banks, and the vaults of depository institutions; (2) demand deposits at commercial banks (excluding those amounts held by depository institutions, the U.S. government, and foreign banks and official institutions) less cash items in the process of collection and Federal Reserve float; and (3) other liquid deposits, consisting of OCDs and savings deposits (including money market deposit accounts). Seasonally adjusted M1 is constructed by summing currency, demand deposits, and OCDs (before May 2020) or other liquid deposits (beginning May 2020), each seasonally adjusted separately.
Here is the “M1 Money Stock” (seasonally adjusted) chart, updated on March 22, 2022 depicting data through February 2022, with a value of $20,694.2 Billion:
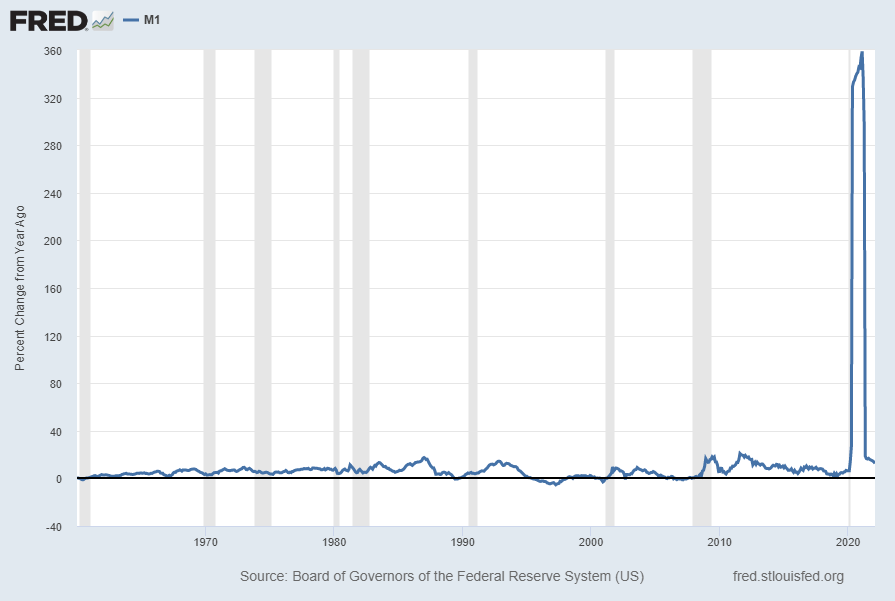
Here is the “M1 Money Stock” chart on a “Percent Change From Year Ago” basis, with a current value of 12.7%:
Data Source: Board of Governors of the Federal Reserve System (US), M1 Money Stock [M1SL], retrieved from FRED, Federal Reserve Bank of St. Louis; accessed March 23, 2022: https://fred.stlouisfed.org/series/M1SL
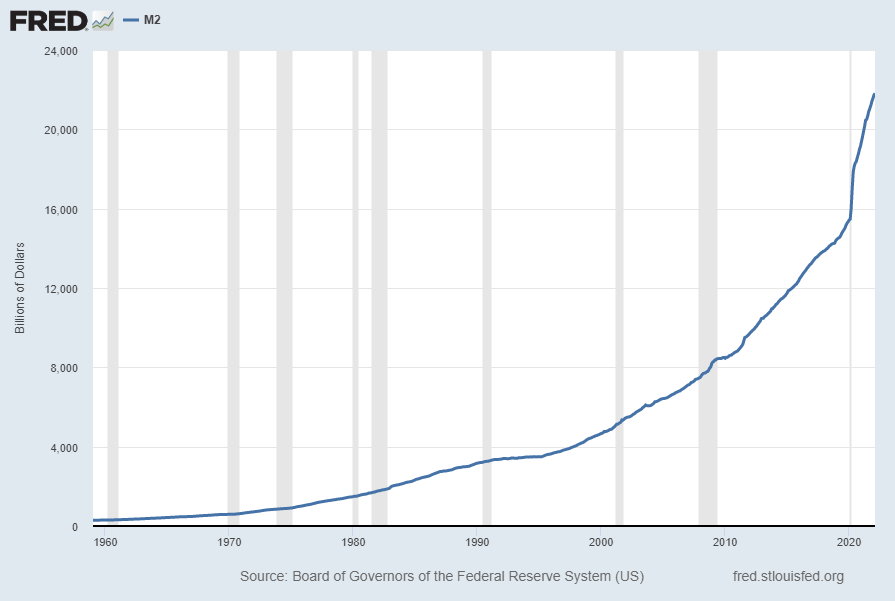
The second set shows M2, defined in FRED as the following:
Before May 2020, M2 consists of M1 plus (1) savings deposits (including money market deposit accounts); (2) small-denomination time deposits (time deposits in amounts of less than $100,000) less individual retirement account (IRA) and Keogh balances at depository institutions; and (3) balances in retail money market funds (MMFs) less IRA and Keogh balances at MMFs.
Beginning May 2020, M2 consists of M1 plus (1) small-denomination time deposits (time deposits in amounts of less than $100,000) less IRA and Keogh balances at depository institutions; and (2) balances in retail MMFs less IRA and Keogh balances at MMFs. Seasonally adjusted M2 is constructed by summing savings deposits (before May 2020), small-denomination time deposits, and retail MMFs, each seasonally adjusted separately, and adding this result to seasonally adjusted M1.
Here is the “M2 Money Stock” (seasonally adjusted) chart, updated on March 22, 2022, depicting data through February 2022, with a value of $21,811.8 Billion:
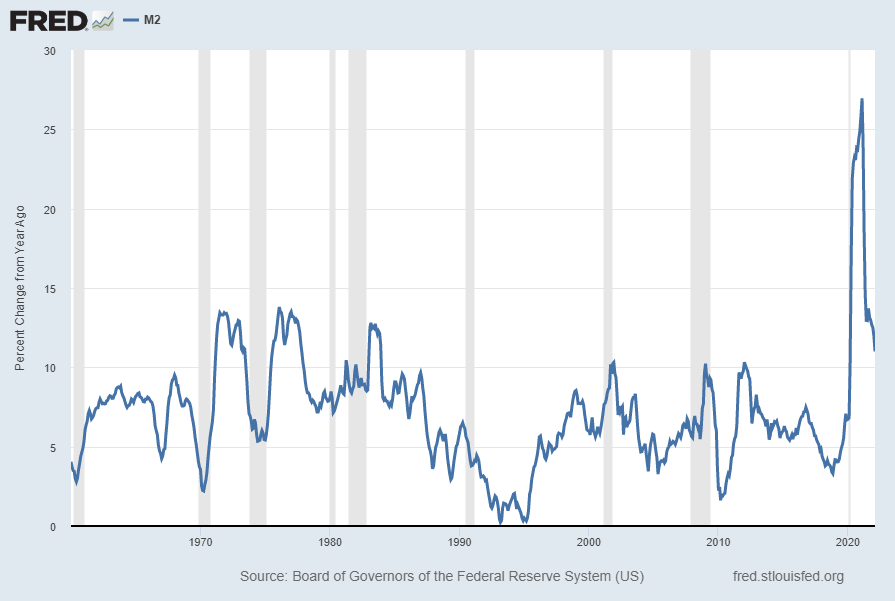
Here is the “M2 Money Stock” chart on a “Percent Change From Year Ago” basis, with a current value of 11.0%:
Data Source: Board of Governors of the Federal Reserve System (US), M2 Money Stock [M2SL], retrieved from FRED, Federal Reserve Bank of St. Louis; accessed March 23, 2022: https://fred.stlouisfed.org/series/M2SL
_____
The Special Note summarizes my overall thoughts about our economic situation