Friday, March 31, 2023

Consumer Confidence Surveys – As Of March 31, 2023

Advisor Perspectives had a post of March 31, 2023 (“Michigan Consumer Sentiment Drops for First Time in Four Months“) that displays the latest Conference Board Consumer Confidence and University of Michigan Consumer Sentiment Index charts.  They are presented below:

(click on charts to enlarge images)

Conference Board Consumer Confidence Index 104.2

University of Michigan Consumer Sentiment Index 62.0

While I don’t believe that confidence surveys should be overemphasized, I find these readings and trends to be notable, especially in light of a variety of other highly disconcerting measures highlighted throughout this site.

_____

The Special Note summarizes my overall thoughts about our economic situation

SPX at 4082.13 as this post is written

March 31, 2023 Gallup Poll Results On Economic Confidence – Notable Excerpts

On March 31, 2023 Gallup released the poll results titled “Economic Pessimism Persists, With Inflation Still Key Concern.”

Notable excerpts include:

The American public continues to rate the U.S. economy in mostly negative terms in March, with 83% describing current economic conditions as “only fair” or “poor.” Just 16% consider them “excellent” or “good.” Furthermore, 72% think conditions are getting worse, while 23% say they are improving.

also:

Gallup combines Americans’ rating of current economic conditions with their perception of the economy’s direction to create its Economic Confidence Index. This month’s index score is -38, which is the average of Americans’ net-positive rating of current conditions (the percentage rating the economy as excellent or good minus the percentage rating it poor) and their net-positive outlook score (the percentage saying the economy is getting better minus the percentage saying it is getting worse).

The index has a theoretical range of +100 (if all respondents rate the economy as excellent or good and say it’s improving) to -100 (if all rate it as poor and say it’s getting worse). In practice, the highest the index has been since Gallup began tracking the component questions in 1992 was +56 in January 2000, and the lowest was -72 in October 2008.

Here is an accompanying chart of the Gallup Economic Confidence Index:

Gallup Economic Confidence Index

_____

The Special Note summarizes my overall thoughts about our economic situation

SPX at 4081.05 as this post is written

Thursday, March 30, 2023

Chicago Fed National Financial Conditions Index (NFCI)

The St. Louis Fed’s Financial Stress Index (STLFSI4) is one index that is supposed to measure stress in the financial system. Its reading as of the March 30, 2023 update (reflecting data through March 24, 2023) is .3406:

STLFSI4

source: Federal Reserve Bank of St. Louis, St. Louis Fed Financial Stress Index [STLFSI4], retrieved from FRED, Federal Reserve Bank of St. Louis; accessed March 30, 2023: https://fred.stlouisfed.org/series/STLFSI4

Of course, there are a variety of other measures and indices that are supposed to measure financial stress and other related issues, both from the Federal Reserve as well as from private sources.

Two other indices that I regularly monitor include the Chicago Fed National Financial Conditions Index (NFCI) as well as the Chicago Fed Adjusted National Financial Conditions Index (ANFCI).

Here are summary descriptions of each, as seen in FRED:

The National Financial Conditions Index (NFCI) measures risk, liquidity and leverage in money markets and debt and equity markets as well as in the traditional and “shadow” banking systems. Positive values of the NFCI indicate financial conditions that are tighter than average, while negative values indicate financial conditions that are looser than average.

The adjusted NFCI (ANFCI). This index isolates a component of financial conditions uncorrelated with economic conditions to provide an update on how financial conditions compare with current economic conditions.

For further information, please visit the Federal Reserve Bank of Chicago’s web site:

http://www.chicagofed.org/webpages/publications/nfci/index.cfm

Below are the most recently updated charts of the NFCI and ANFCI, respectively.

The NFCI chart below was last updated on March 29, 2023 incorporating data from January 8, 1971 through March 24, 2023 on a weekly basis.  The March 24 value is -.12072:

NFCI

Data Source: FRED, Federal Reserve Economic Data, Federal Reserve Bank of St. Louis; accessed March 30, 2023:  
http://research.stlouisfed.org/fred2/series/NFCI

The ANFCI chart below was last updated on March 29, 2023 incorporating data from January 8, 1971 through March 24, 2023, on a weekly basis.  The March 24, 2023 value is -.05930:

ANFCI

Data Source: FRED, Federal Reserve Economic Data, Federal Reserve Bank of St. Louis; accessed March 30, 2023:  
http://research.stlouisfed.org/fred2/series/ANFCI

_________

I post various indicators and indices because I believe they should be carefully monitored.  However, as those familiar with this site are aware, I do not necessarily agree with what they depict or imply.

_____

The Special Note summarizes my overall thoughts about our economic situation

SPX at 4042.16 as this post is written

Corporate Profits As A Percentage Of GDP

In the last post (“4th Quarter 2022 Corporate Profits“) I displayed, for reference purposes, a long-term chart depicting Corporate Profits After Tax.

There are many ways to view this measure, both on an absolute as well as relative basis.

One relative measure is viewing Corporate Profits as a Percentage of GDP.  I feel that this metric is important for a variety of reasons.  As well, the measure is important to a variety of parties, including investors, businesses, and government policy makers.

As one can see from the long-term chart below (updated through the fourth quarter), (After Tax) Corporate Profits as a Percentage of GDP is still at levels that can be seen as historically high.  While there are many reasons as to why this is so, from a going-forward standpoint I think it is important to recognize both that such a notable condition exists, as well as contemplate and/or plan for such factors and conditions that would come about if (and in my opinion “when”) a more historically “normal” ratio of Corporate Profits as a Percentage of GDP occurs.  This topic can be very complex in nature, and depends upon myriad factors.  In my opinion it deserves far greater recognition.

(click on chart to enlarge image)

Corporate Profits After Tax As A Percentage of GDP .10411

Data Source: FRED, Federal Reserve Economic Data, Federal Reserve Bank of St. Louis; accessed March 30, 2023

_____

The Special Note summarizes my overall thoughts about our economic situation

SPX at 4052.70 as this post is written

4th Quarter 2022 Corporate Profits

Today’s (March 30, 2023) GDP release (Q4 2022, Third Estimate) was accompanied by the Bureau of Economic Analysis (BEA) Corporate Profits report (Preliminary Estimate) for the 4th Quarter.

Of course, there are many ways to adjust and depict overall Corporate Profits.  For reference purposes, here is a chart from the St. Louis Federal Reserve (FRED) showing the Corporate Profits After Tax (without IVA and CCAdj) (last updated March 30, 2023 with a value of $2721.294 Billion SAAR):

Corporate Profits After Tax

Here is the Corporate Profits After Tax measure shown on a Percentage Change from a Year Ago perspective (value of -1.4%):

Corporate Profits After Tax Percent Change From Year Ago

Data Source: FRED, Federal Reserve Economic Data, Federal Reserve Bank of St. Louis: Corporate Profits After Tax [CP]; U.S. Department of Commerce: Bureau of Economic Analysis; accessed March 30, 2023; https://research.stlouisfed.org/fred2/series/CP

_________

I post various indicators and indices because I believe they should be carefully monitored.  However, as those familiar with this site are aware, I do not necessarily agree with what they depict or imply.

_____

The Special Note summarizes my overall thoughts about our economic situation

SPX at 4054.52 as this post is written

Wednesday, March 29, 2023

The CFO Survey First Quarter 2023 – Notable Excerpts

On March 29, 2023 The CFO Survey (formerly called the “Duke/CFO Global Business Outlook”) was released.  It contains a variety of statistics regarding how CFOs view business and economic conditions.

In the CFO Survey press release, I found the following to be the most notable excerpts – although I don’t necessarily agree with them:

Financial decision-makers became slightly more optimistic about the U.S. economy and increased their expectations for real GDP growth in 2023, while citing labor availability and inflation as the most pressing concerns for their company, according to the results of The CFO Survey, a collaboration of Duke University’s Fuqua School of Business and the Federal Reserve Banks of Richmond and Atlanta.

The survey, which closed on March 10, found that CFO optimism about the U.S. economy was 55 on a scale of 0 to 100, modestly higher than last quarter but well below the historic average of about 60. Additionally, CFOs revised upward their expectations for real GDP growth over the next four quarters to 1.4 percent from 0.7 percent in the prior survey. Moreover, the probability respondents assigned to negative year-ahead economic growth fell from 31 percent last quarter to 19 percent this quarter.

The CFO Survey contains an Optimism Index chart, with the blue line showing U.S. Optimism (with regard to the economy) at 55.0, as seen below:

CFO Survey - Optimism Indexes

It should be interesting to see how well the CFOs predict business and economic conditions going forward.   I discussed past various aspects of this, and the importance of these predictions, in the July 9, 2010 post titled “The Business Environment”.

(past posts on CEO and CFO surveys can be found under the “CFO and CEO Confidence” label)

_____

I post various economic forecasts because I believe they should be carefully monitored.  However, as those familiar with this site are aware, I do not necessarily agree with many of the consensus estimates and much of the commentary in these forecast surveys.

_____

The Special Note summarizes my overall thoughts about our economic situation

SPX at 4009.16 as this post is written

Tuesday, March 28, 2023

Money Supply Charts Through February 2023

For reference purposes, below are two sets of charts depicting growth in the money supply.

The first shows the M1, defined in FRED as the following:

Before May 2020, M1 consists of (1) currency outside the U.S. Treasury, Federal Reserve Banks, and the vaults of depository institutions; (2) demand deposits at commercial banks (excluding those amounts held by depository institutions, the U.S. government, and foreign banks and official institutions) less cash items in the process of collection and Federal Reserve float; and (3) other checkable deposits (OCDs), consisting of negotiable order of withdrawal, or NOW, and automatic transfer service, or ATS, accounts at depository institutions, share draft accounts at credit unions, and demand deposits at thrift institutions.

Beginning May 2020, M1 consists of (1) currency outside the U.S. Treasury, Federal Reserve Banks, and the vaults of depository institutions; (2) demand deposits at commercial banks (excluding those amounts held by depository institutions, the U.S. government, and foreign banks and official institutions) less cash items in the process of collection and Federal Reserve float; and (3) other liquid deposits, consisting of OCDs and savings deposits (including money market deposit accounts). Seasonally adjusted M1 is constructed by summing currency, demand deposits, and OCDs (before May 2020) or other liquid deposits (beginning May 2020), each seasonally adjusted separately.

Here is the “M1 Money Stock” (seasonally adjusted) chart, updated on March 28, 2023 depicting data through February 2023, with a value of $19,336.7 Billion:

M1SL 19336.7

Here is the “M1 Money Stock” chart on a “Percent Change From Year Ago” basis, with a current value of -5.8%:

M1SL -5.8 Percent Change From Year Ago

Data Source: Board of Governors of the Federal Reserve System (US), M1 Money Stock [M1SL], retrieved from FRED, Federal Reserve Bank of St. Louis; accessed March 28, 2023: https://fred.stlouisfed.org/series/M1SL

The second set shows M2, defined in FRED as the following:

Before May 2020, M2 consists of M1 plus (1) savings deposits (including money market deposit accounts); (2) small-denomination time deposits (time deposits in amounts of less than $100,000) less individual retirement account (IRA) and Keogh balances at depository institutions; and (3) balances in retail money market funds (MMFs) less IRA and Keogh balances at MMFs.

Beginning May 2020, M2 consists of M1 plus (1) small-denomination time deposits (time deposits in amounts of less than $100,000) less IRA and Keogh balances at depository institutions; and (2) balances in retail MMFs less IRA and Keogh balances at MMFs. Seasonally adjusted M2 is constructed by summing savings deposits (before May 2020), small-denomination time deposits, and retail MMFs, each seasonally adjusted separately, and adding this result to seasonally adjusted M1.

Here is the “M2 Money Stock” (seasonally adjusted) chart, updated on March 28, 2023, depicting data through February 2023, with a value of $21,062.5 Billion:

M2SL 21062.5

Here is the “M2 Money Stock” chart on a “Percent Change From Year Ago” basis, with a current value of -2.4%:

M2SL -2.4 Percent Change From Year Ago

Data Source: Board of Governors of the Federal Reserve System (US), M2 Money Stock [M2SL], retrieved from FRED, Federal Reserve Bank of St. Louis; accessed March 28, 2023: https://fred.stlouisfed.org/series/M2SL

_____

The Special Note summarizes my overall thoughts about our economic situation

SPX at 3960.70 as this post is written

House Prices Reference Chart

As a reference for long-term house price index trends, below is a chart, updated with the most current data (through January) from the CalculatedRisk blog post of March 28, 2023 titled “Case-Shiller : National House Price Index…“:

house prices chart

_________

I post various indicators and indices because I believe they should be carefully monitored.  However, as those familiar with this site are aware, I do not necessarily agree with what they depict or imply.

_____

The Special Note summarizes my overall thoughts about our economic situation

SPX at 3973.81 as this post is written

Friday, March 24, 2023

Durable Goods New Orders – Long-Term Charts Through February 2023

Many people place emphasis on Durable Goods New Orders as a prominent economic indicator and/or leading economic indicator.

For reference, below are two charts depicting this measure.

First, from the St. Louis Fed site (FRED), a chart through February 2023, updated on March 24, 2023. This value is $268,387 ($ Millions):

(click on charts to enlarge images)

Durable Goods New Orders

Second, here is the chart depicting this measure on a “Percent Change from a Year Ago” basis, with a last value of 2.2%:

DGORDER Percent Change From Year Ago

Data Source: FRED, Federal Reserve Economic Data, Federal Reserve Bank of St. Louis: Manufacturers’ New Orders:  Durable Goods [DGORDER]; U.S. Department of Commerce: Census Bureau; accessed March 24, 2023; 
http://research.stlouisfed.org/fred2/series/DGORDER

_________

I post various indicators and indices because I believe they should be carefully monitored.  However, as those familiar with this site are aware, I do not necessarily agree with what they depict or imply.

_____

The Special Note summarizes my overall thoughts about our economic situation

SPX at 3915.60 as this post is written

Thursday, March 23, 2023

Jerome Powell’s March 22, 2023 Press Conference – Notable Aspects

On Wednesday, March 22, 2023 FOMC Chairman Jerome Powell gave his scheduled March 2023 FOMC Press Conference. (link of video and related materials)

Below are Jerome Powell’s comments I found most notable – although I don’t necessarily agree with them – in the order they appear in the transcript.  These comments are excerpted from the “Transcript of Chairman Powell’s Press Conference“ (preliminary)(pdf) of March 22, 2023, with the accompanying “FOMC Statement” and “Summary of Economic Projections” (pdf) dated March 22, 2023.

Excerpts from Chairman Powell’s opening comments:

CHAIR POWELL. Good afternoon.  Before discussing today’s meeting, let me briefly address recent developments in the banking sector.  In the past two weeks, serious difficulties at a small number of banks have emerged.  History has shown that isolated banking problems, if left unaddressed, can undermine confidence in healthy banks and threaten the ability of the banking system as a whole to play its vital role in supporting the savings and credit needs of households and businesses.  That is why, in response to these events, the Federal Reserve, working with the Treasury Department and the FDIC, took decisive actions to protect the U.S. economy and to strengthen public confidence in our banking system.  These actions demonstrate that all depositors’ savings and the banking system are safe.  With the support of the Treasury, the Federal Reserve Board created the Bank Term Funding Program to ensure that banks that hold safe and liquid assets can, if needed, borrow reserves against those assets at par.  This program, along with our long-standing discount window, is effectively meeting the unusual funding needs that some banks have faced and makes clear that ample liquidity in the system is available.  Our banking system is sound and resilient, with strong capital and liquidity.  We will continue to closely monitor conditions in the banking system and are prepared to use all of our tools as needed to keep it safe and sound.  In addition, we are committed to learning the lessons from this episode and to work to prevent events like this from happening again.  

Turning to the broader economy and monetary policy, inflation remains too high, and the labor market continues to be very tight.  My colleagues and I understand the hardship that high inflation is causing, and we remain strongly committed to bringing inflation back down to our 2 percent goal.  Price stability is the responsibility of the Federal Reserve.  Without price stability, the economy does not work for anyone.  In particular, without price stability, we will not achieve a sustained period of strong labor market conditions that benefit all.

also:

At today’s meeting the Committee raised the target range for the federal funds rate by 1/4 percentage point, bringing the target range to 4-3/4 to 5 percent.  And we are continuing the process of significantly reducing our securities holdings. 

Excerpts of Jerome Powell’s responses as indicated to various questions:

COLBY SMITH. Thank you, Colby Smith with the Financial Times. How confident is the Committee that the recent stress that we’ve seen, and you’ve alluded to, is contained at this point, and that deposit flight among mid-size lenders in particular, has ceased? 

CHAIR POWELL. Thanks, so I guess our view is the banking systems is sound and it’s resilient, it’s got strong capital liquidity. We took powerful actions with Treasury and the FDIC, which demonstrate that all depositors’ savings are safe and that the banking system is safe. Deposit flows in the banking system have stabilized over the last week. And the last thing I’ll say is that we’ve undertaken, we’re undertaking a thorough internal review that will identify where we can strengthen supervision and regulation. 

COLBY SMITH. Okay, just a quick follow-up; I mean given all the stress and the uncertainty that you’ve also alluded to in the statement, how seriously was a pause considered for this meeting? 

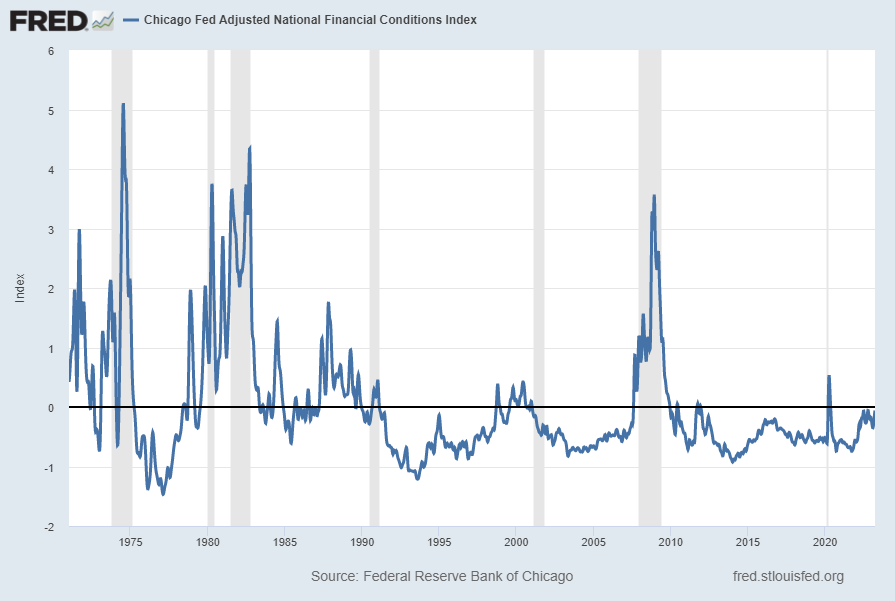
CHAIR POWELL. So, we considered, we did consider that in the days running up to the meeting and you see the decision that we made, which I’ll say a couple things about. First, it was supported by a very strong consensus, and I’ll be happy to explain why, and really it is that the intermeeting data on inflation and the labor market came in stronger than expected and really, before the recent events, we were clearly on track to continue with ongoing rate hikes. In fact, as of a couple of weeks ago, it looked like we’d need to raise rates over the course of the year more than we had expected at the time of the SEP in December, at the time of the December meeting. We are committed to restoring price stability and all of the evidence says that the public has confidence that we will do so, that we’ll bring inflation down to 2 percent over time. It is important that we sustain that confidence with our actions as well as our words. So, we also assess, as I mentioned, that the events of the last two weeks are likely to result in some tightening credit conditions for households and businesses and thereby weigh on demand on the labor market and on inflation. Such a tightening in financial conditions would work in the same direction as rate tightening. In principle as a matter of fact, you can think of it as being the equivalent of a rate hike or perhaps more than that, of course it’s not possible to make that assessment today with any precision whatsoever. So our decision was to move ahead with the 25 basis point hike and to change our guidance, as I mentioned, from ongoing hikes to some additional hikes maybe, some policy firming may be appropriate. So going forward, as I mentioned, in assessing the need for further hikes, we’ll be focused as always on the incoming data and the evolving outlook, and in particular on our assessment of the actual and expected effects of credit tightening.

also:

STEVE LIESMAN.  Do you have concerns that the recent, that the hike you did today could further exacerbate the problem in the banks? 

CHAIR POWELL.  No, I mean with our monetary policy, we’re really focused on macroeconomic outcomes, in particular we’re focused on this potential credit tightening and what can that produce in the way of tighter credit conditions. I think when we think about the situation with the banks, we’re focused on our financial stability tools in particular our lending facilities, the debt, sorry, the discount window and also the new facility. 

also:

JEANNA SMIALEK.  Hi Chair Powell, Jeanna Smialek from the New York Times. Thank you for taking our questions. I wonder if you could talk a little bit, I know that you’ve got your internal review coming, but I wonder if you could talk a little bit about what you think happened with oversight at Silicon Valley Bank, and whether this suggests that something about regulation and supervision needs to actually change going forward. And I wonder, how can the American people have confidence that there aren’t other weaknesses out there in the banking system, given that this one got missed, as you noted? 

CHAIR POWELL.  So let me say what I think happened and then I’ll come to the questions around supervision. So, at a basic level, Silicon Valley Bank management failed badly, they grew the bank very quickly, they exposed the bank to significant liquidity risk and interest rate risk, didn’t hedge that risk. We now know that supervisors saw these risks and intervened. We know that the public saw all this. We know that SVB experienced an unprecedentedly rapid and massive bank run. So this is a very large group of connected depositors, concentrated group of connected depositors, in a very, very fast run, faster than historical record would suggest. So, as for us, so for our part, we’re doing a review of supervision and regulation, my only interest is that we identify what went wrong here. How did this happen is the question. What went wrong? Try to find that. We will find that. And then make an assessment of what are the right policies to put in place so that it doesn’t happen again and then implement those policies. It would be inappropriate for me at this stage to offer my views on what the answers might be. I simply can’t do that. Vice Chair Barr is leading this, and I think he’s testifying next week. So, but that will be up to him. So that’s really where it is, the review is going to be thorough and transparent. It is clear, really to your last question, it is clearly we do need to strengthen supervision and regulation. And I assume that there will be recommendations coming out of the report and I plan on supporting them and supporting their implementation. 

JEANNA SMIALEK. And the final point, can we feel confident that these weaknesses don’t exist elsewhere, given that they got missed at this bank? 

CHAIR POWELL.  These are not weaknesses that are at all broadly through the banking system. This was a bank that was an outlier in terms of both its percentage of uninsured deposits and in terms of its holdings of duration risk. And again, supervisors did get in there and they were, as you know obviously, they were on this issue, but nonetheless, this still happened. And so that’s really the nature of the interview, sorry, of the review, is to discover that. 

also:

RACHEL SIEGEL.  Hi Chair Powell. Rachel Siegel from the Washington Post. Thank you for taking our questions. I know we’ve talked a bit about how Silicon Valley Bank was unique to a certain sector of the economy, but there’s also growing concern that there are financial stability risks from the commercial real estate market and loans that will begin to roll over later this year and next, and that smaller regional banks also disproportionately hold those loans. Is there a risk that could mimic the kind of, what we saw with SVB to banks that disproportionately are focused in commercial real estate? 

CHAIR POWELL.  So we’re well-aware of the concentrations people have in commercial real estate, I really don’t think it’s comparable to this. The banking system is strong, it is sound, it is resilient, it’s well-capitalized and I really don’t see that as at all analogous to this. 

RACHEL SIEGEL. And one other question, would you be open to an independent investigation separate from the Fed’s probe? 

CHAIR POWELL.  I welcome, it’s 100 percent certainty that there will be independent investigations and outside investigations and all that. So, we welcome, when a bank fails, there are investigations and of course we welcome that. 

also:

KYLE CAMPBELL. Hi Chair Powell, thanks for taking the question. Kyle Campbell with American Banker. I have a couple questions about the balance sheet. First of all, I’m curious at what point the financial supports that the Fed is extending through the discount window and through its enhanced lending facility, might be at odds with the objective of reducing the balance sheet. And I’m also curious what your thoughts are on the, not just the availability of reserves but the distribution of them throughout the banking system and at what point you might be concerned about it being scarce for certain banks. 

CHAIR POWELL. So people think of QE and QT in different ways, so let me be clear about how I’m thinking about these recent developments. So the recent liquidity provision that has increased the size of our balance sheet, but the intent and the effects of it are very different from what we, from when we expand our balance sheet through purchases of longer term securities. Large scale purchases of long-term securities are really meant to alter the stance of policy by pushing down, pushing up the price and down the rates, longer term rates, which supports demand through channels we understand fairly well. The balance sheet expansion is really temporary lending to banks to meet those special liquidity demands created by the recent tensions, it’s not intended to directly alter the stance of monetary policy. We do believe that it’s working, it’s having its intended effect of bolstering confidence in the banking system and thereby forestalling what otherwise have been an abrupt and outsized tightening in financial conditions. So that’s working. In terms of the distribution of reserves, we don’t see ourselves as running into reserve shortages, we think that our program of allowing our balance sheet to run off predictably and passively is working. And of course we’re always prepared to change that if that changes, but we don’t see any evidence that that’s changed. 

also:

SIMON RABINOVITCH. Hi, Simon Rabinovitch with the Economist, thank you very much. Chair Powell, you stated twice today that all depositors’ savings in the banking system are safe. Are you saying that de facto deposit insurance covers all savings? Shouldn’t Congress have a say in that and just by way of example, if a bank with less than a billion dollars in assets failed are you promising to bail out all of its depositors? 

CHAIR POWELL. Well, I’m not saying anything more than I’m saying. So, but what I’m saying is you’ve seen that we have the tools to protect depositors when there’s a threat of serious harm to the economy or to the financial system and we’re prepared to use those tools. And I think depositors should assume that their deposits are safe. 

_____

_____

The Special Note summarizes my overall thoughts about our economic situation

SPX at 3962.38 as this post is written